Correction Is Not a Reversal — Gold Is Reloading 1. Market Structure Overview
- Gold is still trading within a medium-term bullish structure, but price has entered a short-term corrective phase after failing to hold above the upper resistance zone.
- Strong rejection occurred at the POC / resistance area 4.35x – 4.38x, confirming active profit-taking.
The current price action is developing a classic ABC correction:
- Wave A: Completed with a sharp pullback.
- Wave B: Ongoing technical rebound.
Importantly, price remains above the major moving averages, meaning the primary uptrend is still intact.
This correction is technical in nature, not a trend reversal.
2. Market Context & Liquidity Behavior
Sellers are active near the highs, but downside momentum remains controlled.
The market is likely seeking liquidity clearance before deciding the next impulsive move.
The 4.26x – 4.20x zone stands out as a key re-accumulation area where buyers may step back in.
3. Today’s Price Scenarios
🔹 Primary Scenario (High Probability)
Price continues its corrective leg toward 4.26x – 4.20x.
This zone acts as a decision point:
Holding above it → supports re-accumulation and trend continuation.
Strong breakdown → opens room for a deeper short-term correction.
🔹 Alternative Scenario (Lower Probability)
Failure to reclaim strength after the correction may extend downside pressure.
Confirmation only occurs if support is decisively broken with volume.
4. Intraday Trading Setups — Re-Accumulation Focus
📌 SETUP 1 – Intraday Sell (Correction Timing)
XAUUSD SELL ZONE: 4369 – 4372
Take Profit: 4366 – 4361
Stop Loss: 4376
📌 SETUP 2 – Intraday Buy (Re-Accumulation Zone)
XAUUSD BUY ZONE: 4262 – 4265
Take Profit: 4268 – 4273
Stop Loss: 4258
⚠️ Always apply strict risk management to protect capital.
5. Summary & Trading Guidance
Main Trend: Bullish
Short-Term State: Correction → Re-accumulation
Bias: Wait for price to reach key zones, avoid chasing highs
👉 Today’s session is a balancing phase. The market’s reaction at the support zone will define whether gold resumes its uptrend or extends the correction. Patience and discipline remain the optimal strategy.
Traders

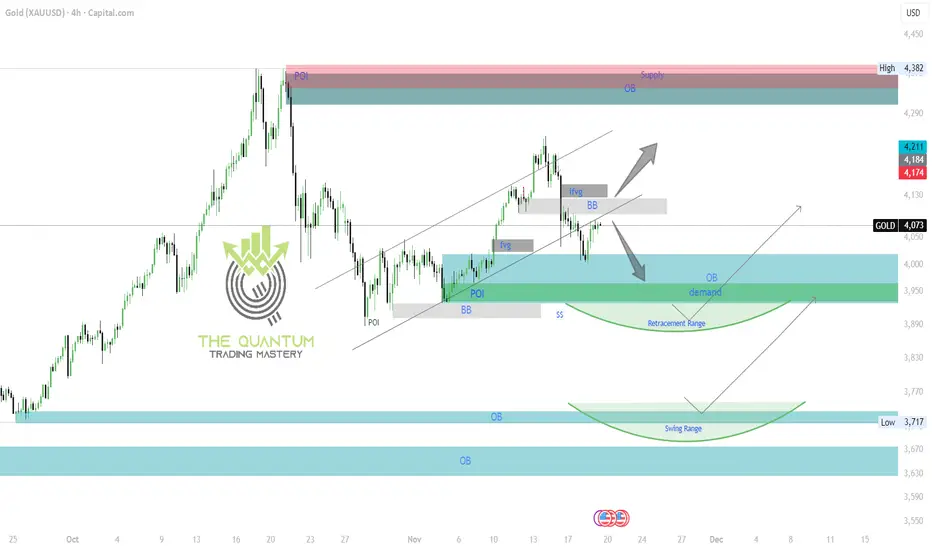
GOLD 4H CHART ROUTE MAP UPDATE & TRADING PLAN FOR THE WEEKGold 4H Analysis
On the 4H chart, price is currently moving between two major weighted levels, with an imbalance (gap) above around 4124 and another below near 4000. As long as price remains trapped between these zones, we should expect a series of side-to-side tests until one of the weighted levels breaks and holds to confirm the next directional range.
With this structure in mind, the plan remains to buy dips from our key support levels. These updated levels — including POI, BB, OB, and demand zones — help us track the move downward and catch bullish reactions as price bounces.
Scenario 1:
If price rejects from above at the BB zone at 4115–4120, we anticipate a bearish move back toward the OB + Demand zone, potentially into the Retracement Range, to sweep liquidity.
A 4H candle closing below the Demand zone around 3930 would confirm a deeper leg into the Swing Range near the 3700 levels.
If the 4H candle does not close below demand and only performs a liquidity sweep, then we expect a push to higher levels afterward.
Scenario 2:
If price cross above level, the BB zone at 4115–4120, we consider bullish and target will be above supply zone at 4330.
Note:
The Swing Range produces much larger bounces compared to our weighted levels, which is the key difference between the two.
Continue buying dips at our support levels, aiming for 20–40 pip scalps.
Each structural level we mark is designed to give 20–40 pip bounces — ideal for clean entries and exits.
Please boost, share and comment if you like the idea and analysis.
The QUANTUM TRADING MASTERY
Bitcoin Is Trapped in a High-Liquidity RangeMarket Structure (H1)
Bitcoin is currently locked inside a clearly defined range, capped by a heavy resistance zone around 90,500 and supported by a well-defended demand area near 85,200. Price action inside this box is choppy and overlapping, with repeated sweeps of both highs and lows — a classic liquidity-building environment rather than a trending phase.
The sharp sell-off from the left side of the chart established a lower structural regime, after which BTC transitioned into sideways rotation. Each bounce toward resistance fails to achieve acceptance, while each dip into support is aggressively defended. This confirms balance, not strength or weakness.
Liquidity & Price Behavior
The green projected swings highlight how price is likely to continue oscillating between resistance and support, hunting liquidity on both sides. This behavior typically precedes a range expansion, but until a clean breakout occurs, moves inside the range remain low-probability and noise-driven.
Macro & U.S. Policy Context
From a macro perspective, Bitcoin remains constrained by unfavorable U.S. conditions:
The Federal Reserve maintains a restrictive policy stance, keeping real yields elevated.
A relatively strong USD continues to pressure risk assets.
Liquidity conditions remain tight, reducing follow-through on upside attempts.
These factors explain why BTC struggles to accept above resistance despite multiple tests — macro headwinds are capping momentum.
Conclusion
Bitcoin is not trending it is accumulating liquidity.
Above 90,500 with acceptance → upside expansion becomes likely.
Failure at resistance → continued rotation and potential downside sweep toward support.
Until price leaves the range with intent, patience is the edge.

ETH Is Bouncing — But This Is Still a Reaction, Not a BreakoutMarket Structure (H1)
Ethereum is showing a clear rebound from the 2,750–2,800 support zone, confirming that buyers are defending demand effectively. The impulse off support is strong, but structurally ETH remains below two key resistance layers — the first around 3,000–3,050, and the higher supply zone near 3,150–3,200. As long as price trades beneath these zones, the broader structure remains corrective.
Price Action & Context
The recent sell-off flushed downside liquidity, which often leads to sharp relief bounces. However, current price action still fits a range-to-range rotation rather than trend continuation. A rejection from the first resistance would likely form a lower high, keeping ETH compressed inside the larger consolidation. Only clean acceptance above resistance would shift control back to buyers.
Macro & U.S. Policy Backdrop
Macro conditions remain a headwind for crypto:
- The Federal Reserve is maintaining a restrictive stance, with rate cuts not yet clearly signaled.
- U.S. yields remain elevated, supporting the USD and limiting risk-asset expansion.
- Liquidity conditions favor short-term trades, not sustained upside trends.
This macro environment explains why rebounds are fast but often lack follow-through.
Conclusion
ETH is reacting well from support, but this move is still technical in nature.
- Acceptance above 3,000–3,050 is required to unlock upside continuation.
- Failure at resistance keeps ETH vulnerable to another rotation lower.
For now, this is a relief rally inside consolidation patience and confirmation remain key.

EURUSD Lost Momentum — And the Pullback Is Not Finished YetHello Guys
EURUSD on H1 has shifted from impulsive upside into a clear corrective phase after failing to hold above the prior structure high. The sharp rejection from the top was followed by strong bearish candles that broke back below the key intraday support around 1.1710, signaling that buyers have stepped aside and short-term control has rotated to sellers. Current price action shows weak rebounds and lower highs, consistent with a corrective unwind rather than consolidation for continuation.
Structurally, price is now retesting broken support from below, which is acting as resistance. As long as EURUSD remains capped under the 1.1710–1.1720 zone, the path of least resistance stays to the downside. The projected sequence favors a brief corrective bounce, followed by continuation lower toward the next demand zone around 1.1680–1.1690, where stronger buying interest may reappear.
From a macro perspective, this technical pullback aligns with a short-term USD bid driven by cautious risk sentiment and relative strength in U.S. data. With the Fed maintaining a restrictive stance longer than the ECB and rate differentials still favoring the dollar, EUR upside lacks strong macro support in the near term. This environment reinforces the idea that EURUSD rallies are corrective unless macro conditions shift meaningfully.
In summary, EURUSD is in a short-term corrective decline. Below reclaimed resistance, downside continuation toward lower support remains favored. This is not a trend-reversal setup yet, but a momentum reset — patience is required until price reaches demand or macro conditions change enough to justify renewed euro strength.

Why We Think Retail Trader Exit Their Position | Smart MoneyThis video explains why retail traders often exit their positions early, especially on the first candle. The discussion focuses on how early volatility, emotional reactions, lack of structure clarity, and liquidity-driven price behavior can force premature exits. By observing first-candle behavior and market structure, the video highlights common mistakes that lead traders to exit before the market reveals its true intent.
The purpose of this video is to build awareness around early-session price behavior and help understand why retail traders struggle to hold positions—purely from an educational and price-action perspective.

Gold Is Quiet — But Pressure Is BuildingGold is maintaining a bullish continuation structure, not showing signs of distribution.
- Trend: Price is moving inside a rising channel with higher lows intact.
- Structure: Pullbacks are corrective and shallow, showing buyers defending each dip.
- Dynamic Support: Price is holding above EMA 34 & EMA 89 → bullish control remains.
Key Levels:
- Target 1: 4,348
- Target 2 (Old ATH): 4,379
Outlook
Primary scenario: Consolidation → push to Target 1 → extension toward Old ATH.
Alternative: Short-term pullback to channel support to reload before continuation.
Focus:
As long as price holds above the rising channel and EMAs, bias stays bullish.
Patience here is part of the trade.

Smart Money Is Testing Patience — Not Selling YetEthereum is currently consolidating inside a clear range, not breaking trend.
- Structure: Price rejected from the resistance zone and dropped into the lower range, but support is holding.
- Behavior: The sideways movement near support shows liquidity absorption, not panic selling.
Key Levels:
- Support zone remains intact
- Resistance zone is still the ceiling to watch
Outlook
Primary scenario: Range hold → base formation → rebound toward range high / resistance
Invalidation: Only a clean breakdown below the support zone changes the bias
Key Focus:
Do not chase candles. Let the market show direction after accumulation.

Gold Is Not Hesitating — It Is Building Energy for a New ATH.Gold on the H1 timeframe continues to display a bullish consolidation directly below the previous high at 4,380 , a structure that typically precedes continuation rather than reversal. Price is holding firmly inside a well-defined range, with higher lows forming repeatedly while pullbacks remain shallow and controlled. This behavior signals absorption of supply, not distribution sellers are active near resistance, but they are failing to push price into acceptance below the support zone. As long as Gold holds above the 4,260–4,270 support area, the broader bullish structure remains intact.
From a market-structure perspective, this sideways action below ATH reflects strength. In strong trends, markets often pause near highs to build liquidity before expanding again. The repeated tests of the upper range, combined with higher lows, suggest pressure is coiling rather than fading. A clean acceptance above 4,380 would likely unlock a break into new ATH territory , while failure to break simply extends the consolidation phase, not invalidates the trend.
From a macro standpoint, conditions remain supportive for Gold. U.S. monetary policy expectations continue to lean toward easing in 2025, keeping real yields capped and limiting sustained USD strength. At the same time, ongoing geopolitical risks and global economic uncertainty continue to underpin safe haven demand. These factors reduce the probability of a deep corrective sell-off and favor sideways-to-higher price action instead.
Bottom line: Gold is not topping it is positioning. As long as support holds, the technical and macro alignment favors a breakout above the previous high. Patience is required, but the bias remains firmly bullish until proven otherwise.

Ethereum Is Compressing After Repeated Sell-OffOn the H1 timeframe, Ethereum continues to show a clear bearish structure, defined by a series of sharp impulsive sell-offs followed by weak, overlapping consolidations. Each prior bounce has failed to develop into a meaningful recovery, and price continues to form lower highs, confirming that sellers remain in control. The current sideways movement near 2,840 is corrective in nature, not a base for reversal.
Structurally, ETH is displaying a classic bearish pause: volatility expansion to the downside, followed by tight compression with declining momentum. This type of price behavior typically precedes continuation, not reversal. As long as price remains capped below the recent breakdown area, the probability favors another leg lower, with downside liquidity sitting below the current consolidation range.
From a macro and U.S. policy perspective, Ethereum remains under pressure from the same forces weighing on broader crypto markets. The Federal Reserve’s restrictive monetary stance, elevated real yields, and a relatively firm USD continue to drain liquidity from risk assets. In addition, ETH lacks a near-term narrative strong enough to offset macro headwinds, especially in an environment where capital remains selective and risk appetite is subdued.
Bottom line:
Ethereum is not building strength it is absorbing supply after repeated sell-offs. Until macro conditions ease or ETH reclaims key resistance with acceptance, rallies should be treated as temporary pauses within a broader bearish sequence, with downside continuation remaining the higher-probability scenario.

BTC Is Not Bottoming Yet — This Is a Controlled Sell-Side On the H4 timeframe, Bitcoin continues to trade within a clear downtrend structure. Each rebound has produced a lower high, followed by renewed selling that prints lower lows. The sideways boxes on the chart are not accumulation phases; they function as distribution / position-unwinding zones within a broader bearish trend, where price pauses to build liquidity before continuing lower. At this stage, BTC is still inside a weak corrective bounce and has not reclaimed any key structure that would justify a trend reversal narrative.
Key technical levels to respect:
- Near-term resistance / supply: 87.7k–88.0k (marked resistance zone). Failure to accept above this area keeps rallies corrective.
- Range support / demand: 85.1k–85.3k (range low). A clean break below this zone would confirm downside continuation.
- Structural liquidity target: 74.8k, the next major downside magnet if the range resolves lower.
Expected price behavior:
BTC is likely to continue short-term ranging, producing several push-and-fail attempts below resistance before rotating back toward the range low. A decisive breakdown of the range floor would open the path toward the 74.8k liquidity zone. Only a sustained reclaim and acceptance above 87.7k–88.0k would invalidate the current bearish structure.
Macro & U.S. Policy: Why Conditions Remain Unfavorable for Crypto
1) Monetary policy remains restrictive.
Despite expectations for gradual easing in 2025, U.S. monetary policy is still firmly in restrictive territory. This environment limits risk appetite and historically weighs on high-beta assets like crypto when liquidity expansion is absent.
2) Policy uncertainty suppresses risk-on behavior.
Ongoing ambiguity around the Fed’s policy path and broader U.S. macro direction keeps markets cautious. In such conditions, Bitcoin tends to move sideways or trend lower rather than sustain impulsive upside moves.
3) Regulatory and headline risk persists.
While long-term regulatory clarity may ultimately benefit the crypto space, near-term developments around regulation and oversight continue to act as headline risk, reinforcing defensive positioning especially during periods of thinner liquidity.
Conclusion:
Technically, BTC remains under sell-side control on H4, and macro conditions in the U.S. do not yet support a clean risk-on reversal. Until Bitcoin reclaims key resistance and breaks the sequence of lower highs, the higher-probability scenario remains range → breakdown → continuation toward lower demand.

Bitcoin Isn’t Bouncing It’s Reloading for the Next DropBITCOIN (BTCUSD) – H1 MARKET ANALYSIS
1. Current Market Structure
Bitcoin is maintaining a clear short-term bearish structure on the H1 timeframe. Price continues to form lower highs and lower lows, confirming that sellers remain in control. The recent bounce is corrective and lacks follow-through, signaling weakness rather than trend reversal.
Key structural points:
- Breakdown below previous consolidation blocks
- Failure to reclaim prior value areas
- Bearish momentum remains dominant
2. Moving Averages & Trend Confirmation
- EMA 34 (blue) is acting as dynamic resistance
- EMA 89 (red) defines the broader bearish trend
Price remains below both EMAs, and every attempt to move higher is rejected a classic trend-following sell environment.
This alignment confirms that:
- Rallies are selling opportunities
- Trend continuation is favored over mean reversion
3. Consolidation & Liquidity Behavior
Bitcoin is currently compressing sideways just below resistance, forming a short consolidation range. This behavior indicates:
- Liquidity is being built
- Buyers are failing to regain control
- Market is preparing for the next impulsive move
In bearish conditions, this type of consolidation typically resolves to the downside.
4. Scenarios Ahead
Primary Scenario – Bearish Continuation (High Probability):
- Price continues to range briefly below EMA resistance
- Liquidity builds within the gray consolidation zone
- Breakdown triggers the next leg lower
Downside objectives:
- First support: ~85,800
- Expansion zone: 85,000 – 84,500 (liquidity draw)
Invalidation Scenario:
- Only valid if price breaks and holds above EMA 89
- Structure must shift to higher highs on H1
Until then, upside moves remain corrective.
5. Trading Bias & Conclusion
Bias: Sell rallies
Market State: Bearish trend + corrective consolidation
Strategy: Follow structure, wait for breakdown confirmation
Bitcoin is not reversing it is pausing before continuation.
As long as price stays below key moving averages and resistance zones, the path of least resistance remains downward.

Risk Management Is Not Protection... It’s Your Edge!!!Most traders treat risk management like a seatbelt.
Something you use just in case.
🧳Professionals treat risk management as their main edge.
Because in trading, you don’t get paid for being right...
you get paid for staying in the game long enough for probabilities to work.
1️⃣ Risk Is Defined Before the Trade Exists
Before you think about entries or targets, one question must already be answered:
Where am I wrong?
If you don’t know where your idea fails,
you’re not managing risk... you’re hoping.
Professionals define risk first.
The trade only exists after invalidation is clear.
2️⃣ Small Risk Creates Big Freedom
When risk is small and predefined:
- hesitation disappears
- emotions calm down
- execution improves
Why?
Because no single trade matters anymore.
You stop needing trades to work, and that’s when trading becomes objective.
3️⃣ Risk Management Turns Losses Into Data
Losses are unavoidable.
Damage is optional.
A controlled loss is not a failure; it’s information.
Every loss tells you:
- the market condition wasn’t right
- the timing was early
- or the structure changed
When risk is managed, losses educate instead of punish.
4️⃣ Consistency Is Built on Risk, Not Wins
Winning streaks feel good.
They don’t build careers.
Surviving losing streaks does.
Proper risk management ensures:
- drawdowns stay shallow
- confidence stays intact
- discipline stays repeatable
That’s how traders last long enough to improve.
💡The Real Truth
You don’t need a better strategy.
You need better control over downside.
Risk management is what allows:
- imperfect strategies to work
- average win rates to grow accounts
- traders to evolve instead of quit
⚠️ Disclaimer: This is not financial advice. Always do your own research and manage risk properly.
📚 Stick to your trading plan regarding entries, risk, and management.
Good luck! 🍀
All Strategies Are Good; If Managed Properly!
~Richard Nasr

Gold Is Holding Firm Into Year-End — A Santa Rally Is Setting UpGold on H4 continues to trade in a strong bullish structure, consolidating just below the key resistance zone around the previous high. Price is holding comfortably above the rising EMA base, with higher lows intact, confirming that buyers remain in control despite short-term pullbacks. This sideways-to-higher behavior beneath resistance signals absorption rather than distribution, as selling pressure fails to force acceptance below the support zone. Structurally, this is a classic bullish consolidation, where the market pauses to build liquidity before the next directional move.
From a macro perspective, the setup is supported by typical year-end dynamics. As liquidity thins into the Christmas period, markets often shift into range compression followed by sharp directional expansions. At the same time, expectations around U.S. monetary policy remain tilted toward easing in 2025, keeping real yields capped and limiting sustained USD strength. Combined with ongoing geopolitical and macro uncertainty, this environment continues to favor Gold as a defensive asset.
As long as price holds above the support zone and maintains acceptance below resistance, the bullish bias remains intact. A clean breakout and hold above resistance would likely open the path toward a new ATH, while failure to break simply extends consolidation rather than signaling a top. For now, this is a patience phase OANDA:XAUUSD is not stalling, it is positioning.

Gold Is Trapped Between Control ZonesGold on H1 remains locked inside a clearly defined range, with price oscillating between a well-defended support zone around 4,260 and a heavy resistance band near 4,350–4,360. The broader structure is still constructive, as higher lows continue to form above the rising EMA base, confirming that buyers have not lost control. Repeated failures to accept above resistance show that sellers are active at the highs, compressing price rather than reversing the trend a classic balance phase where liquidity is building on both sides. From a macro perspective, this consolidation aligns with a cautious market stance ahead of key U.S. data and ongoing uncertainty around Fed policy, where neither USD strength nor risk-off flows are decisive enough to force a breakout. As long as real yields remain capped and expectations around rate cuts stay supportive, downside moves in Gold are more likely corrective than trend-breaking. A clean acceptance above the resistance zone would signal macro and technical alignment for expansion toward new highs, while rejection simply prolongs consolidation and reinforces patience. In this environment, chasing moves inside the range offers low edge the opportunity emerges only when price exits the box with clear intent.

Gold Is Compressing Under ATH — Macro Is Still on Its SideHello Guys
Gold on H1 remains in a bullish consolidation just below the previous high around 4,380, with price rotating cleanly inside a well-defined range. This structure reflects strength, not exhaustion: pullbacks are shallow, higher lows continue to form, and sellers have failed to generate acceptance below the support zone. Price behavior suggests absorption, where supply is being gradually consumed while the market builds energy for expansion rather than reversing.
From a macro perspective, this consolidation aligns with a supportive backdrop for Gold. Expectations around U.S. monetary policy remain tilted toward easing rather than renewed tightening, keeping real yields capped and limiting USD upside. At the same time, persistent geopolitical and macro uncertainty continues to underpin demand for safe-haven assets. These conditions reduce the probability of a deep corrective sell-off and favor sideways-to-higher price action instead.
As long as Gold holds above the support zone and continues to accept value below ATH, the broader bias remains bullish. A clean acceptance above 4,380 would signal alignment between technical structure and macro conditions, opening the door for a push toward a new ATH. Until that breakout occurs, this remains a patience phase consolidation is the setup, not the signal.
What do you think about OANDA:XAUUSD ?

ETH Finishes Wave 5 — Is an ABC Reversal Starting?ETH/USD – H4 MARKET ANALYSIS
1. Market Structure
- Ethereum has completed a full 5-wave bearish Elliott structure (1–2–3–4–5).
The strongest selling pressure appeared during Wave (3), followed by a final capitulation move at Wave (5).
- After reaching the Wave (5) low, price failed to make a new low and instead began forming a small accumulation base, signaling seller exhaustion.
This confirms that the bearish impulse has ended, and the market is transitioning into a corrective recovery phase.
2. Elliott Wave Context
Wave (5) completion → end of the bearish cycle
Price reaction from the low aligns with Wave A
Current structure suggests a corrective ABC move, not a trend reversal
Expected path:
Wave A: Initial technical rebound
Wave B: Shallow pullback to absorb supply
Wave C: Continuation higher toward resistance
3. Key Technical Zones
Demand Zone: Wave (5) low (critical invalidation level)
Resistance 1: Previous Wave (4) structure
Resistance 2: Higher structural + MA confluence (Wave C target)
As long as price holds above the Wave (5) low, the corrective scenario remains valid.
4. Scenario Outlook
✅ Primary Scenario (High Probability)
Price holds above Wave (5) low
ABC correction continues to unfold
Wave C pushes price higher into resistance
This is a technical rebound, not a macro trend reversal
⚠️ Alternative Scenario
Strong breakdown below Wave (5) low
→ Elliott structure invalidated
→ Bearish trend resumes
5. Trading Bias
Short-term: Buy the dips within the ABC structure
Avoid chasing impulsive moves
Focus on pullbacks during Wave B
Strict risk management is required — this is a corrective phase
Summary
Ethereum has completed a bearish Elliott cycle and is now entering a corrective ABC recovery.
As long as the Wave (5) low holds, short-term upside remains favored.

Gold Is Quiet — And That’s Exactly When Breakouts Are BuiltGold is not breaking out yet — it is building pressure.
After the impulsive move, price is now compressing inside a clear accumulation zone, showing repeated defenses from buyers while sellers fail to push price meaningfully lower. This sideways structure signals absorption rather than weakness. As long as Gold holds above the 4,260–4,270 key zone, the broader bullish structure remains intact and the market is preparing for expansion. A clean break and hold above this range would open the path toward breaking the old ATH. Until that happens, this is a patience phase not a chase phase.

Ethereum May Have Finished the Sell-Off — Now Comes the TestOn the H4 timeframe, Ethereum’s price action aligns well with a completed 5-wave Elliott impulse to the downside. Wave (1) initiated the breakdown from the prior distribution range, followed by a weak corrective Wave (2) that failed to regain structure. Wave (3) unfolded as the strongest and most extended leg lower, confirming dominant bearish momentum a textbook characteristic of a third wave. This was followed by a shallow, overlapping Wave (4), before ETH printed a final Wave (5) sell-off into the 2,880–2,950 region, where downside momentum visibly slowed, suggesting selling exhaustion.
With Wave (5) likely completed, ETH now appears to be transitioning into a corrective ABC structure to the upside. The initial rebound from the lows can be interpreted as Wave A, followed by a potential pullback to form Wave B, before a broader Wave C advance toward the upper resistance zone around 3,400–3,450. This type of move would represent a technical recovery, not a confirmed trend reversal, consistent with post impulse Elliott behavior.
From a macro perspective, this Elliott setup fits the current environment. Broader crypto markets are stabilizing as risk sentiment improves modestly and no new liquidity shock is present. Expectations around U.S. monetary policy remain relatively steady, with yields no longer accelerating higher a condition that reduces pressure on risk assets like ETH. However, the absence of aggressive liquidity expansion also implies that any upside is more likely corrective and structured, rather than impulsive and trend-defining.
In summary, as long as the Wave (5) low holds, the Elliott framework supports a recovery via an ABC correction. A decisive break below that low would invalidate the count and reopen bearish continuation risk. Until confirmation is clear, patience remains critical the edge lies in letting both structure and macro conditions align before committing.

Gold Is Tricking Everyone Right Now-The Real Move Hasn’t StartedGOLD MARKET ANALYSIS – XAUUSD (H1)
1. Market Structure Overview
- Gold is currently in a short-term corrective phase after failing to immediately break above the 4350 Resistance Zone.
- The market has transitioned from impulsive bullish expansion into a controlled pullback, forming a range-bound structure between resistance and support.
- Despite the pullback, the overall structure remains bullish, as price is still holding above the last major breakout base.
This move is corrective, not distributive.
2. Key Support & Resistance Zones
Major Resistance Zone:
🔴 4350 – 4355
→ Previous rejection zone + supply absorption area.
Highest High / Target:
⚫ 4381
→ Liquidity magnet above range highs.
Major Support Zone:
🟢 4255 – 4260
→ Strong demand zone and reaction base.
This range defines the current battlefield between buyers and sellers.
3. Market Scenarios
Primary Scenario – Support Hold → Bullish Continuation (High Probability)
Price continues to pull back into the 4255 support zone.
Sellers lose momentum inside support.
Buyers step in, forming a higher low.
Gold rotates back toward resistance.
🎯 Targets: 4350 – 4355
Extension toward 4381 (Highest High / Liquidity Target)
This matches the classic sequence:
Pullback → Support reaction → Trend continuation
Alternative Scenario – Range Expansion Failure (Low Probability)
Only valid if 4255 breaks with strong momentum.
This would trigger a deeper correction toward 4200 – 4220.
No structural evidence currently supports this scenario.
4. Market Psychology & Liquidity Behavior
- Late buyers are getting shaken out during the pullback.
- Smart money is not selling aggressively volume is decreasing into support.
- Price behavior shows liquidity recycling, not panic selling.
- This is a textbook cooling phase before continuation.
The market is pausing to reset momentum, not reversing.
5. Trading Bias & Execution Insight
Bias: Bullish after correction
No chasing price in the middle of the range.
Best opportunities:
✔ Buy reaction from 4255 – 4260
✔ Buy breakout & hold above 4355
Patience is required the expansion comes after compression.
Gold is respecting its structure perfectly:
Correct → Hold support → Reload → Break higher.

Bitcoin Faces a Major Decision Zone - Relief Rally 🔹 MARKET BRIEFING – BTC/USD (1H)
Market State:
– Bitcoin has completed a sharp corrective move and is now attempting a rebound from the local demand area.
– The current price action shows a technical relief bounce, not a confirmed trend reversal, with price moving back toward a well-defined supply zone.
Key Levels:
– Support / Demand Zone: 88,000 – 88,500
– Current Reaction Area: 89,300 – 89,600
– Strong Resistance Zone: 91,500 – 92,700
This resistance aligns with previous breakdown structure, making it a high-probability reaction area.
🌍 Macro Context – Why This Is Likely a Range-to-Reject Setup
– Fed Policy: The market remains in a data-dependent holding pattern. With no immediate dovish catalyst, liquidity expansion expectations are limited.
– Risk Assets: Equities and crypto are both showing mean-reversion behavior, not impulsive risk on flows.
– Liquidity Conditions: Recent downside move flushed short-term longs, enabling a bounce but macro liquidity does not yet support sustained upside continuation.
Next Move:
– A continued push toward 91,500–92,700 is possible as part of a corrective retracement.
– However, unless price reclaims and holds above the resistance zone, the higher-probability outcome remains rejection and continuation of range-bound or corrective structure.
– Acceptance above 92,700 would invalidate the bearish bias and shift focus to higher liquidity targets.
Bottom Line:
– This move is best viewed as a technical rebound into resistance, not a trend shift.
– Bitcoin is reacting to liquidity mechanics while waiting for a clear macro catalyst to define the next directional leg.

Gold Is at a Decision Point — Hold the Pullback or Reject Again?MARKET BRIEFING – XAU/USD (4H)
Market State:
Gold remains in a broader bullish structure, but short-term momentum has cooled after repeated rejection from the major resistance zone. Price is currently reacting around the EMA cluster, a critical decision area.
Key Levels:
– Resistance Zone: 4,330 – 4,360
– Dynamic Support (EMA area): ~4,260 – 4,270
– Major Demand Zone: 4,170 – 4,190
Price Action:
– The impulsive rally stalled under resistance, followed by a controlled pullback no panic selling, suggesting profit-taking rather than trend failure.
– Current candles show hesitation near the fast EMA, indicating buyers are testing commitment.
– As long as price holds above the EMA structure, the trend remains constructively bullish.
Scenario Outlook
Primary Scenario – Bullish Continuation:
– Price holds above 4,260 – 4,270
– Higher low forms
– Rotation back toward 4,330 – 4,360 resistance
– A clean acceptance above this zone opens the path toward new ATH
Alternative Scenario – Deeper Reset:
– Failure to hold EMA support
– Pullback extends into 4,170 – 4,190 demand
– This would be a structural retest, not a trend reversal
Macro Alignment (Why This Setup Makes Sense)
– Fed still restrictive, but rate-cut expectations remain alive, keeping Gold structurally supported
– US yields capped, limiting downside pressure
– Ongoing geopolitical uncertainty continues to provide underlying bid
Gold is not breaking down — it’s deciding.
This pullback is either the last reload before expansion, or a healthy reset into demand.
What do you think about GOLD at this level?

Gold Breaks the Triangle - Liquidity Targets Now in Sight📌 MACRO ANALYSIS REPORT — GOLD BREAKS THE TRIANGLE, BULLISH MOMENTUM ACCELERATES
1. Global Macro Environment
- Gold is navigating a highly supportive macro landscape as global financial conditions continue shifting toward lower yields, softer inflation, and rising risk-hedging flows. The U.S. economy has shown signs of gradual cooling most recently reflected in moderating labor data and softer inflation prints reducing pressure on the Federal Reserve to maintain restrictive policy. These developments keep real yields capped, which historically strengthens gold’s demand profile.
- In addition, rising geopolitical uncertainty and fragile sovereign debt dynamics in multiple regions (Europe, Middle East, parts of Asia) are reinforcing the global bid for safe-haven assets. Central banks especially in emerging markets have continued accumulating physical gold as part of long-term reserve diversification strategies. These macro forces combine to create a structural floor beneath gold prices.
2. U.S. Dollar & Treasury Dynamics
- The dollar has struggled to maintain upside momentum as markets increasingly price in the likelihood of policy normalization in 2025. Although the USD remains broadly resilient, the loss of bullish follow-through has weakened its pressure on commodities, especially gold.
- U.S. Treasury yields also remain near key cycle lows after a sharper than expected deceleration in inflation indicators. Lower yields reduce the opportunity cost of holding non yielding assets like gold, generating a more favorable environment for sustained upside movement. Combined with slowing global growth expectations, gold benefits from these yield/dollar dynamics aligning simultaneously.
3. Liquidity Conditions & Risk Sentiment
- Global liquidity conditions have improved subtly as several major central banks shift from tightening to neutral stances. China continues to inject targeted liquidity to stabilize domestic financial markets and support manufacturing. The Bank of Japan maintains accommodative conditions, while the ECB signals caution amid slowing Eurozone demand.
- Improved liquidity typically increases investors’ willingness to allocate capital toward alternative stores of value and inflation hedges—gold remains a primary beneficiary. Risk sentiment across global equities is stable but not euphoric, leaving investors open to diversifying into metals as a defensive balance.
4. Gold’s Structural Demand
Beyond short-term macro drivers, the long-term structural demand for gold continues to intensify.
- Central bank purchases remain near multi-year highs.
- Retail demand is being reinforced by inflation concerns, currency instability in several emerging markets, and elevated geopolitical risk.
- Institutional allocation into commodity baskets is increasing after years of underweight positioning.
This sustained structural demand provides a strong macro foundation supporting gold’s technical breakout.
5. Technical Confirmation Backed by Macro
- The chart shows a clear symmetrical triangle consolidation, a pattern typically appearing during periods of macro uncertainty. The strong breakout confirms that institutional flows are aligned with the broader macro narrative of falling yields and rising demand for safe haven exposure.
The current ascending leg reflects:
- Strong trend continuation
- Aggressive dip buying
- Absence of major supply zones until 4365–4370 liquidity
This aligns perfectly with the global macro backdrop favoring further upside movement.
6. Forward-Looking Macro Risks
While the outlook is constructive, a few key risks warrant monitoring:
- A surprise rebound in U.S. inflation could revive dollar strength
- Any aggressive Fed communication could temporarily suppress gold’s momentum
- Rapid easing in geopolitical tensions could reduce haven flows
However, none of these risks have materialized convincingly, allowing gold to maintain its bullish structure.
📈 Final Outlook
Gold’s breakout is supported not only by technical strength but also by a robust macro foundation: softening yields, a stalling dollar, central bank buying, improving liquidity, and persistent geopolitical risk.
As long as price maintains its higher-low structure and remains above channel support, the path toward the next major liquidity cluster at 4365–4370 remains firmly intact.
