XAUUSD Analysis: Rising Wedge StructureThe 1-hour chart of Gold (XAUUSD) is currently presenting a rising wedge structure, a pattern known for its potential reversal characteristics when it forms after a strong upward move. This wedge is neatly defined by converging support and resistance trendlines, capturing price action within a narrowing upward channel.
Scenario 1 – Bullish Breakout Above the Wedge Resistance
In the bullish case, if the price breaks above the upper resistance trendline decisively with strong momentum and volume, it will signal a continuation of the uptrend. This could push Gold prices toward $3,920–$3,960 and possibly even the psychological $4,000+ mark in the short term. For this to play out, the breakout should be clean and sustained, not a false spike followed by a quick sell-off. Traders looking for long opportunities should wait for a confirmation candle and place stops below the breakout zone.
Scenario 2 – Bearish Breakdown from the Wedge Support
Alternatively, if Gold fails to break out and drops below the wedge's lower support, it will trigger a bearish reversal pattern. This breakdown could accelerate downside momentum, pulling prices back toward $3,820, followed by $3,760, and possibly even $3,700 or lower. Such a breakdown would confirm the wedge's bearish implications and shift intraday sentiment into a corrective or reversal phase. In this scenario, short trades can be considered with strict stop-loss placement just above the breakdown candle.
Scenario 3 – Sideways Consolidation Before Decision
If neither a clear breakout nor breakdown occurs, Gold may enter a sideways consolidation zone around current levels ($3,860–$3,880). This would indicate temporary indecision in the market and a potential buildup before a sharp move in either direction. This type of price action can trap both bulls and bears if acted upon prematurely. Therefore, in this scenario, it is best to remain neutral and patient, waiting for volatility to pick a direction.
Final Thoughts for Traders
Gold is at a critical juncture, and traders must approach this setup with discipline. The rising wedge structure demands clear confirmation before execution, and each scenario offers its own opportunity — but also its risks. Always follow strict risk-reward ratios, and avoid emotional trades inside the wedge before confirmation.
Keep an eye on macroeconomic events or dollar strength/weakness that could act as a catalyst for the breakout or breakdown.
Tradesetup

ETH - Short Trade - Further Drop Ahead My Entry - 4012
My Stop Loss - 4,240
Target 1 - 3,355
Target 2 - 2,655
Target 3 - 1,646
Target 4 - 1,225
Shorting per trendline breakdown and successful retest shown.

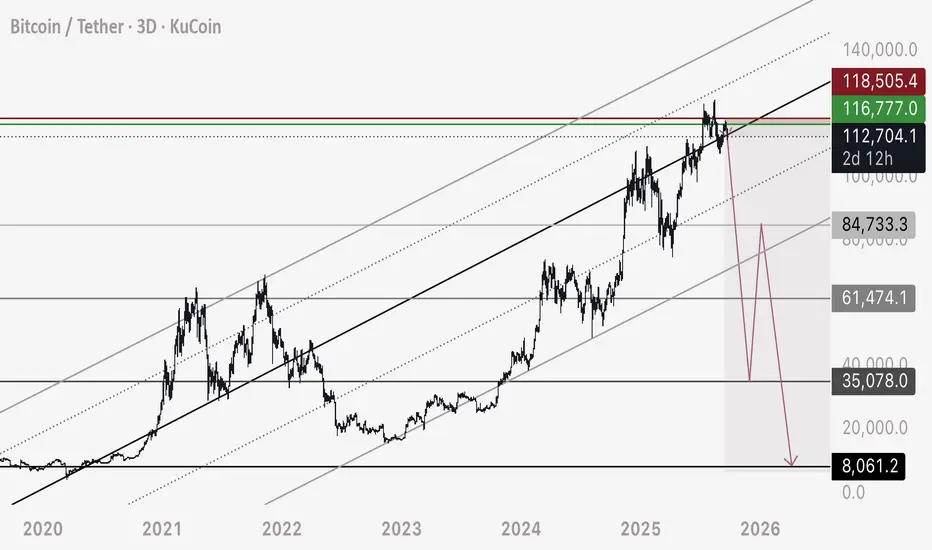
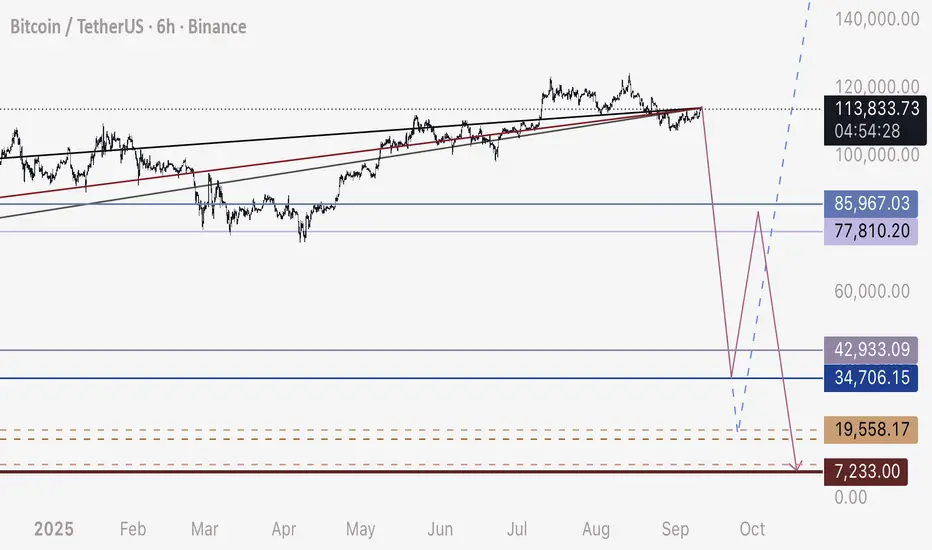
BTC - Short Initiated from Channel Breakdown Short Update going to plan.
Updated numbers and anticipated 3 wave corrective drop marked on chart.
113,000 to 35,000 (SHORT)
35,000 to 84,000-85,000 (LONG)
84,000 to 8,000 (SHORT)
For my personal trade I will be closing roughly 80% of short at 40,000-45,000
I will then look for a hold and rise from the 35,000 region to validate that we will see this corrective move. I believe there is a high probability of this - reasons I will detail more as the trade progresses. Chart would be too messy if I included all information on future confluences and pivot points.
If I see this rise occur, I will hold the 20% original short - and hedge with a long as well to 80,000 - 35,000 to 80,000
The reason the market is dropping is once again:
1. The significance of DXY breaking down a major multi month bearish channel
2. The fact that this is a bearish retest on BTC HTF - not a bull market or bull pattern
3. There is a mass amount of liquidity held in open longs in Bitcoin - we need to see a severe deleveraging of these low zones to remain bullish
Happy trading - please see related linked ideas.
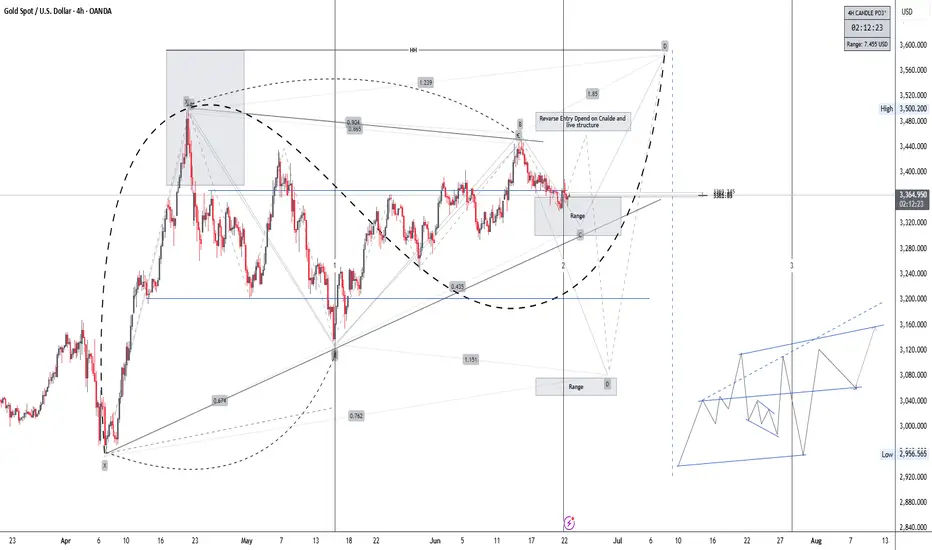
XAUUSD H4Gold is forming a bullish structure on the 4H chart. Price is consolidating at a key reversal zone (Point C). If we get bullish confirmation, I’m targeting:
$3,400 short-term
$3,500 next
$3,560+ final leg (Point P)
Support at $3,300 must hold—below that, I’ll re-evaluate.
Watching closely for a breakout and retest above the trendline before entering.
Not financial advice – just my view.
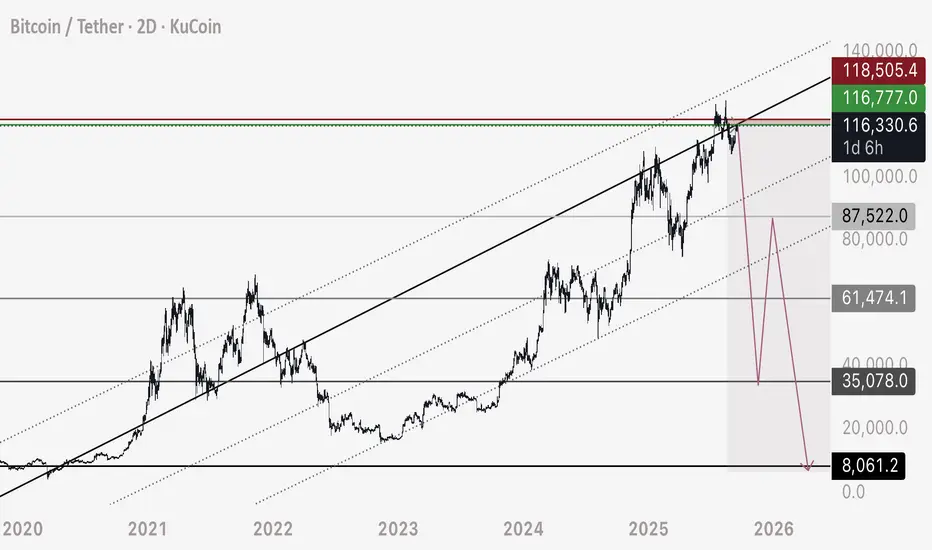
BTC Short Update - First Entry Point Hit Hi all, we have hit the first entry level on this trade idea again, and I will provide you with updated numbers.
First of all - to those asking “why” this would happen - please see my related idea on DXY as well as Blackrock.
For those asking “how” it’s possible, please see my tutorial on drawing heatmaps and understanding how bitcoin moves.
For those following my ideas, I explain order block analysis, my theory on how Bitcoin moves, and here we have a trading plan compiling it all together.
In theory, these drops should happen very quickly - as I explain the technicals of it in the order block tutorials.
Entry - 116,300 to 116,800
Stop Loss - (Can be lowered to 118,000)
Targets:
1) 90,000
2) 62,000
3) 38,000
After the third target we will likely rise to 86,000-88,000 area - however the short may be held all the way to 8,000.
88,000 is a major bearish trendline - I expect this will break, we will form a 3 wave corrective pattern and rise back up to retest this level.
4) 20,000 (Potential bottom 18,000)
5) 10,000
God speed and happy trading.
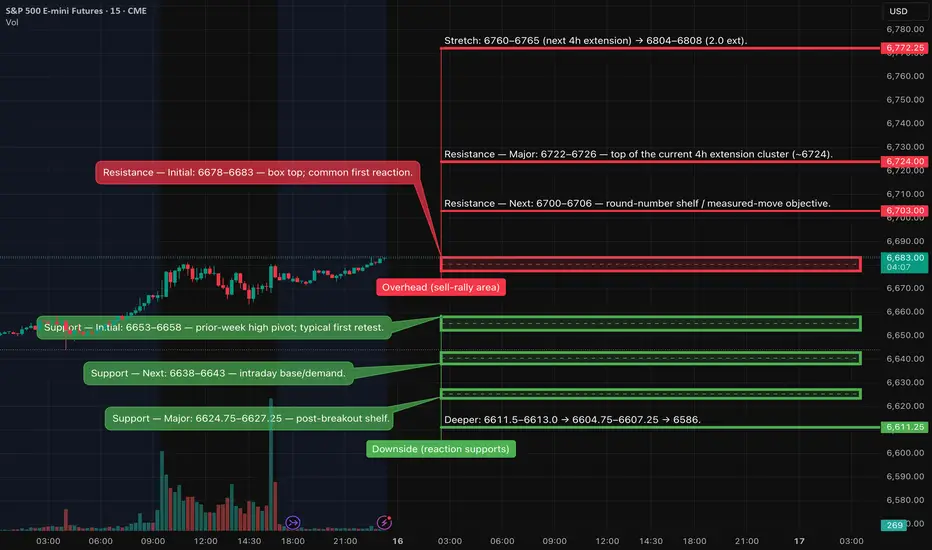
ES (SPX) - Analyses - Key zones - Trade Setups for Tue, Sep 16Bias: BUY DIPS into 6653–6643. Continuation long on 15m acceptance ≥ 6722–6726 with a 5m hold. Counter-trend short only on a clean 15m rejection at 6722–6726 (2.0R gate).
Why bullish bias (even with short fade allowed)
So, here’s why I’m leaning bullish (but I’m cool with a short fade now and then):
First off, when you check out the higher time frame (HTF), the trend is up. It’s usually a better bet to buy when prices dip rather than trying to call the top.
Then there's the risk situation: if we look at support around 6638–6643 and resistance levels at 6678/6700, we can set up for a nice 2R–3R trade with tight stops based on the 15-minute chart.
As for shorts, we’re going against the trend here. The only reason to short would be if we hit major resistance around 6722–6726. But if we don’t see a proper rejection, I’m not going to push it—I’ll just stick to going long.
Setups:
Long — Dip Buy (primary)
• Zone: 6653–6658 (Support-Initial) → 6638–6643 (Support-Next).
• Trigger: 15m reclaims support (body back above) → 5m re-close up with HL → 1m HL entry.
• SL: under the 15m trigger-low −0.25/−0.50.
• TPs: 6678–6683 → 6700–6706 (then trail only after TP2).
Tomorrow’s key U.S. events (ET)
• Retail Sales & Core Retail Sales — 8:30 (consumer pulse; can move index futures).
• Industrial Production & Capacity Utilization — 9:15.
• NAHB Housing Market Index — 10:00.
• Import/Export Price Indexes — 8:30.
• Treasury bill auctions (4- & 8-week; supply headline).
• FOMC (two-day) begins Tue; decision & SEP/dot plot Wed.
• Monthlies/OPEX: Fri Sep 19 (flows can affect tape later in week).
Long — Acceptance Continuation (secondary)
• Flip condition: 15m full-body ≥ 6722–6726 and 5m holds ≥ 6720–6722.
• Entry: 6721–6723 HL retest.
• SL: under the 15m trigger-low −0.25/−0.50.
• TPs: 6760–6765 → 6804–6808.
Short — Rejection Fade (counter-trend, extremes only)
• Zone: Resistance — Major 6722–6726 (or 6700–6706 if Major remains untagged).
• Trigger: 15m sweep & body back inside → 5m LH re-close → 1m fail/reclaim sell.
• SL: 15m sweep-high +0.50.
• TPs: 6678–6683 → 6653–6658 → 6638–6643.
My thoughts On EURUSDIve taken a long on Friday, took partials off and set SL to breakeven. I expect price to continue its upward trend for next week.

One Push Away From Lift-Off, BB Breakout Setup$BB/USDT is right at a crucial confluence zone where the downtrend resistance and horizontal supply overlap. Buyers have been pushing price higher, but this area is acting as a real test.
If BB manages to break and close above this zone with strength, it could fuel a strong rally as momentum shifts in favor of the bulls. On the other hand, failure to clear this resistance might lead to another rejection, keeping price stuck in the range.
In simple words: this is the make-or-break moment, watch closely for a breakout confirmation before calling the next big move.

BTC - Crash Path PossibilitiesI expect Bitcoin to crash hard today, and here is a zoomed in look at my potential pathways.
NOTE - See linked related idea on DXY to make sense of this more
Beginning with most likely in my own opinion, to least likely:
Option 1:
114,200 to 35,000 - Short
35,000 to 85,000-86,000 - Long
85,000 to 8,000 - Short
8,000 - Long Entry
Option 2:
114,000-115,000 to 18,000-19,500 - Short
20,000 - Long Entry
Option 3:
114,200 to 43,000 - Short
43,000 to 77,000 - Long
77,000 to 8,000 - Short
8,000 - Long Entry
Strategy:
- Regardless of option I am short Bitcoin
- I will watch for a sudden crash initiate today
- I will first watch for a hold and bounce at 35,000 - closing 75% of my short at 45,000 (I expect wick to be very fast and hard to trade exact numbers)
- If we see a bounce at 35,000 - I will open a hedge long at that level
- Repeat first four steps if we drop below 30,000, looking for the correct bottom and closing short accordingly
- Safest option is low leverage short and spot buys at the bottom levels
Thanks to those who have been following me and supporting my ideas. I know I’m the only one speaking about this.
Happy trading.
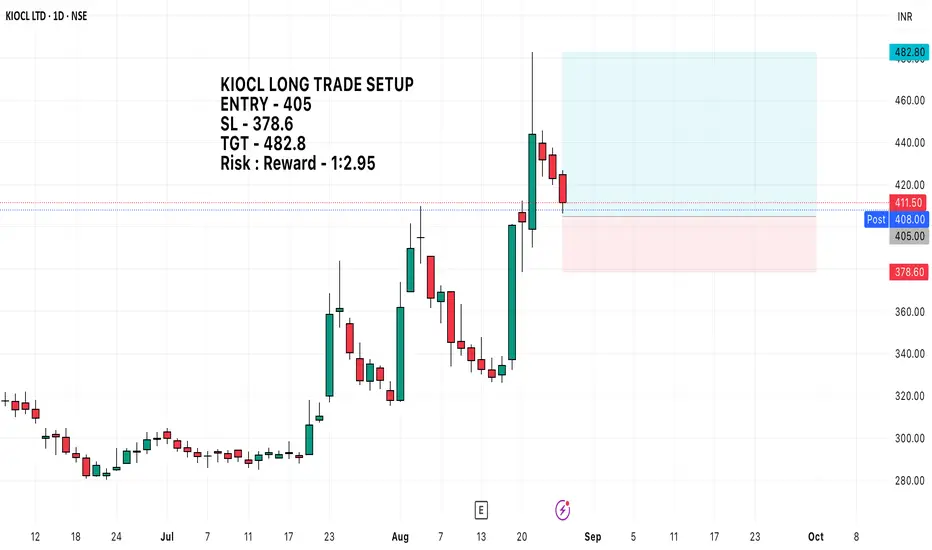
KIOCL Long setupKIOCL LONG TRADE SETUP
ENTRY - 405
SL - 378.6 (Max SL stretch to 375)
TGT - 482.8
Risk : Reward - 1:2.95
BTC - Short Plan Update / Reminder Anyone who didn’t take this trade at top entry may enter at the lower level here.
Entry - 110,500-111,000
Stop Loss - 113,000 (High Risk) to 120,000 (Low Risk)
Targets:
1) 81,000
2) 61,000
3) 36,000
4) 9,000
Personally I will time any crypto related trades with this pathway. Everything will drop and rise with bitcoins movement.
Happy trading.
Disclaimer - this is not financial advice and outlines my personal trade plan only

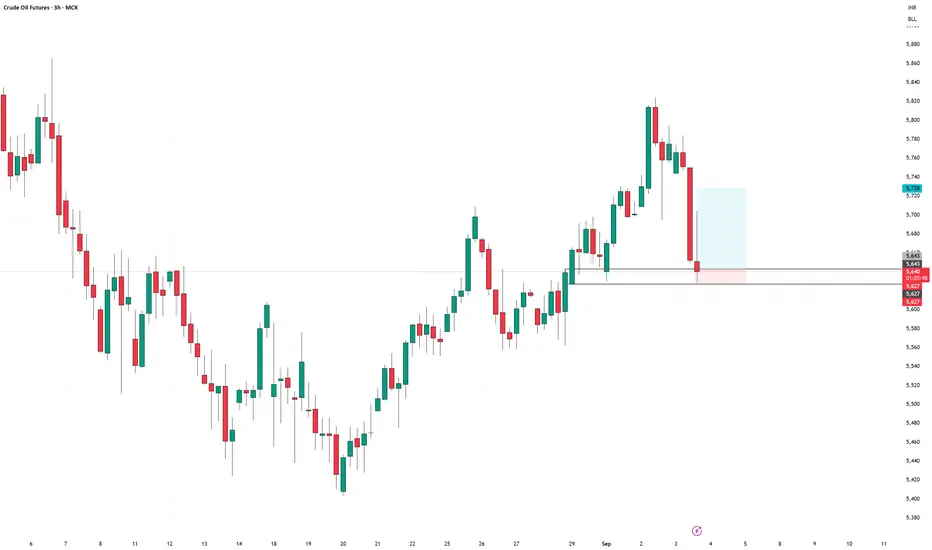
CRUDEOIL September Futures long setupCRUDEOIL September Futures long setup
Entry - 5643
Stop Loss - 5627
Target - 5728
Risk Reward - 1:5.3
BTC Breakdown Alert: Bears Eye $106K Next!
🔥 **BTC Bears Ready to Attack? 🚨 Target \$106K Incoming!** 🔥
📊 **Market Bias**
⏳ **Intraday → 4H**: 🟥 Bearish (⬇️ below EMA9/21/20SMA, 📉 MACD negative, 💥 sell volume)
📅 **Daily → Weekly**: ✅ Mixed-to-Bullish (📈 above 200 SMA ≈ 101.3k)
⚖️ → Tactical short only, ⚠️ size carefully.
🎯 **Trade Plan**
💰 Entry: **109,200**
🛑 Stop Loss: **110,800**
🎯 Take Profit: **102,400** (⚡ 50% at 105,900 / 50% at 102,400)
📏 Size: **1 BTC** (risk \~1%)
💪 Confidence: **60%**
⏰ Timing: **Market Open**
🧠 **Why Short?**
* 📉 EMAs/SMA bearish stack
* 🔻 Expanding negative MACD
* 🧊 Heavier sell volume
* 🎯 BB extension aligns w/ \~102.4k
⚠️ **Risks**
* ❓ Missing OI/liquidity data = squeeze risk
* 📈 Long-term bullish structure > 200 SMA
* 🌍 Macro shocks (ETF/reg headlines, DXY swings)
---
📊 **TRADE JSON (automation/record):**
```json
{
"instrument": "BTC",
"direction": "short",
"entry_price": 109200.00,
"stop_loss": 110800.00,
"take_profit": 106000.00,
"size": 1.0,
"confidence": 0.60,
"entry_timing": "market_open",
"signal_publish_time": "2025-09-01 17:02:46"
}
```
---
🏷️ **Hashtags:**
\#BTC 🚀 #Bitcoin 💎 #CryptoTrading 📊 #TradeSetup 🐻 #ShortTrade ⚡ #DayTrading ⏳ #RiskManagement 🛡️ #SwingTrade 🎯

Indecision and Potential StallingHi Traders!
GBPUSD is telling me indecision right now. When mapping out my trading plan I'm seeing price recently made a higher low on the weekly, dipped into a Daily Order Block, and currently testing the 1.36000 neckline. However, unless GBPUSD closes above 1.35200, retests with continuation, this looks like consolidation. Alerts set, and waiting for some more confirmation right now.
Key levels:
Bullish breakout- Close above 1.35200.
Bearish caution- Break below 1.34600/1.34500.
*DISCLAIMER: I am not a financial advisor. The ideas and trades I take on my page are for educational and entertainment purposes only. I'm just showing you guys how I trade. Remember, trading of any kind involves risk. Your investments are solely your responsibility and not mine.*

BTC - Short Trade Update - Expected PathI’m sending an update to this short idea because as we progress we can start narrowing down which pathway is the most likely.
I expect this move to occur very quickly, and I hope that afterwards we understand why it’s important to be preemptive with predicting the potential movements and corrective patterns.
My most likely / personal trade:
110,000 to 34,700-35,000
35,000 to 81,000
81,000 to 8,000
My Strategy:
I will be closing 50-75% of my short at 45,000 to 40,000
I will watch for a rise from that 35,000 level to confirm the swing long - and if I see intention for that to play out (we could also go straight to 8,000) - I will open a hedge long position and add to it accordingly
I know many of you think I’m crazy or a troll - but my confidence is very high we will see this occur.

Waiting for the 1.3490 AreaJust a simple trade alert set at 1.3490. If price arrives back at this level I might start with a scalp to the downside targeting roughly 15-20 pips

ETH - High Risk ShortPer my BTC analysis, I expect the market to crash very hard and quickly, timed with the US dollar bearish retest on major weekly breakdown.
Entry in green, targets marked and path shown.
ETH fell below this major series of bearish trendlines, targets marked by analyzing liquidity and volume profile levels.

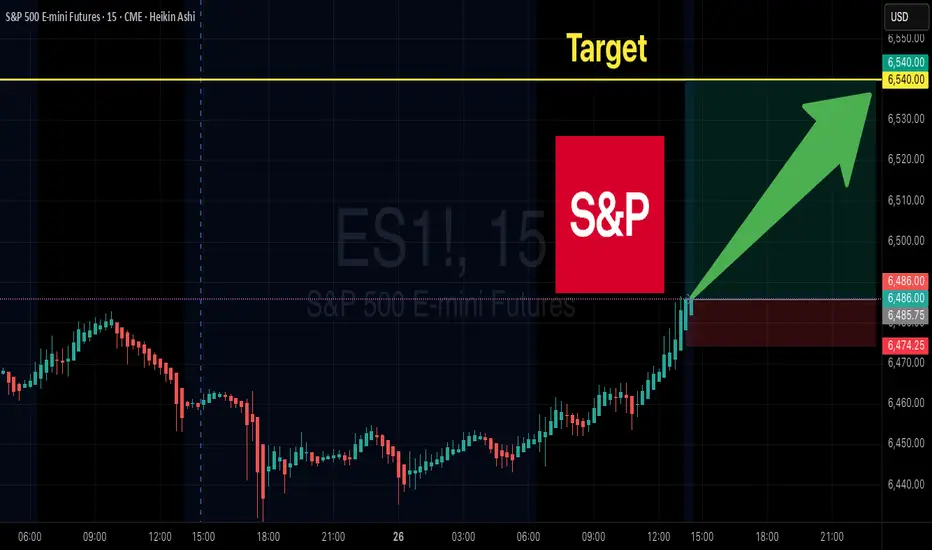
ES Futures LONG Setup | 6462 → 6556
# 🚀 ES Futures LONG Setup | 6462 → 6556 🎯 (1:2 R\:R)
### 📝 Market Bias
* **Conditional Bullish** into US open.
* Higher-timeframe trend strong (price > 10/20/50/200 SMAs).
* **BUT** intraday momentum still mixed (MACD bearish) + thin overnight liquidity.
👉 **Trade ONLY if liquidity & momentum confirm at open.**
---
### 🎯 Trade Idea
**Setup:** Conditional LONG (market open only)
* 📍 **Entry:** 6462.25 (acceptable range 6455 – 6475)
* 🛑 **Stop Loss:** 6415.15 (0.75 × ATR = 47.10 pts)
* 💰 **Take Profit:** 6556.45 (2 × stop = 94.20 pts)
* ⚖️ **Risk/Reward:** 1 : 2
* 💪 **Confidence:** 60%
**Risk/Reward per Contract:**
* ❌ Risk = \$2,355
* ✅ Reward = \$4,710
---
### 📊 Position Sizing
* Formula: `contracts = floor((account_size × risk%) / (stop_pts × $50))`
* Example:
* \$100k acct @ 2% risk → 0 contracts (use micro/mini).
* \$200k acct → 1 contract.
* \$250k acct → 2 contracts.
---
### 📈 Scale & Exits
* Take **50% profit @ 6509.35** (1× stop).
* Hold rest to **6556.45 TP**.
* Move stop to breakeven after scaling.
---
### ⚠️ Key Risks
* Very thin overnight liquidity → slippage risk.
* MACD still bearish; must improve at open.
* Price near 20-day highs → upside limited.
* Event/headline risk at open.
---
### ✅ Pre-Conditions (MUST at Open)
* Strong liquidity/volume vs overnight.
* Price holds above SMA10 & SMA20.
* Preferable: MACD histogram improves in 15–30 mins.
❌ If conditions fail → NO TRADE.
---
### 📌 Trade JSON (For Algo/Notes)
```json
{
"instrument": "ES",
"direction": "long",
"entry_price": 6462.25,
"stop_loss": 6415.15,
"take_profit": 6556.45,
"size": 1,
"confidence": 0.60,
"entry_timing": "market_open",
"point_value": 50,
"signal_publish_time": "2025-08-25 15:47:27"
}
```
---
### 🔖 Hashtags
\#ES #SP500 #FuturesTrading #OptionsTrading #SwingTrade #DayTrading #TradeSetup #MarketOpen #RiskReward #PriceAction #TechnicalAnalysis #SmartMoney #StockMarket #TradingSignals #ScalpSetup
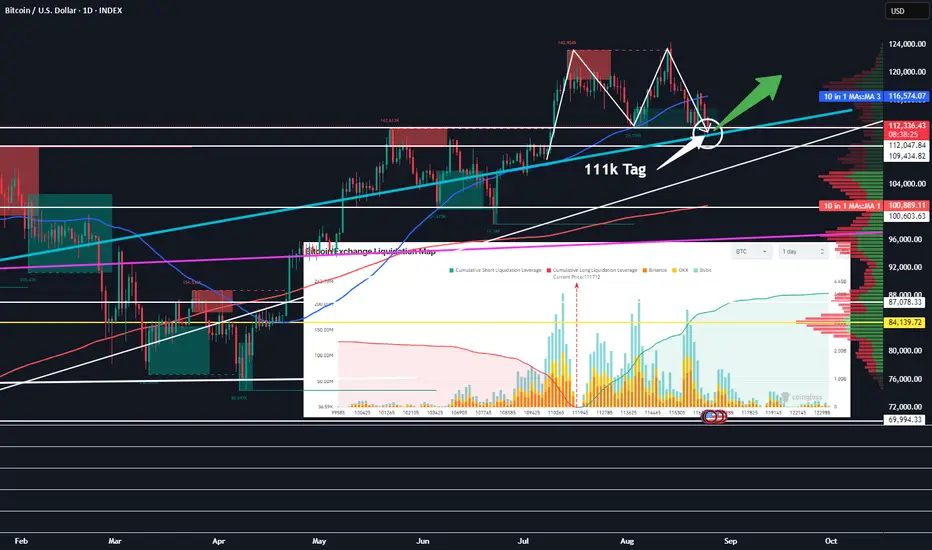
Bitcoin Technically Perfect With 111k Tag!Good Morning Traders,
I have been expecting a retest of our 111k support for some time now. Yesterday and today, we have tagged this support with our daily candle wicks. I expect our 111k support to hold strong. It represents strong support and the completion of an "M Pattern". Though we could wick down quickly to 109k to free up another 100 million+ in leveraged longs, this move would likely be very quick, and I am not certain the market makers and manipulators would even deem it a worthwhile endeavor. However, just to be certain, if you are going long here, I would certainly place any stops somewhere below 109k pending risk tolerance. By the end of this week, I am expecting Bitcoin to start moving up again.
✌️Stew
BTC - Short Trade Plan Updated details for this BTC short below, with a lower entry than first plan.
DISCLAIMER - This is my personal trade only and I’m not advising you what to do with your money. Trading is risky and please use your own discretion and risk practices.
Fundamental analysis of this trade can be found on my prior posts.
Entry Range - 116,700 to 117,000
Stop Loss - 120,000
Target 1 - 88,000
Target 2 - 61,500
Target 3 - 35,000
Target 4 - 8,000
God speed. Let the dump begin.

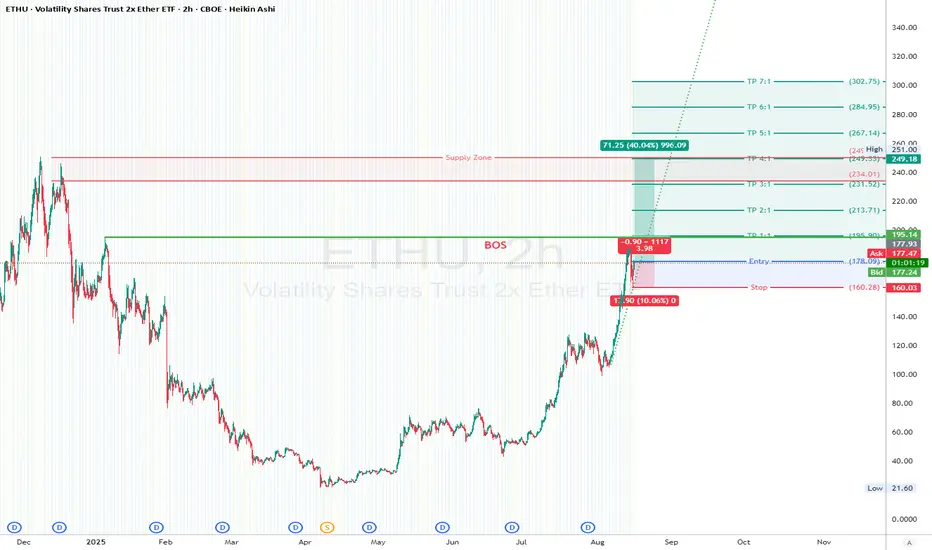
ETHU (2X Ethereum ETF)Targeting the end of the wave after a short correction.
Trade setup on the chart
Entry: 177.93
SL: 160.03
TP: 249.18 (4:1RR)
Trade safe!
Is this where GJ starts making its big move?Hi Traders,
After breaking out of a failed swing tapping 200.000, GJ came down to retest the failed swing area at 199.000, bounced and reversed. Around 199.500 could be another retest/entry area before continuation. The weekly looks really good IMO, so I am planning to swing trade. My first target would be around 201.500, and then 203.000. 203.000 would hit an area of a weekly bearish OB.
*DISCLAIMER: I am not a financial advisor. The ideas and trades I take on my page are for educational and entertainment purposes only. I'm just showing you guys how I trade. Remember, trading of any kind involves risk. Your investments are solely your responsibility and not mine.*

BTC - Potential Crash Update As complicated as this has been, I still suspect this massive crash on BTC to occur.
My suspicion is this this move up isn’t a true bull market, but a bearish retest. DXY breaking down a major multi month bearish pattern shows a bull run beginning now and spanning our 5 years on BTC and equities.
I suspect BTC to continue abruptly dropping per my plan here, as laid out in previous posts.
Happy trading.
