GOLD Will Move Lower! Short!
Take a look at our analysis for GOLD.
Time Frame: 9h
Current Trend: Bearish
Sentiment: Overbought (based on 7-period RSI)
Forecast: Bearish
The price is testing a key resistance 4,509.32.
Taking into consideration the current market trend & overbought RSI, chances will be high to see a bearish movement to the downside at least to 4,385.85 level.
P.S
Overbought describes a period of time where there has been a significant and consistent upward move in price over a period of time without much pullback.
Like and subscribe and comment my ideas if you enjoy them!
Trading

EURAUD Is Going Down! Short!
Take a look at our analysis for EURAUD.
Time Frame: 4h
Current Trend: Bearish
Sentiment: Overbought (based on 7-period RSI)
Forecast: Bearish
The market is approaching a key horizontal level 1.741.
Considering the today's price action, probabilities will be high to see a movement to 1.729.
P.S
We determine oversold/overbought condition with RSI indicator.
When it drops below 30 - the market is considered to be oversold.
When it bounces above 70 - the market is considered to be overbought.
Like and subscribe and comment my ideas if you enjoy them!

Scaling a small account is not a strategy problem It is a sequencing and behavior problem. Most traders assume that growth comes from new methods or more trades. The data shows that small accounts grow fastest when they remove the hidden tax that drains them: emotional sizing, poor invalidation placement, and trading inside volatility expansion instead of liquidity alignment.
The most common failure point is position size volatility. When volatility expands, candle ranges widen, liquidity thins, and invalidation distance increases. This is the worst moment to increase size, yet this is when most traders do it—after a streak of wins or boredom-induced impulsive entries. A small account does not fail because the market moved against it. It fails because it increased exposure when the market removed fuel.
Professionals scale differently. They anchor size when volatility expands and only scale when volatility compresses, liquidity is swept cleanly, and structure transitions. This shift protects capital durability first so compounding becomes mathematically possible second.
The framework begins with a volatility budget. Every asset has a typical invalidation distance on each timeframe. BTCUSDT and SOLUSDT behave with wider ranges than mid-cap pairs, and their liquidity pockets are tested more aggressively during overlap sessions. Your account must size exposure based on what the market historically allows a setup to absorb without forcing premature liquidation.
Liquidity mapping is the next step. Equal highs, equal lows, and inefficient consolidation clusters are not entry signals. They are incentives. Price moves there to transact, collect stops, and reposition larger capital. The first proof of intention is the sweep. Price breaches liquidity and reclaims back inside the swing. This tells you that breakout traders provided the orders, not continuation. A small account compounds faster when it waits for the sweep to finish rather than entering into it.
From there, structure must transition. In an uptrend, the market protects higher lows. In a downtrend, it protects lower highs. When price violates the last defended point after liquidity is taken, you have a control handover. This is not a guess. It is a behavioral change in price organization. But structure alone is still incomplete. It requires displacement.
Displacement is momentum proving participation. A structural break followed by thin, drifting candles is not authority. A structural break followed by clean directional movement is participation. This shows urgency from the opposing side. This is where narratives change and capital begins positioning for the next impulse.
The retest becomes the execution filter. Price returns to the broken or swept zone, interacts without hesitation, and respects the new bias built from liquidity and structure. The retest reduces invalidation distance, tightens risk, and improves reward asymmetry naturally without needing to increase leverage or complexity. The best retest is not the fastest one. It is the one that proved permission through sequence.
Micro-scaling compounds edge without compounding risk. Extracting 1–3% per trade on confirmed retests with 2.5:1 or better R:R compounds a small account more efficiently than trying to extract 10% during unconfirmed expansion phases. High-quality trades reduce mistake frequency, which matters more than win rate when capital is small and feedback is fast.
Time is also a filter. Crypto liquidity behaves differently by session. The most stable participation for BTC and SOL historically occurs during London–NY overlap, where bid depth is higher, sweeps are cleaner, and structural transitions show more authority. Dead-zone hours widen noise and compress clarity. Scaling requires knowing when participation is probable, not forcing participation when it is absent.
The final rule is process-first validation. A trade that works without a reason is not scale permission. A trade that works because it followed the sequence is. The market does not reward perfection. It rewards traders who stay calibrated to structure, volatility, and liquidity long enough to compound the value of participation when conditions finally agree.
Scaling is not about catching the entire move.
It is about surviving long enough to participate in the right side of the next move with defined risk and conditional exposure. Small accounts grow when traders stop scaling emotion and start scaling conditions.

XAUUSD – Pullback Only, Trend Not Broken YetGold is not reversing — this is a controlled pullback inside a broader bullish structure.
Price has rejected the upper zone and is now retracing to rebalance liquidity. As long as the key demand below holds, the bullish bias remains intact.
Key Technical View
Market is still respecting the rising structure.
Current drop is corrective, not a confirmed bearish CHoCH.
Strong demand cluster below aligns with trendline + prior imbalance → high reaction area.
Primary Plan – Trend BUY
Focus on BUY opportunities at discounted zones.
Wait for price reaction and structure confirmation — no chasing candles.
Upside Targets
TP1: 4,449
TP2: 4,477
TP3: 4,494
Risk Note
If price fails to hold the demand zone, step aside and reassess — patience > prediction.
➡️ Bias stays bullish until structure says otherwise.

Exit Strategies: Entries Get Attention, Exits Make the MoneyEveryone Obsesses Over Entries. Professionals Obsess Over Exits.
Here's a trading truth that took me years to learn:
You can have a mediocre entry and still make money with a great exit.
You can have a perfect entry and lose money with a poor exit.
Exits determine your actual profit or loss. Entries just get you in the game.
Why Exits Matter More
The Entry Illusion:
Traders spend 90% of their time on entries:
Finding the perfect setup
Waiting for confirmation
Timing the exact moment
The Exit Reality:
But exits determine:
Whether a winning trade stays winning
How much you actually capture
Whether a losing trade stays small
Your overall expectancy
The Math:
A 60% win rate with poor exits can lose money.
A 40% win rate with excellent exits can make money.
It's not about being right. It's about how much you make when right and how little you lose when wrong.
Types of Exits
1. Stop Loss Exit
Predetermined price where you exit to limit loss.
Purpose: Capital preservation
Placement: Where your trade thesis is invalidated
2. Take Profit Exit
Predetermined price where you exit to capture profit.
Purpose: Lock in gains
Placement: At logical targets (resistance, measured moves)
3. Trailing Stop Exit
Stop that moves with price to lock in profits.
Purpose: Let winners run while protecting gains
Types: Fixed distance, ATR-based, percentage-based
4. Time-Based Exit
Exit after a certain time regardless of price.
Purpose: Avoid dead money, force decisions
Example: Exit if trade hasn't moved in 5 days
5. Indicator-Based Exit
Exit when indicator gives signal.
Purpose: Systematic exit based on market conditions
Example: Exit when RSI crosses below 70
6. Discretionary Exit
Exit based on judgment and market conditions.
Purpose: Adapt to changing conditions
Risk: Emotional interference
Stop Loss Strategies
Strategy 1: Technical Stop
Place stop where the trade idea is invalidated.
Examples:
Below support level
Below swing low
Below trendline
Advantage: Logical placement based on market structure
Disadvantage: Can be obvious to other traders
Strategy 2: ATR-Based Stop
Place stop at multiple of Average True Range.
Formula:
Stop = Entry - (ATR × Multiplier)
Example:
Entry: $100
ATR: $2
Multiplier: 2
Stop: $100 - ($2 × 2) = $96
Advantage: Adapts to volatility
Disadvantage: May not align with structure
Strategy 3: Percentage Stop
Place stop at fixed percentage from entry.
Example:
Entry: $100
Stop: 5% below = $95
Advantage: Simple, consistent
Disadvantage: Ignores market structure and volatility
Strategy 4: Time Stop
Exit if trade doesn't move within timeframe.
Example:
"If not profitable within 3 days, exit at market."
Advantage: Avoids dead money
Disadvantage: May exit before move happens
Take Profit Strategies
Strategy 1: Fixed Target
Predetermined price target.
Methods:
Risk multiple (2R, 3R)
Resistance level
Round number
Advantage: Clear, removes emotion
Disadvantage: May leave money on table
Strategy 2: Scaled Exit
Exit in portions at different levels.
Example:
1/3 at 1R
1/3 at 2R
1/3 trailing
Advantage: Locks in some profit, lets rest run
Disadvantage: More complex management
Strategy 3: Trailing Stop
Let profits run with moving stop.
Types:
Fixed distance trailing
ATR trailing
Moving average trailing
Swing point trailing
Advantage: Captures extended moves
Disadvantage: Gives back some profit on reversals
Strategy 4: Indicator Exit
Exit when indicator signals.
Examples:
RSI overbought
MACD crossover
Moving average cross
Advantage: Systematic, removes emotion
Disadvantage: May lag price action
AI-Enhanced Exit Strategies
1. Dynamic Stop Optimization
AI adjusts stops based on:
Current volatility
Time in trade
Profit accumulated
Market regime
2. Optimal Target Calculation
AI analyzes:
Historical move distributions
Current momentum
Resistance levels
Probability of reaching targets
3. Exit Signal Ensemble
AI combines multiple exit signals:
Technical indicators
Price action
Volume patterns
Time factors
4. Regime-Adaptive Exits
AI adjusts exit strategy based on market regime:
Trending: Wider trailing stops
Ranging: Tighter fixed targets
Volatile: Faster exits
Exit Mistakes
Moving Stop Loss Away — "I'll give it more room" = hoping, not trading. Set stop before entry, never move it further away.
Taking Profits Too Early — Fear of giving back gains leads to cutting winners short. Use trailing stops to let winners run.
No Exit Plan — Entering without knowing where you'll exit. Define all exits BEFORE entering.
Emotional Exits — Exiting based on fear or greed, not plan. Automate exits or use strict rules.
Same Exit for All Trades — Using identical exit regardless of setup or conditions. Match exit strategy to trade type and market conditions.
Exit Planning Framework
Before Every Trade, Define:
1. Initial Stop Loss
Where is the trade idea wrong?
What's the maximum acceptable loss?
2. Primary Target
Where is the logical profit target?
What's the risk:reward ratio?
3. Trailing Strategy
How will you protect profits?
When does trailing begin?
4. Time Limit
How long will you hold?
When do you exit regardless of price?
5. Invalidation Conditions
What would change your thesis?
When do you exit early?
Exit Scenarios
Scenario 1: Trade Goes Your Way
Move stop to breakeven after 1R
Trail stop as price advances
Take partial profits at targets
Let remainder run with trail
Scenario 2: Trade Goes Against You
Stop loss hits = exit immediately
No hoping, no averaging down
Accept the loss, move on
Scenario 3: Trade Goes Nowhere
Time stop triggers
Exit to free up capital
Reassess if setup is still valid
Scenario 4: Conditions Change
Original thesis no longer valid
Exit regardless of profit/loss
Don't hold for wrong reasons
Key Takeaways
Exits determine actual profit/loss — entries just get you in the game
Define all exits BEFORE entering any trade
Never move stop loss further away — only closer
Use trailing stops to let winners run while protecting gains
Match exit strategy to trade type and market conditions
Your Turn
What's your biggest challenge with exits?
Do you tend to exit too early or hold too long?
Share your exit strategies below 👇

XAUUSD H3 – Liquidity in Control Near ATH
Gold is trading in a sensitive zone just below all-time highs, where liquidity, Fibonacci extensions, and trend structure are converging. Price action suggests a controlled rotation rather than a clean breakout, with clear reaction levels on both sides.
TECHNICAL STRUCTURE (H3)
Gold remains in a broader bullish structure, with higher lows supported by an ascending trendline.
The recent impulse confirmed bullish intent, but price is now stalling near premium liquidity, signalling potential short-term distribution.
Market behaviour shows buy-the-dip dynamics, while upside extensions are being tested selectively.
KEY LEVELS FROM THE CHART
Upper liquidity / extension zone:
Fibonacci 2.618 extension near the top band
This area represents profit-taking and sell-side liquidity, especially if price reaches it with weak momentum.
Sell reaction zone:
4412 – 4415 (Fibonacci 1.618 + prior ATH reaction)
A classic area for short-term rejection if price fails to break and hold above.
Buy-side focus:
4480
This level acts as a buy-on-pullback zone, aligned with trendline support and prior bullish structure.
Expected flow:
Price holds above 4480 → attempts to push toward ATH → potential extension into the 2.618 zone.
Failure to hold 4480 → rotation back toward lower structure for liquidity rebalance.
MARKET BEHAVIOUR & LIQUIDITY LOGIC
Current structure favours reaction-based trading, not chasing breakouts.
Liquidity above ATH is attractive, but the market may need multiple attempts or a deeper pullback before a sustained breakout.
As long as higher lows are respected, pullbacks remain corrective.
MACRO CONTEXT – DXY BACK ABOVE 99
The US Dollar Index (DXY) has climbed above 99 for the first time since December 10, gaining 0.14% on the day.
A firmer USD can slow gold’s upside momentum in the short term.
However, gold’s ability to hold structure despite a stronger dollar highlights underlying demand and strong positioning.
This divergence suggests gold is not purely trading off USD weakness, but also off liquidity, positioning, and risk hedging flows.
SUMMARY VIEW
Gold remains structurally bullish on H3
Short-term price action is driven by liquidity near ATH
4480 is the key level defining bullish continuation
Upside extensions may require consolidation or pullbacks before a clean break
In this environment, patience and level-based execution matter more than directional bias.

A retest framework is a processMost traders know support and resistance, but few have a rule set for when those levels become tradable. In crypto, levels are breached constantly. What matters is not the breach. What matters is what the market accomplishes by breaching it and how it behaves once it returns.
The framework starts by defining a clear swing high and swing low. These are the most recent meaningful extremes where price demonstrably changed direction, not intraday noise. The midpoint between them becomes equilibrium, your objective reference for premium versus discount within that swing. This midpoint is not predictive. It simply organizes the playing field.
Next comes liquidity. Equal highs, equal lows, and inefficient consolidation clusters are not decorations on the chart. They are incentives. Stops pool there. Traders position emotionally there. The market goes there to transact. When price moves into that pocket and leaves a wick that is quickly reclaimed, you have the sweep. This is the first proof that the breakout traders were the liquidity, not the beneficiaries.
A sweep alone is not structure. So the next requirement is transition. In an uptrend, buyers defend higher lows. When the last defended low is violated after a sweep, you get the break of micro-structure. In a downtrend, sellers defend lower highs. When the last supplied high is reclaimed after liquidity is taken below, you have transition in reverse. This is where narrative changes from continuation to rotation.
Then comes displacement. This is the market proving participation through momentum. A structural transition followed by compressed candle ranges or low-volume drift lacks authority. But a transition followed by clean directional movement shows that the opposing side stepped in with urgency. This is not retail FOMO. This is participation.
The retest becomes the execution filter. Price returns to the broken zone or swept liquidity level. It interacts there without hesitation, without sweeping back through the same side, and without expanding candle ranges against the narrative you built. This is where professionals position. Not because it is perfect timing, but because it is permissioned timing. The stop goes beyond the narrative fracture point, not a generic percent. The target goes toward the next liquidity incentive in line, not a vague R:R fantasy.
This sequencing matters even more inside funded evaluations. Prop traders fail most often when they cluster mistakes. A retest framework reduces mistake clustering because it forces the trade to form a story before it forms exposure. It narrows invalidation distance, improves average R:R, and protects daily drawdown math naturally. It also gives you neutrality after streaks. The framework does not amplify confidence.
It anchors confidence to conditions.
The retest framework does not promise that a trade works. It promises that a trade has a reason to work. And having reasons before exposure is the edge that compounds careers in crypto, especially when liquidity and volatility drain fast.

EUR-USD Local Long! Buy!
Hello,Traders!
EURUSD sweeps sell-side liquidity into a clean horizontal demand zone after a sustained bearish move. Smart money mitigation is visible, with price likely to stabilize and deliver a corrective bullish reaction toward internal liquidity. Time Frame 4H.
Buy!
Comment and subscribe to help us grow!
Check out other forecasts below too!
Disclosure: I am part of Trade Nation's Influencer program and receive a monthly fee for using their TradingView charts in my analysis.

S&P 500 Daily Chart Analysis For Week of Jan 9, 2026Technical Analysis and Outlook:
During the inaugural trading session of the New Year, the S&P 500 Index is demonstrating a pronounced bullish sentiment. The Index has successfully breached the critical Key Resistance level at 6,932 and has also retested the completed Outer Index Rally at 6,945. It is anticipated that the Index will continue its upward trajectory toward the subsequent target of Outer Index Rally 7,026.
Nonetheless, it is crucial to acknowledge that, given prevailing market conditions, there is a significant likelihood of steady to lower pullbacks before the Index successfully achieves the Outer Index Rally target of 7,026. However, the market participants need to be aware that this event will trigger a price action in Force Retracement to the attainable Mean Support level of 6,922.

Gold Trapped Between Supply & Demand Price is approaching a strong supply zone around 4,500–4,520, where selling pressure has previously entered the market aggressively. The recent upside move shows signs of momentum loss, suggesting this rally may be corrective rather than impulsive.
A clear rejection from the supply zone would favor a pullback toward the 4,450–4,440 area, with further downside continuation likely into the 4,420 demand zone, where buyers previously stepped in.
If the 4,420 demand fails to hold, bearish continuation could extend toward 4,380–4,360. Only a strong breakout and close above the supply zone would invalidate the bearish pullback scenario and shift the bias back to bullish expansion.

XAUUSD (H1) – Riding the bullish channelpatience before continuation ✨
Market structure
Gold remains in a well-defined ascending channel on the H1 timeframe. Despite recent intraday pullbacks, the overall structure is still bullish with higher highs and higher lows preserved. Current price action shows consolidation inside the channel rather than any sign of trend reversal.
Technical outlook (Lana’s view)
Price is rotating around the midline of the rising channel, indicating healthy digestion after the previous impulsive leg.
The recent pullback appears to be a controlled correction, likely aimed at collecting buy-side liquidity before the next expansion.
Market is still respecting structure and trendline support — no breakdown confirmed so far.
Key levels to watch
Buy-side focus
FVG Buy zone: 4434 – 4437
A clean reaction here could offer a good continuation entry within the trend.
Major buy zone: 4400 – 4404
This is the stronger demand area aligned with channel support and previous structure.
Sell-side reaction (short-term only)
4512 – 4515
This zone aligns with Fibonacci extension and channel resistance, where short-term profit-taking or reactions may appear.
Scenario outlook
As long as price holds above the lower channel boundary, bullish continuation remains the primary scenario.
A pullback into FVG or the lower buy zone followed by confirmation would favor another push toward channel highs and liquidity above.
Only a clean break and acceptance below 4400 would force a reassessment of the bullish bias.
Lana’s trading mindset 💛
No chasing price near resistance.
Let price come back into value zones inside the channel.
Trade reactions, not predictions.
Trend is your friend — until structure says otherwise.
This analysis reflects a personal technical perspective for educational purposes only. Always manage risk carefully.

EUR/USD SENDS CLEAR BULLISH SIGNALS|LONG
Hello, Friends!
EUR/USD is making a bearish pullback on the 4H TF and is nearing the support line below while we are generally bullish biased on the pair due to our previous 1W candle analysis, thus making a trend-following long a good option for us with the target being the 1.167 level.
Disclosure: I am part of Trade Nation's Influencer program and receive a monthly fee for using their TradingView charts in my analysis.
✅LIKE AND COMMENT MY IDEAS✅

Gold Testing a Key EMA, the Pullback Remains TechnicalOn the OANDA:XAUUSD H1 chart, gold is entering a short-term corrective phase following the previous strong rally. The key point to emphasize is that the bullish structure remains intact, and current price action is mainly about how the market reacts around the major EMA levels.
From a technical perspective, price is hovering around the EMA 89, corresponding to the 4,435–4,440 zone. Meanwhile, the EMA 34 sits higher near 4,455 and has temporarily turned into a short-term dynamic resistance. Price failing to hold the faster EMA and pulling back toward the slower one is a familiar scenario within a healthy uptrend, where larger players closely observe price reactions to assess whether the trend continues to be defended.
The constructive sign so far is that gold has not printed a clear H1 close below the EMA 89 . The corrective candles remain relatively small and show lower wicks, suggesting that selling pressure is still limited. Although volume has ticked up slightly during some of the pullback legs, there is no evidence of aggressive distribution or heavy unloading.
Overall, this decline is better interpreted as a pullback toward a balance zone after price had extended significantly away from the EMAs during the prior advance. Given gold’s volatility characteristics, such corrections often serve to relieve pressure and rebuild a base before the market decides on its next directional move.

Ethereum Breaks Descending Structure — Is a Fresh Bullish Leg UnEthereum (ETHUSD) on the H1 timeframe is showing a notable shift in short-term structure after breaking cleanly above a well-defined descending trendline. This trendline had capped price throughout the recent corrective phase, so the breakout signals that bearish momentum is fading and buyers are beginning to regain control.
The prior move down now appears corrective within a broader bullish context rather than the start of a trend reversal. Price has formed a higher low after the breakout and is stabilizing above the 3,080–3,100 support zone, confirming this area as a key demand base and structural pivot.
With the trendline broken, the market is transitioning from sell-the-rally behavior into a potential buy-the-dip environment, provided price continues to hold above the breakout area.
Overhead, ETH faces a sequence of clear resistance levels that will define the strength of any continuation:
- 3,180 – first reaction and intraday structure resistance
- 3,260 – prior consolidation high and liquidity magnet
- 3,300–3,320 – major resistance and key upside objective
Bullish: As long as price holds above 3,080–3,100 and respects the broken trendline, continuation toward 3,180, then 3,260, becomes likely. Acceptance above these levels opens the path toward 3,300+.
Bearish: A failure to hold above the breakout zone and a sustained move back below 3,080 would invalidate the bullish shift and suggest a return to range or deeper correction.
At this stage, Ethereum is at a post-breakout validation phase. Patience is key the highest-probability opportunities come from holding above the broken trendline or clean continuation through resistance, not from chasing price mid-structure.

Bitcoin(BTC/USD) Daily Chart Analysis For Week of Jan 9, 2026Technical Analysis and Outlook:
This week's trading activity in the Bitcoin market has focused on completing the Interim Inner Coin Rally at a target price of 98,000. However, the market pivoted from the Mean Resistance level at 93,500, validating its strength by establishing a new Mean Resistance level at 94,000. Conversely, the primary downside target for strong support is identified at 87,000, which may be attained should the Mean Support at 89,500 be breached.
Given the prevailing dynamics in the cryptocurrency market, it is essential for traders to monitor price movements closely. A significant bearish sentiment is exerting downward pressure on prices, with the possibility for an Outer Coin Dip to be reached at 78,500. Additional support levels are indicated at 84,500 and 81,500, further underscoring the need for vigilance in trading strategies.

GBPAUD Is Bullish! Long!
Please, check our technical outlook for GBPAUD.
Time Frame: 1h
Current Trend: Bullish
Sentiment: Oversold (based on 7-period RSI)
Forecast: Bullish
The market is trading around a solid horizontal structure 2.003.
The above observations make me that the market will inevitably achieve 2.007 level.
P.S
Please, note that an oversold/overbought condition can last for a long time, and therefore being oversold/overbought doesn't mean a price rally will come soon, or at all.
Like and subscribe and comment my ideas if you enjoy them!

Ethereum at Key Demand — Smart Money Accumulation Price is holding firmly inside a well-defined demand zone around 3,050–3,080, where sell-side liquidity has already been swept and downside momentum is clearly slowing. The current consolidation suggests accumulation rather than continuation lower.
A strong hold above the demand zone favors a bullish recovery toward the 3,150–3,180 liquidity range, which acts as the first upside checkpoint.
If price reclaims and holds above 3,200, bullish momentum could accelerate toward the supply zone at 3,280–3,320, with a potential extension toward 3,350+. As long as price remains above 3,050, the upside scenario remains the primary focus.

BITCOIN Will Fall! Sell!
Please, check our technical outlook for BITCOIN.
Time Frame: 1h
Current Trend: Bearish
Sentiment: Overbought (based on 7-period RSI)
Forecast: Bearish
The market is approaching a significant resistance area 91,273.22.
Due to the fact that we see a positive bearish reaction from the underlined area, I strongly believe that sellers will manage to push the price all the way down to 90,606.38 level.
P.S
Overbought describes a period of time where there has been a significant and consistent upward move in price over a period of time without much pullback.
Like and subscribe and comment my ideas if you enjoy them!

EUR-JPY Free Signal! Buy!
Hello,Traders!
EURJPY reacts strongly from a clean horizontal demand after a sell-side liquidity sweep. Smart money mitigation is confirmed with bullish displacement, favoring continuation toward higher liquidity resting above recent highs.
--------------------
Stop Loss: 183.34
Take Profit: 184.16
Entry: 183.68
Time Frame: 4H
--------------------
Buy!
Comment and subscribe to help us grow!
Check out other forecasts below too!
Disclosure: I am part of Trade Nation's Influencer program and receive a monthly fee for using their TradingView charts in my analysis.

The Wyckoff Trading MethodThe Wyckoff Trading Method
The Wyckoff Method is a classical approach to market analysis designed to help traders understand trend development, market cycles, and potential reversals. Despite being developed over a century ago, it remains highly relevant in modern financial markets and is widely used across stocks, forex, and cryptocurrencies.
What Is the Wyckoff Method?
The Wyckoff Method is a form of technical analysis created in the early 20th century by Richard D. Wyckoff, a pioneering trader and market analyst. The core idea behind this method is that price movements are governed by supply and demand, and that large institutional participants (often referred to as “composite operators”) leave identifiable footprints on the chart.
Wyckoff believed that by studying price, volume, and time, traders could anticipate future price behavior rather than react to it.
Core Principles of the Wyckoff Method
The Wyckoff methodology is built around several foundational concepts:
1. Supply and Demand
Price rises when demand exceeds supply and falls when supply exceeds demand. Observing how price responds to changes in volume helps traders identify who is in control of the market.
2. Market Structure and Phases
Markets move in recurring cycles, typically broken down into:
- Accumulation
- Markup
- Distribution
- Markdown
Recognizing these phases allows traders to align with institutional activity rather than trade against it.
3. Price and Volume Relationship
Volume acts as a confirmation tool. Strong price movement with weak volume often signals exhaustion, while strong volume supports trend continuation.
4. Liquidity and Institutional Behavior
The method emphasizes how large players accumulate or distribute positions over time, often through range-bound price action designed to absorb liquidity.
The Market Cycle
The Wyckoff Market Cycle
The Wyckoff methodology describes market behavior as a repeating four-phase cycle driven by supply and demand. These phases help traders understand where the market is in its process, rather than simply reacting to price movements.
Accumulation Phase
Accumulation typically appears as a range-bound market after a decline. During this phase, large institutional participants quietly build long positions while price remains relatively stable. To most traders, the market appears directionless, but in reality, buying is taking place without pushing price higher. The true intent of the market is concealed until accumulation is complete.
Markup Phase
Once sufficient long positions have been accumulated, institutions begin to drive price higher. This phase is characterized by a clear uptrend as increased demand attracts additional buyers. Breakouts from accumulation ranges often trigger momentum traders and breakout strategies, reinforcing the trend. Markups may include re-accumulation phases, where price pauses and consolidates before continuing higher.
Distribution Phase
Distribution occurs after an extended advance, when upward momentum begins to slow. During this phase, large players gradually offload long positions and build short exposure. Price often moves sideways in a range, giving the illusion of stability, while smart money exits positions. This phase prepares the market for the next directional move lower.
Markdown Phase
The markdown is the declining phase that follows distribution. Selling pressure overwhelms demand, leading to a sustained downtrend. As price falls, traders are encouraged to enter short positions, further accelerating the move. Similar to markups, markdowns may include redistribution phases, where price consolidates before continuing lower.
Why the Wyckoff Model Works
Large financial institutions must execute trades of significant size, which requires liquidity. Liquidity is often found around stop losses, breakout levels, equal highs and lows, and key support or resistance zones. By intentionally pushing price into these areas, institutions can fill large orders efficiently without excessive slippage. This interaction between liquidity and market psychology forms the foundation of the Wyckoff model across all asset classes.
Core Principles of the Wyckoff Method
A key concept in Wyckoff theory is the Composite Man, a symbolic representation of institutional or “smart money” participants. Traders are encouraged to analyze price action as if a single, highly informed entity is controlling the market. The Composite Man accumulates or distributes positions strategically before allowing price to trend.
The Law of Supply and Demand explains that price rises when demand exceeds supply and falls when supply exceeds demand. The Law of Cause and Effect states that the size and duration of accumulation or distribution determine the magnitude of the subsequent price move, with higher-timeframe structures producing larger effects. The Law of Effort versus Result compares volume (effort) with price movement (result), highlighting potential trend continuation or exhaustion when these two factors diverge.
Wyckoff Schematics
Wyckoff schematics visually represent accumulation and distribution structures. Although these patterns may appear complex at first, they are mirror images of each other, with accumulation and distribution sharing identical phases and logic—only inverted. Studying these schematics helps traders recognize institutional behavior and align their trades with the dominant market process.
Type 1 Schematics
Accumulations
Phase A: Stopping the Downtrend
Phase A marks the transition from a markdown to the beginning of accumulation, where selling pressure starts to weaken.
- Preliminary Support (PS) : After a prolonged decline, initial buying emerges and temporarily halts the downtrend. Volume increases as early demand appears, signaling that selling pressure is no longer dominant.
- Selling Climax (SC) : Panic selling accelerates as long positions are stopped out and breakout traders enter short positions. At this point, the Composite Man absorbs this excess supply. The SC often leaves long lower wicks, reflecting strong buying interest.
- Automatic Rally (AR) : Once selling pressure is exhausted, price rebounds quickly as shorts cover and new buyers step in. The high of the AR establishes the first resistance boundary of the accumulation range.
- Secondary Test (ST) : Price revisits the SC area to test remaining supply. This test may form equal or slightly higher/lower lows, usually with reduced volume, confirming that selling pressure has diminished.
Phase B: Building the Cause
Phase B is where accumulation develops over time. The Composite Man continues to build long positions while price fluctuates within a range.
- Sign of Strength in Phase B (SOS(b)): In some cases, price rallies above the AR, creating a higher high within the range. This move suggests improving demand but still remains below preliminary resistance.
- Secondary Test in Phase B (ST(b)): A sharp decline follows, designed to trigger stop losses below prior lows and attract breakout sellers. This “liquidation” move provides the liquidity institutions need to continue accumulating, forming the underlying cause for the next trend.
Phase C: The Final Shakeout
Phase C is the critical phase that distinguishes accumulation from continuation lower.
- Spring: Price makes a final push below established support, sweeping remaining stop losses and trapping late sellers. This move briefly violates the range before quickly reversing.
- Test: After the Spring, price retests the area to confirm that supply has been fully absorbed. These tests typically form higher lows and occur on lower volume, signaling reduced selling interest.
Phase D: Transition to Markup
Phase D confirms that accumulation is complete and the market is ready to trend higher.
- Last Point of Support (LPS): Following the test and a rally, price pulls back shallowly, forming a higher low. This pullback reflects strong demand and is often the final opportunity before markup.
- Sign of Strength (SOS): Price breaks above the accumulation range with expanding volume, confirming bullish control. After this breakout, the market enters the markup phase, where the effect of prior accumulation is realized through sustained upward movement.
Distributions
Phase A: Stopping the Uptrend
Phase A marks the transition from an uptrend into distribution, where demand begins to weaken and supply quietly enters the market.
- Preliminary Supply (PSY) : After a sustained advance, large operators start unloading positions, causing the first noticeable pause or pullback in price.
- Buying Climax (BC): Buying pressure reaches an extreme as late buyers enter aggressively, often accompanied by very high volume. This is where smart money sells into strength.
- Automatic Rally (AR): Once buying is exhausted, price pulls back sharply as demand fades. The AR typically forms below the BC and defines the first support boundary of the distribution range.
- Secondary Test (ST): Price revisits the BC area to test remaining demand, usually failing to make a new high. Volume is generally lower, indicating reduced buying interest and building liquidity for later phases.
Phase B: Building the Distribution
Phase B is where the Composite Man continues distributing positions while price fluctuates within a range.
- Sign of Weakness in Phase B (SOW(b)): A decline below the AR signals that supply is beginning to dominate. This move does not always appear, but when it does, it establishes a second support boundary.
- Upthrust (UT): Price briefly breaks above resistance to trigger buy stops and attract breakout buyers. This false breakout allows institutions to sell into increased demand and build short exposure.
Phase C: The Final Liquidity Grab
Phase C completes the distribution process by targeting remaining demand.
- Upthrust After Distribution (UTAD): Similar to a Spring in accumulation, UTAD is the final false breakout above resistance. It is designed to capture the last wave of liquidity before the true bearish move begins.
- Test: Price often revisits the UTAD area to confirm that demand has been fully absorbed. These tests typically occur on lower volume, signaling weakening bullish participation.
Phase D: Transition to Markdown
Phase D confirms that distribution is complete and bearish control is established.
- Last Point of Supply (LPSY): After price begins to decline, weak rallies attempt to test demand. These rallies are shallow and usually represent the final bullish reactions before the markdown.
- Sign of Weakness (SOW): Price breaks decisively below the range, confirming a bearish structure. Additional LPSYs may form, but this phase marks the final transition into the markdown.
Type 2 Schematics
Type 2 Wyckoff schematics contain the same structural components as Type 1, but without a Spring (in accumulation) or a UTAD (in distribution). In these cases, the market does not perform a final liquidity sweep before trending.
A Type 2 schematic can be identified by observing a direct transition into trend confirmation:
- In accumulation, price forms a Secondary Test (ST) and possibly an ST(b), then proceeds directly into a Sign of Strength (SOS) followed by markup.
- In distribution, price forms an ST or Upthrust (UT), then transitions directly into a Sign of Weakness (SOW) followed by markdown.
If markup or markdown begins without a Spring or UTAD, the structure should be classified as Type 2. Importantly, Type 2 schematics are traded using the same principles and execution logic as Type 1 structures.
The Five-Step Wyckoff Trading Strategy
Richard D. Wyckoff proposed a structured five-step approach to applying his methodology in real market conditions. This framework helps traders align with market structure and institutional intent.
1. Determine the Market Trend
Identify whether the broader market environment is bullish or bearish. Trading in alignment with the dominant trend increases probability.
2. Select a Suitable Market
Choose an asset or trading pair that clearly reflects the identified market trend and shows strong structural clarity.
3. Identify Accumulation or Distribution
Focus on assets that are currently forming a Wyckoff accumulation or distribution structure rather than those already trending.
4. Assess Readiness for a Move
Analyze the current Wyckoff phase and volume behavior. Events such as a Spring, UTAD, SOS, or SOW help confirm whether the market is prepared for markup or markdown.
5. Execute the Entry
Entries are commonly taken on Tests, Last Points of Support (LPS), or Last Points of Supply (LPSY), where risk can be controlled and structure is clear.
Does the Wyckoff Method Still Work?
- Despite being developed nearly a century ago, the Wyckoff Method remains highly relevant in modern markets. Its core principles supply and demand, market structure, volume analysis, and liquidity behavior are universal and apply across forex, stocks, commodities, and cryptocurrencies.
- When combined with complementary tools such as support and resistance, indicators, or pattern analysis, Wyckoff can form the foundation of a robust and disciplined trading approach. Its enduring value lies in teaching traders how markets move, not just where price is going.
Educational Disclaimer
This material is provided for educational purposes only. It reflects a general interpretation of the Wyckoff methodology and should not be considered financial advice, investment recommendations, or an offer to trade. Traders should always conduct their own analysis and manage risk responsibly.

SILVER Will Collapse! SELL!
My dear subscribers,
This is my opinion on the SILVER next move:
The instrument tests an important psychological level 7995.1
Bias - Bearish
Technical Indicators: Supper Trend gives a precise Bearish signal, while Pivot Point HL predicts price changes and potential reversals in the market.
Target - 7807.8
My Stop Loss - 8100.3
About Used Indicators:
On the subsequent day, trading above the pivot point is thought to indicate ongoing bullish sentiment, while trading below the pivot point indicates bearish sentiment.
Disclosure: I am part of Trade Nation's Influencer program and receive a monthly fee for using their TradingView charts in my analysis.
———————————
WISH YOU ALL LUCK

AUD-USD Free Signal! Buy!
Hello,Traders!
AUDUSD reacts from a well-defined horizontal demand after a corrective sell-off. Sell-side liquidity has been swept and smart money mitigation is confirmed, with bullish displacement favoring continuation toward higher liquidity and premium levels.
--------------------
Stop Loss: 0.6658
Take Profit: 0.6721
Entry: 0.6686
Time Frame: 6H
--------------------
Buy!
Comment and subscribe to help us grow!
Check out other forecasts below too!
Disclosure: I am part of Trade Nation's Influencer program and receive a monthly fee for using their TradingView charts in my analysis.

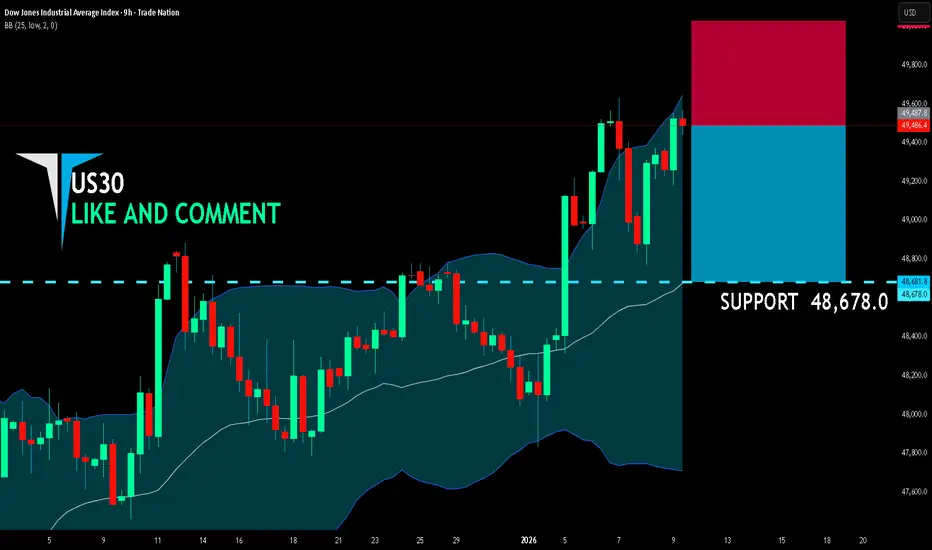
US30 BEARISH BIAS RIGHT NOW| SHORT
US30 SIGNAL
Trade Direction: short
Entry Level: 49,487.8
Target Level: 48.678.0
Stop Loss: 50,026.4
RISK PROFILE
Risk level: medium
Suggested risk: 1%
Timeframe: 9h
Disclosure: I am part of Trade Nation's Influencer program and receive a monthly fee for using their TradingView charts in my analysis.
✅LIKE AND COMMENT MY IDEAS✅