BOND Break Out?💣 Bonds Near a Major Breakout — And It’s Not Bullish for Risk Assets
We’re approaching a critical breakout zone in bonds.
At first glance, you might think: “High demand for U.S. debt? That’s great! Higher bond prices, lower yields, cheaper interest payments!”
That’s Trump-math logic — the same kind that says prices are “down 300%.” 😅 You can only go down 100%, folks. No matter where the price goes!
Here’s the real story:
For bond prices to surge, investors must be running from risk. Big money managers don’t dump billions into a $250k FDIC-insured savings account 😅 — they rotate into Treasuries when fear spikes.
That’s a double whammy:
1️⃣ Reducing margin
2️⃣ Stocks and other risk assets get liquidated.
When this rotation accelerates, expect risk assets to crater — the “buy-the-dip,” “crypto-Lambo bros,” “GME, AI memers” & "Colorful Chartists" crowd gets ANNIHILATED!
All of that from this one silly chart? No, there is no single holy grail of an analysis chart. Just a piece of the puzzle.
Smart money is moving to safety. Don’t get caught holding the bag. Keep an eye on this chart!
Thank you ALL FOR getting me up to 5,000 followers!! ))
Click boost, follow, comment nicely for more authentic, no BS, raw analysis. Let's get to 6,000 followers. ))
Trading

ABT Update📊 ABT Update
ABT is approaching a big red resistance zone 🔴
It could be wise to take some profits before price reaches this level 💰
Sellers may step in around this zone and push the price down ⚠️
Watch for rejection signs or bearish candles near resistance 👀

TAKE Update📊 TAKE Update
TAKE is testing the red resistance zone 🔴
If it breaks out above, the first target will be the green line level 🟢
Momentum is building — watch for a confirmed breakout candle 📈

LINEA Update📊 LINEA Update
LINEA failed once again to break out above the red resistance zone 🔴
This shows that sellers are still strong at this level, keeping pressure on the price ⚠️
A clean breakout above the zone would be needed to confirm bullish momentum 📈

POPCAT Update📊 POPCAT Update
POPCAT is facing a strong red resistance zone 🔴 on the daily time frame ⏰
Until it breaks out above this level, there’s no major sign of a bullish reversal trend ⚠️
Patience is key — wait for a clear breakout confirmation before jumping in 📉➡📈

XRP Update📊 XRP Update
XRP is approaching the green support zone 🟢
Now the question is — will it bounce or break below? ⚖️
If it holds, we could see a strong rebound 📈
But if it breaks, expect a deeper correction 🔻

PLTR CAUTION!PLTR is at a key critical area, which has already given a warning shot to bulls.
We have a complete rising wedge structure with 3 waves up and a hook that has already cracked! Within it, we also have a head and shoulders at the top, which is bearish. (H&S not a top is usually a continuation pattern.) AS is always the case, if the overall market is not ready to head south, it will fail as a full-on reversal pattern.
I urge CAUTION!! to PLTR bulls.
For shorts, you need to see a crack, gap fill, plus follow through for a new lower low in a small time frame. You can't have a reversal without lower lows and lower highs.
Thank you ALL FOR getting me up to 5,000 followers!! ))
Click boost, follow, comment nicely for more authentic, no BS, raw analysis. Let's get to 6,000 followers. ))

BEAT Update📊 BEAT Update
BEAT is currently in an uptrend 📈
Now the key is patience — the smart entry is waiting for a retracement to the green support zone 🟢,
where buyers previously accumulated and could push the price up again 🚀
Anyone who says price can’t retrace doesn’t understand trading —
Be smart, not a lamb 🧠🐑

TRUMP Update📊 TRUMP Update
TRUMP has broken out above the blue support zone 🔵 and reached its first target level ✅

AUDUSD BREAKOUT TESTSo basically on the 1 hour time frame we are expecting a breakout test out of the consolidation zone only unto that happens we can neither long or short

GOLD STRONG BREAKOUT|LONG|
✅XAUUSD executed a clean market structure shift after accumulating below discount. With a strong displacement candle, bulls target premium inefficiency toward the next liquidity pocket. Time Frame 4H.
LONG🚀
✅Like and subscribe to never miss a new idea!✅

CAD-CHF Bearish Breakout! Sell!
Hello,Traders!
CADCHF broke structure below the supply zone, confirming bearish order flow. Price is likely to retrace toward premium before extending into lower liquidity pools. Time Frame 4H.
Sell!
Comment and subscribe to help us grow!
Check out other forecasts below too!
Disclosure: I am part of Trade Nation's Influencer program and receive a monthly fee for using their TradingView charts in my analysis.

GBPCAD LOCAL LONG|
✅GBPCAD swept sell-side liquidity below a key low and rebounded from a refined demand zone, signaling potential bullish displacement toward the next internal range high. Time Frame 3H.
LONG🚀
✅Like and subscribe to never miss a new idea!✅

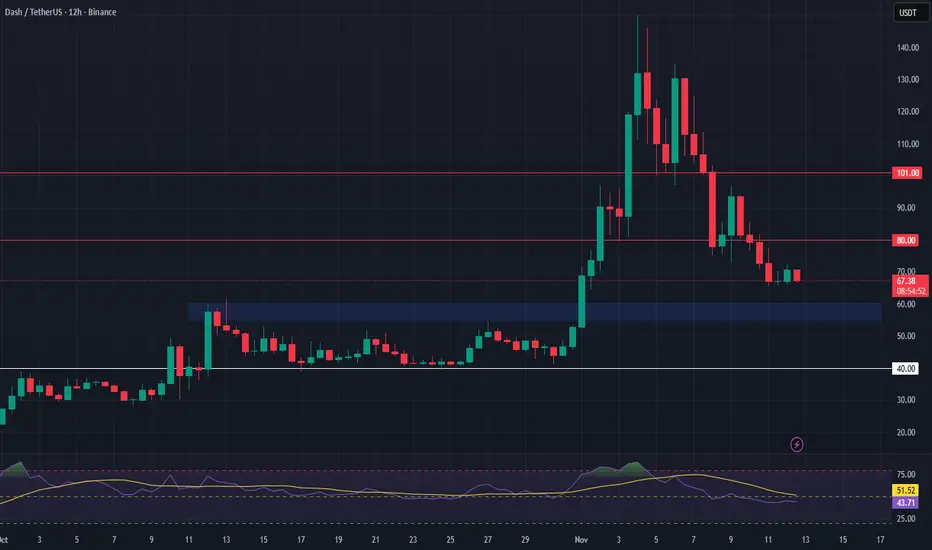
DASH – Watching for a Higher Timeframe ReversalWe’re looking for DASH to pull back and test the next major support zone before potentially reversing its trend back to the upside. This setup provides an opportunity to position early for a long spot trade once confirmation appears.
Trade Setup:
• Entry Zone: $55 – $60
• Take Profit Targets:
🥇 $80
🥈 $101
• Stop Loss: $40
GBP-JPY Free Signal! Sell!
Hello,Traders!
GBPJPY is tapping into a key supply area where prior liquidity rests above equal highs. The market structure hints at exhaustion and a potential move lower toward discount levels as the supply level was clearly rejected!
---------------------
Stop Loss: 203.440
Take Profit: 202.300
Entry: 202.863
Time Frame: 4H
---------------------
Sell!
Comment and subscribe to help us grow!
Check out other forecasts below too!
Disclosure: I am part of Trade Nation's Influencer program and receive a monthly fee for using their TradingView charts in my analysis.

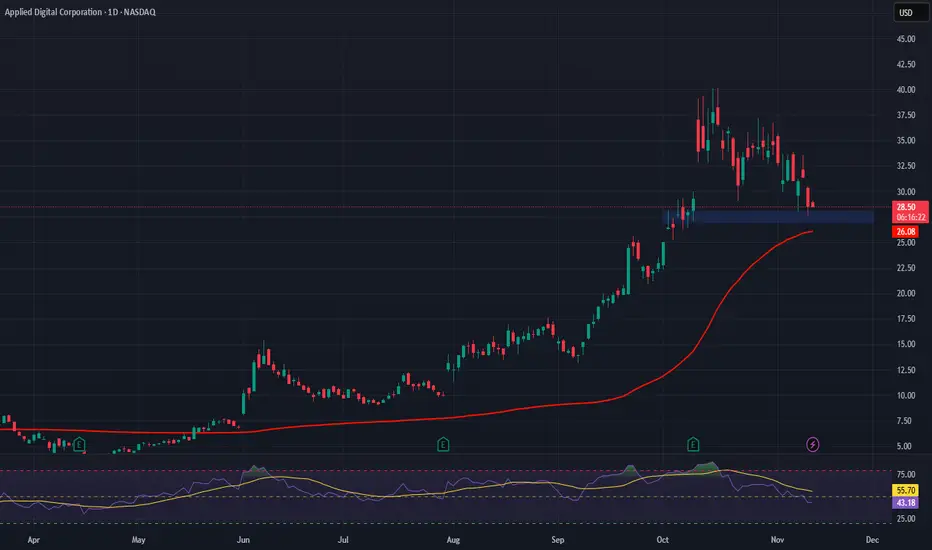
Applied Digital Corporation (APLD) AnalysisCompany Overview:
Applied Digital NASDAQ:APLD is an AI and high-performance computing (HPC) infrastructure leader building next-gen data centers purpose-built for GPU computing, AI workloads, and digital assets. It’s positioning itself in the center of the AI infrastructure supercycle.
Key Catalysts:
Transformational Hyperscaler Deal:
Secured a $5B, 15-year lease with a top U.S. hyperscaler for 200 MW at its Polaris Forge 2 campus.
This places APLD among elite U.S. data center operators and locks in long-duration, recurring revenue.
Polaris Forge Build-Out:
Phase 1 (50 MW) at Polaris Forge Building 1 is Ready for Service (RFS).
Full 100 MW online by Q4 2025, with another 150 MW in development — pushing the company toward its 1 GW portfolio goal.
AI “Neo Cloud” Tailwind via CoreWeave:
A deeper CoreWeave partnership boosts utilization of APLD’s AI infrastructure and gives access to the fast-growing AI-specialized cloud market, where demand is outpacing legacy cloud capacity.
Strategic Positioning:
Purpose-built, power-efficient campuses
Aligned with massive AI GPU demand
Long-term contracted cash flows
Investment Outlook:
Bullish above: $27.00–$28.00
Target: $50.00–$52.00
Driven by contracted hyperscaler revenue, rapid MW ramp, and exposure to AI compute scarcity.
📢 APLD — building the power layer of the AI era. ⚡🏗️
EURGBP Will Collapse! SELL!
My dear friends,
Please, find my technical outlook for EURGBP below:
The price is coiling around a solid key level - 0.8825
Bias - Bearish
Technical Indicators: Pivot Points Low anticipates a potential price reversal.
Super trend shows a clear sell, giving a perfect indicators' convergence.
Goal - 0.8804
About Used Indicators:
The pivot point itself is simply the average of the high, low and closing prices from the previous trading day.
Disclosure: I am part of Trade Nation's Influencer program and receive a monthly fee for using their TradingView charts in my analysis.
———————————
WISH YOU ALL LUCK

AUDJPY The Target Is DOWN! SELL!
My dear followers,
This is my opinion on the AUDJPY next move:
The asset is approaching an important pivot point 101.25
Bias - Bearish
Safe Stop Loss - 101. 42
Technical Indicators: Supper Trend generates a clear short signal while Pivot Point HL is currently determining the overall Bearish trend of the market.
Goal - 100.95
About Used Indicators:
For more efficient signals, super-trend is used in combination with other indicators like Pivot Points.
Disclosure: I am part of Trade Nation's Influencer program and receive a monthly fee for using their TradingView charts in my analysis.
———————————
WISH YOU ALL LUCK

GBPUSD: Very Bearish Outlook 🇬🇧🇺🇸
Intraday price action on GBPUSD looks very bearish after a recent
test of a significant daily resistance that we discussed earlier.
The occurrence of a bearish imbalance indicates a highly probable
down movement.
I anticipate a fall at least to 1.3064
❤️Please, support my work with like, thank you!❤️
I am part of Trade Nation's Influencer program and receive a monthly fee for using their TradingView charts in my analysis.

GOLD SENDS CLEAR BEARISH SIGNALS|SHORT
GOLD SIGNAL
Trade Direction: short
Entry Level: 4,124.58
Target Level: 4,005.98
Stop Loss: 4,203.19
RISK PROFILE
Risk level: medium
Suggested risk: 1%
Timeframe: 9h
Disclosure: I am part of Trade Nation's Influencer program and receive a monthly fee for using their TradingView charts in my analysis.
✅LIKE AND COMMENT MY IDEAS✅

EUR/JPY BEARS ARE GAINING STRENGTH|SHORT
EUR/JPY SIGNAL
Trade Direction: short
Entry Level: 179.218
Target Level: 177.695
Stop Loss: 180.236
RISK PROFILE
Risk level: medium
Suggested risk: 1%
Timeframe: 4h
Disclosure: I am part of Trade Nation's Influencer program and receive a monthly fee for using their TradingView charts in my analysis.
✅LIKE AND COMMENT MY IDEAS✅

EUR/GBP SELLERS WILL DOMINATE THE MARKET|SHORT
Hello, Friends!
EUR/GBP pair is trading in a local uptrend which we know by looking at the previous 1W candle which is green. On the 1H timeframe the pair is going up too. The pair is overbought because the price is close to the upper band of the BB indicator. So we are looking to sell the pair with the upper BB line acting as resistance. The next target is 0.879 area.
Disclosure: I am part of Trade Nation's Influencer program and receive a monthly fee for using their TradingView charts in my analysis.
✅LIKE AND COMMENT MY IDEAS✅

USD/CHF BULLISH BIAS RIGHT NOW| LONG
Hello, Friends!
We are targeting the 0.804 level area with our long trade on USD/CHF which is based on the fact that the pair is oversold on the BB band scale and is also approaching a support line below thus going us a good entry option.
Disclosure: I am part of Trade Nation's Influencer program and receive a monthly fee for using their TradingView charts in my analysis.
✅LIKE AND COMMENT MY IDEAS✅
