USD-CHF Supply Level Above! Sell!
Hello,Traders!
USDCHF Price is approaching a horizontal supply area but hasn’t confirmed a retest yet. Smart money may seek liquidity sweep above before reacting lower toward the target zone. Time Frame 4H.
Sell!
Comment and subscribe to help us grow!
Check out other forecasts below too!
Disclosure: I am part of Trade Nation's Influencer program and receive a monthly fee for using their TradingView charts in my analysis.
Trading

COAI - IS BOTTOM IN ?? Volume increasing on #COAI & setup I gave this morning played well with a 20%+ bull increase from the low! 📈
Following the same plan, I think that the bottom could be in if 0.786 fib act as bottom & retest (1.3200$).
Therefore, bulls could push prices toward 1.80$+ from here next! 🚀 (or even much higher, if we catch the monthly low & whales join the party again... here after a 90%+ retracement!)
I took 140% profits, I'll buy again this dip :) (x10)
Chart structure looks much safer.
Let's see! 👀
Just sharing a possible bottom here!
Not a financial advice team! Huge volatility! #DYOR


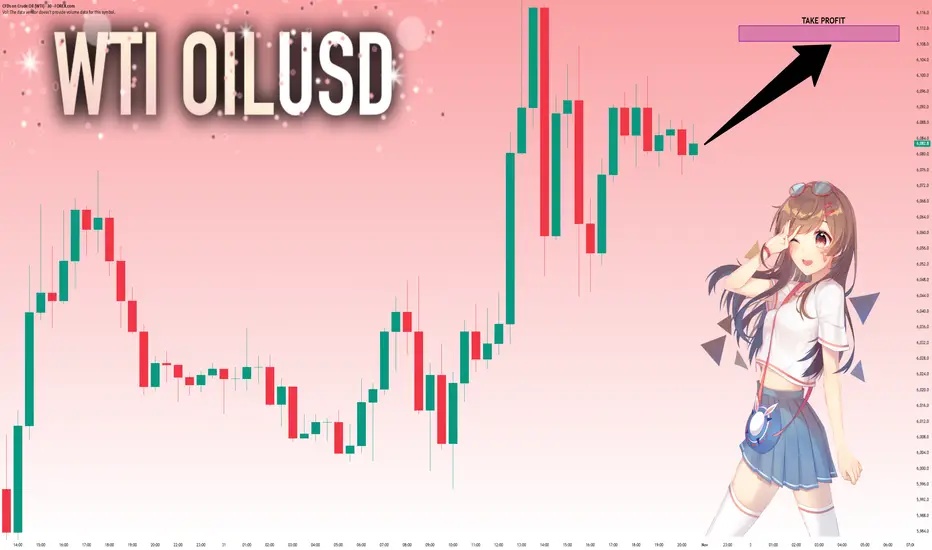
USOIL: Target Is Up! Long!
My dear friends,
Today we will analyse USOIL together☺️
The in-trend continuation seems likely as the current long-term trend appears to be strong, and price is holding above a key level of 6,082.8 So a bullish continuation seems plausible, targeting the next high. We should enter on confirmation, and place a stop-loss beyond the recent swing level.
❤️Sending you lots of Love and Hugs❤️
NG1!: Local Bearish Bias! Short!
My dear friends,
Today we will analyse NG1! together☺️
The market is at an inflection zone and price has now reached an area around 4.121 where previous reversals or breakouts have occurred.And a price reaction that we are seeing on multiple timeframes here could signal the next move down so we can enter on confirmation, and target the next key level of 4.051.Stop-loss is recommended beyond the inflection zone.
❤️Sending you lots of Love and Hugs❤️

NI225: Absolute Price Collapse Ahead! Short!
My dear friends,
Today we will analyse NI225 together☺️
The price is near a wide key level
and the pair is approaching a significant decision level of 52,411.34 Therefore, a strong bearish reaction here could determine the next move down.We will watch for a confirmation candle, and then target the next key level of 51,980.39.Recommend Stop-loss is beyond the current level.
❤️Sending you lots of Love and Hugs❤️

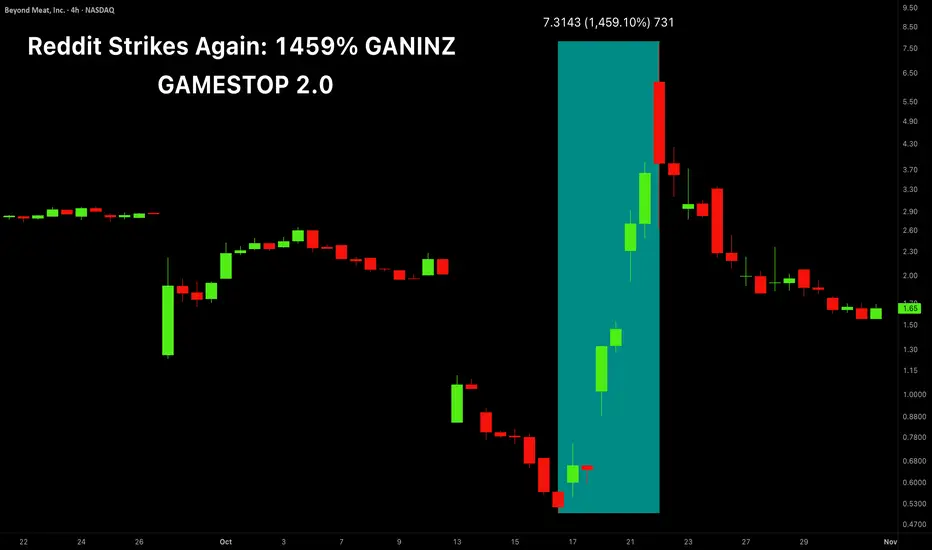
BEYOND MEAT: How One Trader Pumped A Stock 1500%!
BEYOND MEAT: How One Trader Pumped A Stock 1500%!
📈What It's All About:
The chart you are looking at is not one of a sh*tcoin, it’s a stock listed on the New York Stock Exchange! The company is called Beyond Meat, a pioneer of the artificial meat market. A set of commercial failures and debt problems brought the stock down by 99.79% from the highs when the pump started!
📈The Pump:
A Reddit account called "Capybara Stocks" disclosed buying roughly 3.1 million BYND shares around mid-October and published a detailed bullish thesis, arguing the note exchange plus equity issuance, which triggered dilution fears, actually reduced bankruptcy risk and improved the balance sheet.
His post highlighted heavy short interest/borrow costs and retail options flows that amplified the upside.
📈What Happened Next:
It was a typical short squeeze on an epic scale. With the 54% short float, a sudden buying spree started triggering stop losses and key options levels. People who sold the options and expected to make easy $100 were now looking at $1,000+ potential losses and were scrambling to buy shares to "cover" their sold options.
📈GameStop Case:
This scenario closely mirrors the GameStop stock pump ( NYSE:GME ) during 2020/21 when the stock was pumped by Reddit trading group WeTradeStocks from $17 to $483 within days (a 2,840% surge), driving some hedge funds into near bankruptcy.
📈What Now:
As BYND stock price has already lost 50% from the recent highs and seems to want to go lower, the company’s current prospects remain bleak with revenue projected to drop 14% next year.
But the CapybaraStocks trader made $10,000,000 in profits and says he kept a sizeable position in the stock as he believes in it “long term.” Many option traders made small fortunes, and the people who were on the opposite side of the trade went bankrupt overnight.
📈Conclusion:
Hats off to the legends who pumped the stock to the moon and HODLED!
To those who lost money: C’est la vie 😎
Yours Truly,
Greg🌹
EURUSD Massive Long! BUY!
My dear friends,
My technical analysis for EURUSD is below:
The market is trading on 1.1536 pivot level.
Bias - Bullish
Technical Indicators: Both Super Trend & Pivot HL indicate a highly probable Bullish continuation.
Target - 1.1577
About Used Indicators:
A pivot point is a technical analysis indicator, or calculations, used to determine the overall trend of the market over different time frames.
Disclosure: I am part of Trade Nation's Influencer program and receive a monthly fee for using their TradingView charts in my analysis.
———————————
WISH YOU ALL LUCK

US100 Technical Analysis! BUY!
My dear friends,
US100 looks like it will make a good move, and here are the details:
The market is trading on 25826 pivot level.
Bias - Bullish
Technical Indicators: Supper Trend generates a clear long signal while Pivot Point HL is currently determining the overall Bullish trend of the market.
Goal - 25982
Recommended Stop Loss - 25749
About Used Indicators:
Pivot points are a great way to identify areas of support and resistance, but they work best when combined with other kinds of technical analysis
Disclosure: I am part of Trade Nation's Influencer program and receive a monthly fee for using their TradingView charts in my analysis.
———————————
WISH YOU ALL LUCK

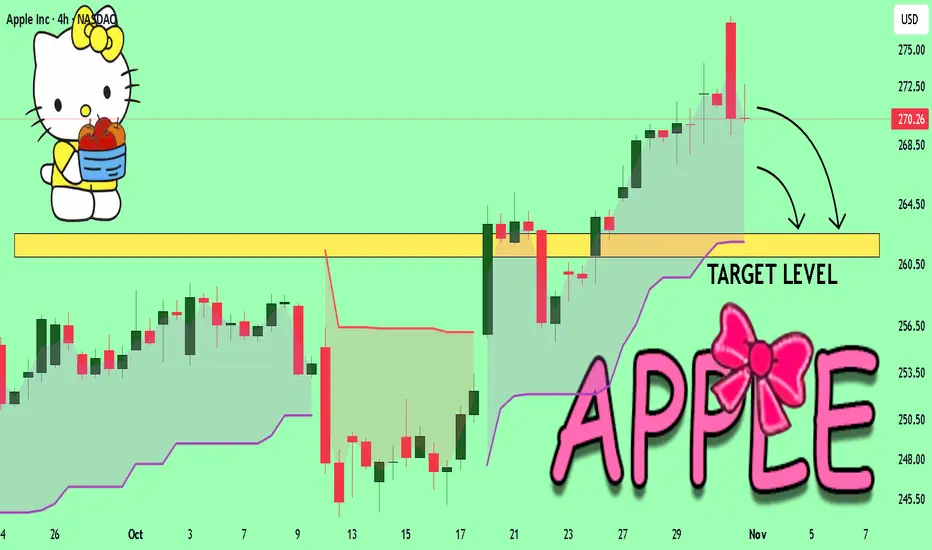
APPLE Set To Fall! SELL!
My dear subscribers,
APPLE looks like it will make a good move, and here are the details:
The market is trading on 270.26 pivot level.
Bias - Bearish
Technical Indicators: Both Super Trend & Pivot HL indicate a highly probable Bearish continuation.
Target - 262.56
About Used Indicators:
The average true range (ATR) plays an important role in 'Supertrend' as the indicator uses ATR to calculate its value. The ATR indicator signals the degree of price volatility.
Disclosure: I am part of Trade Nation's Influencer program and receive a monthly fee for using their TradingView charts in my analysis.
———————————
WISH YOU ALL LUCK
USOIL Will Collapse! SELL!
My dear subscribers,
This is my opinion on the USOIL next move:
The instrument tests an important psychological level 60.87
Bias - Bearish
Technical Indicators: Supper Trend gives a precise Bearish signal, while Pivot Point HL predicts price changes and potential reversals in the market.
Target - 60.50
My Stop Loss - 61.09
About Used Indicators:
On the subsequent day, trading above the pivot point is thought to indicate ongoing bullish sentiment, while trading below the pivot point indicates bearish sentiment.
Disclosure: I am part of Trade Nation's Influencer program and receive a monthly fee for using their TradingView charts in my analysis.
———————————
WISH YOU ALL LUCK

EUR-AUD Bullish Bias! Buy!
Hello,Traders!
EURAUD Price has tapped into a clean horizontal demand area after an extended bearish leg. Smart money shows absorption of sell-side liquidity, hinting at a potential short-term bullish move toward the target.
-------------------
Stop Loss: 1.7580
Take Profit: 1.7660
Entry Level: 1.7624
Time Frame: 4H
-------------------
Buy!
Comment and subscribe to help us grow!
Check out other forecasts below too!
Disclosure: I am part of Trade Nation's Influencer program and receive a monthly fee for using their TradingView charts in my analysis.

GBPCAD FREE SIGNAL|LONG|
✅GBPCAD :a clear double-bottom formation confirms the exhaustion of sellers after the extended downtrend. Buyers are reclaiming structure, hinting at a potential bullish reversal toward the target zone.
—————————
Entry: 1.8413
Stop Loss: 1.8359
Take Profit: 1.8496
Time Frame: 1H
—————————
LONG🚀
✅Like and subscribe to never miss a new idea!✅

AUD-NZD Free Signal! Sell!
Hello,Traders!
AUDNZD Price is reacting from a clean horizontal supply zone where previous liquidity was taken. Smart money is now showing rejection signs — expecting a short move toward the downside target zone.
-------------------
Stop Loss: 1.1447
Take Profit: 1.1416
Entry: 1.1431
Time Frame: 4H
-------------------
Sell!
Comment and subscribe to help us grow!
Check out other forecasts below too!
Disclosure: I am part of Trade Nation's Influencer program and receive a monthly fee for using their TradingView charts in my analysis.

NZDUSD FREE SIGNAL|LONG|
✅NZDUSD bounced strongly from the defined demand level, confirming bullish order flow. The pair may continue climbing toward the target zone as liquidity above recent highs gets cleared.
—————————
Entry: 0.5725
Stop Loss: 0.5709
Take Profit: 0.5744
Time Frame: 2H
—————————
LONG🚀
✅Like and subscribe to never miss a new idea!✅

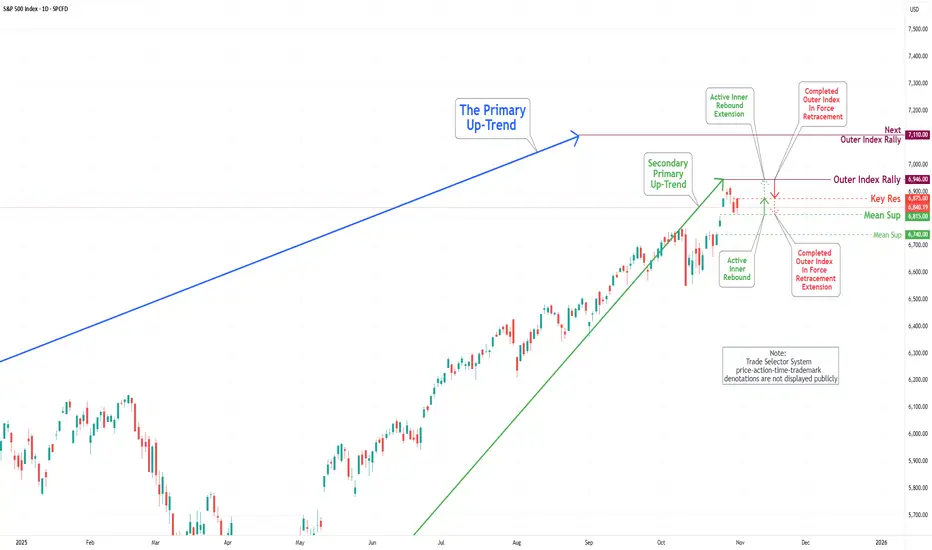
S&P 500 Daily Chart Analysis For Week of Oct 31, 2025Technical Analysis and Outlook:
During the recent trading session, the S&P 500 Index continued its wild ride, highlighting the importance of our key target, which stands as an Outer Index Rally at 6946. Fluctuations between the Mean Support at 6815 and the Key Resistance at 6875 serve as a crucial threshold for market participants. This positioning suggests the potential for further upward momentum, as the prevailing trend indicates a well-structured Active Inner Rebound extension toward the target stated above.
Nevertheless, it is essential to acknowledge the possibility of a sustained and gradual pullback within the current Active Inner Rebound zone. Such a pullback may retest the Mean Support at 6815 and could decline further to the Mean Support at 6740 before ultimately resuming an upward trajectory.
EUR/USD Daily Chart Analysis For Week of Oct 31, 2025Technical Analysis and Outlook:
In the most recent trading session, the Eurodollar market exhibited substantial downward movement, declining significantly from the critical Mean Resistance level of 1.165. The market penetrated two weakened Mean Support levels, 1.159 and 1.155, ultimately stabilizing just above the Inner Currency Dip at 1.151.
The current market assessment suggests that the prevailing progressive trend is likely to persist toward the initial Inner Currency Dip at 1.151, with the expectation of eventually reaching the Outer Currency Dip at 1.145. Nevertheless, the active Inner Trading Zone is expected to remain highly dynamic until the currency achieves these two specified targets. Furthermore, it is essential to remain cognizant of the rebound thresholds for the currency, within the two principal outputs.

Bitcoin(BTC/USD) Daily Chart Analysis For Week of Oct 31, 2025Technical Analysis and Outlook:
The trading session from last week was notably eventful. The Bitcoin market experienced significant volatility, fluctuating between the Mean Resistance level of 116,000 and the critical Mean Support level of 106,500. Currently, the price is actively navigating this range.
Current market analysis indicates a likelihood of a retest toward the Mean Support level at 106,500, with a primary focus on the potential for further downward movement towards the Mean Support level of 101,000. This trajectory may ultimately lead to our key objective of reaching the Outer Coin Dip at 97,000. It is, however, essential to acknowledge the robust rebound potential at these pivotal levels.

USOIL BEARS WILL DOMINATE THE MARKET|SHORT
USOIL SIGNAL
Trade Direction: short
Entry Level: 60.87
Target Level: 55.71
Stop Loss: 64.31
RISK PROFILE
Risk level: medium
Suggested risk: 1%
Timeframe: 1D
Disclosure: I am part of Trade Nation's Influencer program and receive a monthly fee for using their TradingView charts in my analysis.
✅LIKE AND COMMENT MY IDEAS✅

USD/JPY SENDS CLEAR BEARISH SIGNALS|SHORT
Hello, Friends!
USD/JPY pair is in the downtrend because previous week’s candle is red, while the price is obviously rising on the 4H timeframe. And after the retest of the resistance line above I believe we will see a move down towards the target below at 152.709 because the pair is overbought due to its proximity to the upper BB band and a bearish correction is likely.
Disclosure: I am part of Trade Nation's Influencer program and receive a monthly fee for using their TradingView charts in my analysis.
✅LIKE AND COMMENT MY IDEAS✅

NZD/USD BULLS ARE GAINING STRENGTH|LONG
Hello, Friends!
NZD/USD pair is trading in a local downtrend which we know by looking at the previous 1W candle which is red. On the 4H timeframe the pair is going down too. The pair is oversold because the price is close to the lower band of the BB indicator. So we are looking to buy the pair with the lower BB line acting as support. The next target is 0.575 area.
Disclosure: I am part of Trade Nation's Influencer program and receive a monthly fee for using their TradingView charts in my analysis.
✅LIKE AND COMMENT MY IDEAS✅

GBPUSD Will Move Higher! Long!
Here is our detailed technical review for GBPUSD.
Time Frame: 1D
Current Trend: Bullish
Sentiment: Oversold (based on 7-period RSI)
Forecast: Bullish
The market is testing a major horizontal structure 1.315.
Taking into consideration the structure & trend analysis, I believe that the market will reach 1.335 level soon.
P.S
We determine oversold/overbought condition with RSI indicator.
When it drops below 30 - the market is considered to be oversold.
When it bounces above 70 - the market is considered to be overbought.
Like and subscribe and comment my ideas if you enjoy them!

GBPCHF Is Bullish! Buy!
Take a look at our analysis for GBPCHF.
Time Frame: 4h
Current Trend: Bullish
Sentiment: Oversold (based on 7-period RSI)
Forecast: Bullish
The market is approaching a key horizontal level 1.058.
Considering the today's price action, probabilities will be high to see a movement to 1.062.
P.S
Overbought describes a period of time where there has been a significant and consistent upward move in price over a period of time without much pullback.
Like and subscribe and comment my ideas if you enjoy them!
