GBP-NZD Bullish Bias! Buy!
Hello,Traders!
GBPNZD has retested a bullish demand zone after breaking structure to the upside. Smart money may engineer a deeper pullback before pushing toward the next liquidity pool above. Time Frame 3H.
Buy!
Comment and subscribe to help us grow!
Check out other forecasts below too!
Disclosure: I am part of Trade Nation's Influencer program and receive a monthly fee for using their TradingView charts in my analysis.
Trading

Oruka Therapeutics, Inc. (ORKA) AnalysisCompany Overview:
Oruka Therapeutics NASDAQ:ORKA is a clinical-stage biotech focused on next-generation monoclonal antibody (mAb) therapies for psoriasis and autoimmune/inflammatory diseases, positioning itself in one of biotech’s most durable, high-value markets.
Key Catalysts:
Breakthrough Half-Life Data:
Lead asset ORKA-001 achieved a record 100-day half-life in Phase 1, opening the door to once-yearly dosing — a massive convenience and adherence advantage over current standard biologics like Skyrizi and other IL-23 inhibitors.
A Phase 2a trial is slated for late 2025, serving as the next major value-inflection point.
Deep Immunology Pipeline:
ORKA-002 (IL-17A/F) expands the platform into another validated inflammatory axis.
Additional programs targeting broader inflammatory pathways give ORKA multi-shot-on-goal potential across dermatology and immunology.
Strong Balance Sheet & Runway:
Backed by $455M in funding and cash runway through 2027, the company can run multiple trials in parallel without near-term dilution pressure — a key edge for a clinical-stage biotech.
Massive Market Opportunity:
The global psoriasis market is ~$30B, dominated by biologics — making a once-yearly, high-efficacy therapy highly disruptive.
Investment Outlook:
Bullish above: $22–$23
Target: $55–$56
Driven by best-in-class dosing potential, multiple upcoming clinical readouts, and strong funding to reach value-creating milestones.
📢 ORKA — aiming to redefine psoriasis treatment with ultra-long-acting biologics.

Modine Manufacturing Co. (MOD) AnalysisCompany Overview:
Modine Manufacturing Co. NYSE:MOD is a global leader in thermal management solutions serving automotive, industrial, commercial, and now rapidly growing AI data center markets. The company offers investors exposure to the electrification, energy-efficiency, and digital infrastructure megatrends.
Key Growth Drivers:
AI Data Center Tailwind: MOD is riding the AI infrastructure boom, with Q1 2026 sales up 3% YoY, driven by demand for its precision cooling systems that support high-performance computing environments.
Margin Expansion via Mix Shift: A deliberate focus on high-margin segments—notably data centers and EV thermal systems—has pushed profitability to 24.8% gross margin and 10.7% EBIT margin, underscoring operational excellence and strong cash generation.
Electrification & Energy Efficiency: MOD’s solutions align with ESG and sustainability initiatives, providing energy-efficient heat transfer systems for EVs, buildings, and industrial applications.
Diversified Portfolio: Global footprint and multi-end-market exposure reduce cyclicality and support durable, long-term growth in green and digital infrastructure.
Why It Matters for Investors:
✅ Direct play on AI data center cooling
✅ Strong, improving margins
✅ ESG-aligned, electrification-driven demand
✅ Disciplined portfolio optimization (80/20 execution)
Investment Outlook:
Bullish above: $140–$142
Upside Target: $230–$235
Driven by AI infrastructure growth, premium thermal solutions, and continued margin expansion.
📌 MOD — powering the thermal backbone of AI, EVs, and sustainable infrastructure. 💡🌍

Gold Price Rejection at Trendline – Pullback Toward 4075 TargetGold price is testing a key resistance trendline near the 4,110 level after a strong bullish rally. A potential pullback is expected toward the 4,075 target zone, aligning with a nearby support level and fair value gap (FVG).

SOLUSDT Breaks Out and Aims for $200!BINANCE:SOLUSDT is trading above the 50 EMA on the 4H chart. a strong sign for short-term momentum. If you look closely, it has also broken out of an ascending triangle pattern and is moving upward with solid volume.
We’re expecting a potential upmove from here, with a short-term target around $200.
Always remember to set your stop loss and manage your risk wisely.
BINANCE:SOLUSDT Currently trading at $167
Buy level : Above $165
Stop loss : Below $154
Target 1: 175
Target 2: 200
Max leverage 3x
Always keep stop loss
Follow Our Tradingview Account for More Technical Analysis Updates, | Like, Share and Comment Your thoughts

#AN027: US Shutdown Agreement, Effects on the Dollar and Forex
The historic political impasse in the United States – with the 2025 United States federal government shutdown – appears to be nearing a resolution. Hello, I'm Forex Trader Andrea Russo, an independent trader and prop trader with $200,000 in capital under management. Thank you in advance for your time.
A Senate agreement provides for the reopening of the federal government through a continuing resolution, with the reinstatement of public employees' arrears.
In the FX context, this event has immediate and medium-term implications for the US dollar (USD) and major global currencies. In this article, we analyze the dynamics and provide a guide for those trading on TradingView.
What Happened
The Senate obtained an initial procedural yes to the resolution to reopen the government.
Markets are showing initial relief: the US dollar has halted its recent bullish momentum, pending operational confirmation.
The government shutdown had already caused delays in economic data and a climate of political uncertainty that is hindering the Federal Reserve's clear definition of monetary strategies.
Impact on Forex: Key Factors
1. Political Risk Effect and Sentiment
With the prospect of an end to the shutdown, the risk premium associated with the US government and fiscal governance is decreasing. This tends to favor the dollar in the short term, especially against safe-haven currencies. However, sentiment remains cautious, given the residual uncertainty.
2. Delayed Macroeconomic Data and Volatility
The lack or delay in the release of economic data (e.g., employment, inflation) complicates forecasting the Fed's moves and reduces traders' ability to confidently position themselves on the USD.
3. Yields and Carry Trades
If the agreement fuels an improvement in the US economic profile, US bond yields could rise, attracting flows into the dollar. On the other hand, if the economy shows signs of post-shutdown weakness, the effect could reverse.
4. Technical scenarios in major FX pairs
EUR/USD: Possible dollar rebound → downward pressure on EUR/USD. However, if US data deteriorates, a strong USD-weak trend could be triggered.
USD/JPY: The dollar could benefit from rising yields + carry trades; but a safe-haven turn on the yen if global risks emerge.
GBP/USD / AUD/USD: Commodity or risk-linked currencies could benefit from risk-on, but a strong dollar will limit rebounds.

NZDUSD Will Fall! Short!
Please, check our technical outlook for NZDUSD.
Time Frame: 1h
Current Trend: Bearish
Sentiment: Overbought (based on 7-period RSI)
Forecast: Bearish
The market is trading around a solid horizontal structure 0.564.
The above observations make me that the market will inevitably achieve 0.561 level.
P.S
Overbought describes a period of time where there has been a significant and consistent upward move in price over a period of time without much pullback.
Like and subscribe and comment my ideas if you enjoy them!

GBPJPY Will Go Lower From Resistance! Sell!
Here is our detailed technical review for GBPJPY.
Time Frame: 1D
Current Trend: Bearish
Sentiment: Overbought (based on 7-period RSI)
Forecast: Bearish
The market is testing a major horizontal structure 203.050.
Taking into consideration the structure & trend analysis, I believe that the market will reach 200.345 level soon.
P.S
Please, note that an oversold/overbought condition can last for a long time, and therefore being oversold/overbought doesn't mean a price rally will come soon, or at all.
Like and subscribe and comment my ideas if you enjoy them!

GBPAUD Will Go Up From Support! Buy!
Take a look at our analysis for GBPAUD.
Time Frame: 8h
Current Trend: Bullish
Sentiment: Oversold (based on 7-period RSI)
Forecast: Bullish
The market is approaching a key horizontal level 2.016.
Considering the today's price action, probabilities will be high to see a movement to 2.041.
P.S
The term oversold refers to a condition where an asset has traded lower in price and has the potential for a price bounce.
Overbought refers to market scenarios where the instrument is traded considerably higher than its fair value. Overvaluation is caused by market sentiments when there is positive news.
Like and subscribe and comment my ideas if you enjoy them!

SILVER SENDS CLEAR BEARISH SIGNALS|SHORT
SILVER SIGNAL
Trade Direction: short
Entry Level: 4,984.0
Target Level: 4,875.1
Stop Loss: 5,056.8
RISK PROFILE
Risk level: medium
Suggested risk: 1%
Timeframe: 1h
Disclosure: I am part of Trade Nation's Influencer program and receive a monthly fee for using their TradingView charts in my analysis.
✅LIKE AND COMMENT MY IDEAS✅

GBP/USD BEARS ARE GAINING STRENGTH|SHORT
GBP/USD SIGNAL
Trade Direction: short
Entry Level: 1.315
Target Level: 1.309
Stop Loss: 1.319
RISK PROFILE
Risk level: medium
Suggested risk: 1%
Timeframe: 3h
Disclosure: I am part of Trade Nation's Influencer program and receive a monthly fee for using their TradingView charts in my analysis.
✅LIKE AND COMMENT MY IDEAS✅

EUR/USD SELLERS WILL DOMINATE THE MARKET|SHORT
Hello, Friends!
Previous week’s green candle means that for us the EUR/USD pair is in the uptrend. And the current movement leg was also up but the resistance line will be hit soon and upper BB band proximity will signal an overbought condition so we will go for a counter-trend short trade with the target being at 1.152.
Disclosure: I am part of Trade Nation's Influencer program and receive a monthly fee for using their TradingView charts in my analysis.
✅LIKE AND COMMENT MY IDEAS✅

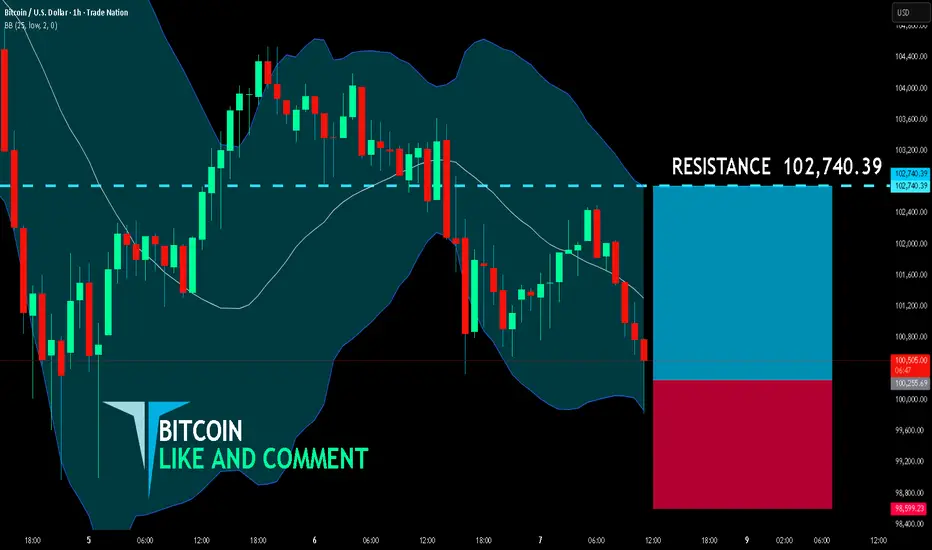
BITCOIN BULLS ARE GAINING STRENGTH|LONG
BITCOIN SIGNAL
Trade Direction: long
Entry Level: 100,255.69
Target Level: 102,740.39
Stop Loss: 98,599.23
RISK PROFILE
Risk level: medium
Suggested risk: 1%
Timeframe: 1h
Disclosure: I am part of Trade Nation's Influencer program and receive a monthly fee for using their TradingView charts in my analysis.
✅LIKE AND COMMENT MY IDEAS✅
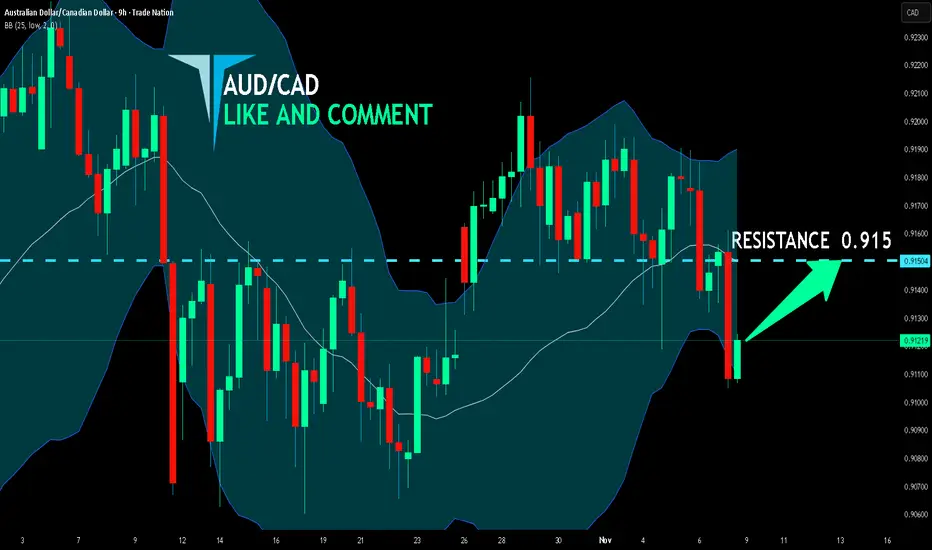
AUD/CAD SENDS CLEAR BULLISH SIGNALS|LONG
Hello, Friends!
We are targeting the 0.915 level area with our long trade on AUD/CAD which is based on the fact that the pair is oversold on the BB band scale and is also approaching a support line below thus going us a good entry option.
Disclosure: I am part of Trade Nation's Influencer program and receive a monthly fee for using their TradingView charts in my analysis.
✅LIKE AND COMMENT MY IDEAS✅
XAUUSD – Bullish structure aiming for 4,218 FVG zone 🎯 Price has completed a clean liquidity sweep above 4,087, confirming that Smart Money has cleared the short-term highs before continuing higher. The market structure has now shifted bullish, showing clear intent to reach the imbalance zone between 4,157–4,218, where an important Bearish FVG / Supply block remains unmitigated.
The 4,017–4,020 Bullish Order Block below current price is the key mitigation area I’m watching for potential re-entry. If price retraces into this zone and confirms with a BOS up, I’ll be looking for longs targeting 4,087 first, then 4,157–4,218 as the main liquidity draw.
As long as price holds above 4,017, the short-term bias stays bullish. A clean break below that would shift focus back to lower liquidity levels near 3,980, where the next accumulation could form.
Overall, this setup reflects a classic liquidity grab → structure shift → FVG draw, and I’ll stay patient to let price confirm from the OB before engaging.✨
This is my personal view based on SMC principles – not financial advice. Like & Follow for daily updates.


Bitcoin Daily Outlook: Support and Resistance in FocusHey Guys,
Looking at Bitcoin on the daily chart, the 105,000 to 98,000 levels are strong support zones. This means that as long as the price does not fall below these levels, a sharp decline in Bitcoin is unlikely.
The price touches these areas, but whales prevent it from breaking lower with strong buying, pushing it back up again.
The 113,000 – 116,000 levels are strong resistance zones.
As long as Bitcoin does not fall below 98,000, my target remains 113,000.
Currently, Bitcoin is trading at 105,887. Once my target is reached, I will provide updates.
Every single like I receive from you is my greatest motivation to share these analyses. I sincerely thank everyone who supports me with their likes.🙏

Crucial level for $BTCFor CRYPTOCAP:BTC I'm watching this $108,000-109,000 level for a reaction
Very bullish if the weekly reclaims and closes above, however we are very early in the week to talk about this scenario

GOLD A Fall Expected! SELL!
My dear subscribers,
This is my opinion on the GOLD next move:
The instrument tests an important psychological level 4078.3
Bias - Bearish
Technical Indicators: Supper Trend gives a precise Bearish signal, while Pivot Point HL predicts price changes and potential reversals in the market.
Target - 4050.7
My Stop Loss - 4094.1
About Used Indicators:
On the subsequent day, trading above the pivot point is thought to indicate ongoing bullish sentiment, while trading below the pivot point indicates bearish sentiment.
Disclosure: I am part of Trade Nation's Influencer program and receive a monthly fee for using their TradingView charts in my analysis.
———————————
WISH YOU ALL LUCK

GBPCAD Will Collapse! SELL!
My dear friends,
Please, find my technical outlook for GBPCAD below:
The price is coiling around a solid key level - 1.8524
Bias - Bearish
Technical Indicators: Pivot Points High anticipates a potential price reversal.
Super trend shows a clear sell, giving a perfect indicators' convergence.
Goal - 1.8464
About Used Indicators:
The pivot point itself is simply the average of the high, low and closing prices from the previous trading day.
Disclosure: I am part of Trade Nation's Influencer program and receive a monthly fee for using their TradingView charts in my analysis.
———————————
WISH YOU ALL LUCK

EURGBP Set To Fall! SELL!
My dear subscribers,
My technical analysis for EURGBP is below:
The price is coiling around a solid key level - 0.8812
Bias - Bearish
Technical Indicators: Pivot Points High anticipates a potential price reversal.
Super trend shows a clear sell, giving a perfect indicators' convergence.
Goal - 0.8800
My Stop Loss - 0.8819
About Used Indicators:
By the very nature of the supertrend indicator, it offers firm support and resistance levels for traders to enter and exit trades. Additionally, it also provides signals for setting stop losses
Disclosure: I am part of Trade Nation's Influencer program and receive a monthly fee for using their TradingView charts in my analysis.
———————————
WISH YOU ALL LUCK

EURUSD Buyers In Panic! SELL!
My dear subscribers,
This is my opinion on the EURUSD next move:
The instrument tests an important psychological level 1.1552
Bias - Bearish
Technical Indicators: Supper Trend gives a precise Bearish signal, while Pivot Point HL predicts price changes and potential reversals in the market.
Target - 1.1510
About Used Indicators:
On the subsequent day, trading above the pivot point is thought to indicate ongoing bullish sentiment, while trading below the pivot point indicates bearish sentiment.
Disclosure: I am part of Trade Nation's Influencer program and receive a monthly fee for using their TradingView charts in my analysis.
———————————
WISH YOU ALL LUCK

XAUUSD | Breakout Above Supply Zone – Targeting 4140–4150 NextGold has successfully broken above the supply zone (4020–4060), confirming a bullish structure shift after multiple rejections in the past week. The clean breakout now opens the path for a liquidity grab toward 4140–4150, aligning with higher timeframe inefficiencies.
Trade Plan:
Entry Zone: Retest of 4040–4060 (previous supply turned demand)
Bias: Bullish continuation
Target 1: 4129 (intra-day liquidity level)
Target 2: 4153 (major HTF resistance)
Invalidation: Below 4020
