GBPUSD Will Go Up! Long!
Please, check our technical outlook for GBPUSD.
Time Frame: 1D
Current Trend: Bullish
Sentiment: Oversold (based on 7-period RSI)
Forecast: Bullish
The market is approaching a significant support area 1.317.
The underlined horizontal cluster clearly indicates a highly probable bullish movement with target 1.345 level.
P.S
We determine oversold/overbought condition with RSI indicator.
When it drops below 30 - the market is considered to be oversold.
When it bounces above 70 - the market is considered to be overbought.
Like and subscribe and comment my ideas if you enjoy them!
Trading

GOLD Under Pressure! SELL!
My dear subscribers,
My technical analysis for GOLD is below:
The price is coiling around a solid key level - 4023.4
Bias - Bearish
Technical Indicators: Pivot Points High anticipates a potential price reversal.
Super trend shows a clear sell, giving a perfect indicators' convergence.
Goal - 3987.3
My Stop Loss - 4041.7
About Used Indicators:
By the very nature of the supertrend indicator, it offers firm support and resistance levels for traders to enter and exit trades. Additionally, it also provides signals for setting stop losses
Disclosure: I am part of Trade Nation's Influencer program and receive a monthly fee for using their TradingView charts in my analysis.
———————————
WISH YOU ALL LUCK

USDCHF Massive Short! SELL!
My dear friends,
Please, find my technical outlook for USDCHF below:
The instrument tests an important psychological level 0.7972
Bias - Bearish
Technical Indicators: Supper Trend gives a precise Bearish signal, while Pivot Point HL predicts price changes and potential reversals in the market.
Target - 0.7958
Recommended Stop Loss - 0.7980
About Used Indicators:
Super-trend indicator is more useful in trending markets where there are clear uptrends and downtrends in price.
Disclosure: I am part of Trade Nation's Influencer program and receive a monthly fee for using their TradingView charts in my analysis.
———————————
WISH YOU ALL LUCK

CHFJPY Set To Grow! BUY!
My dear friends,
CHFJPY looks like it will make a good move, and here are the details:
The market is trading on 190.75 pivot level.
Bias - Bullish
Technical Indicators: Supper Trend generates a clear long signal while Pivot Point HL is currently determining the overall Bullish trend of the market.
Goal - 191.50
About Used Indicators:
Pivot points are a great way to identify areas of support and resistance, but they work best when combined with other kinds of technical analysis
Disclosure: I am part of Trade Nation's Influencer program and receive a monthly fee for using their TradingView charts in my analysis.
———————————
WISH YOU ALL LUCK

AUDCAD Is Going Down! Short!
Here is our detailed technical review for AUDCAD.
Time Frame: 2h
Current Trend: Bearish
Sentiment: Overbought (based on 7-period RSI)
Forecast: Bearish
The market is testing a major horizontal structure 0.920.
Taking into consideration the structure & trend analysis, I believe that the market will reach 0.916 level soon.
P.S
We determine oversold/overbought condition with RSI indicator.
When it drops below 30 - the market is considered to be oversold.
When it bounces above 70 - the market is considered to be overbought.
Like and subscribe and comment my ideas if you enjoy them!

AUD-NZD Bullish Bias! Buy!
Hello,Traders!
AUD-NZD is trading in an uptrend and the pair has swept all liquidity from the demand level below and is showing clear rejection so based on SMC analysis we will be expecting a further bullish move up. Time Frame 4H.
Buy!
Comment and subscribe to help us grow!
Check out other forecasts below too!
Disclosure: I am part of Trade Nation's Influencer program and receive a monthly fee for using their TradingView charts in my analysis.

Trading is the Game of ProbabilitiesMost traders start with one simple goal ➜ to be right all the time
🔲Right about the trend.
🔲Right about the breakout.
🔲Right about the trade.
But here’s the truth - 'the market doesn’t care who’s right'.
↳ Even the best analysis fails sometimes.
↳ Even the weakest setup works sometimes.
Because trading isn’t a test of accuracy, it’s a test of managing what is more probable.
↳ Profitable traders don’t chase perfection.
↳ They focus on risk, reward, and consistency.
We can be wrong 6 times out of 10...
And still make money if our winners are bigger than our losers.
↳ Trading success is not about predicting.
↳ It’s about positioning and managing our trade.
We manage risk when the odds are low.
We maximize reward when the odds are high.
The shift happens when we stop trying to be right...
and start thinking in probabilities.
That’s when we stop gambling and start profitable trading.
Are you playing casino or managing your risk?
Gold price analysis on October 30Fundamental Analysis
Gold prices remained confined within a familiar range, despite the volatility caused by the US Federal Reserve's key monetary policy decision on Wednesday.
Powell noted that policymakers may be more cautious if this prevents them from releasing further reports on jobs and inflation.
Markets are now pricing in a 67.8% chance of the Fed keeping rates unchanged at its December 10 meeting, compared with a 9.1% chance before the Fed's announcement.
President Trump said he hoped to reduce US tariffs on Chinese goods in exchange for Beijing's commitment to curbing fentanyl precursor exports.
Technical Analysis
Gold gained ground in Asia and is eyeing a return to the 4000 handle, which could happen early today as more supportive news comes in. The weekly peak around 4025 will act as a stop for the price increase and act as a correction to find more buying momentum towards 4100. The BUY zone around 4025 is still good, buying power is still accumulating around here. If the trendline around 4025 is broken, Gold will fall deeply to 3865.
Trading signals
BUY GOLD 3925-3923 SL 3920
SELL GOLD 4025-4027 SL 4030
SELL GOLD 4095-4097 SL 4100

Banishing Greed From Trading: Why Wanting More Keeps You LosingGreed is one of the most destructive emotions in trading — it convinces you to ignore your plan, hold too long, and overleverage after a win. In this session, we break down how greed quietly sabotages traders and how to build the mental discipline needed to trade with clarity.
This episode of The Trader’s Therapist explores the psychological roots of greed, how it distorts decision-making, and how professional traders use stoic principles to detach from the outcome and focus purely on execution.
You’ll learn:
The real psychology behind greed and overtrading
How to spot greed before it costs you
Why the “enough” mindset is key to long-term consistency
Practical tools to eliminate emotional trading habits
If you’ve ever turned a winning trade into a loss because you wanted just a little more, this discussion will hit home.
Tags: trading psychology, greed in trading, emotional control, trading discipline, forex mindset, risk management, stoic trading, consistency in trading, mindset for traders, professional trading habits

NZDUSD FREE SIGNAL|LONG|
✅NZDUSD Price bounced from the demand level after a liquidity sweep below the lows, confirming bullish order flow continuation toward the upper range.
—————————
Entry: 0.5762
Stop Loss: 0.5748
Take Profit: 0.5788
Time Frame: 2H
—————————
LONG🚀
✅Like and subscribe to never miss a new idea!✅

CAD-CHF Short From Supply Area! Sell!
Hello,Traders!
CADCHF Price has reacted from a horizontal supply area, showing early signs of distribution. A short-term retracement is expected as liquidity below the recent swing lows gets targeted. Time Frame 2H.
Sell!
Comment and subscribe to help us grow!
Check out other forecasts below too!
Disclosure: I am part of Trade Nation's Influencer program and receive a monthly fee for using their TradingView charts in my analysis.

GBPAUD RISKY LONG|
✅GBPAUD Price created a triple-bottom formation at discount levels, signaling strong bullish rejection from demand. Expect a short-term rally targeting liquidity above the recent highs. Time Frame 2H.
LONG🚀
✅Like and subscribe to never miss a new idea!✅

SBUX Starbucks Corporation Options Ahead of EarningsIf you haven`t bought SBUX ahead of the previous earnings:
Now analyzing the options chain and the chart patterns of SBUX Starbucks Corporation prior to the earnings report this week,
I would consider purchasing the 84usd strike price Puts with
an expiration date of 2025-10-31,
for a premium of approximately $3.20.
If these options prove to be profitable prior to the earnings release, I would sell at least half of them.

EURAUD WILL GROW|LONG|
✅EURAUD Price tapped into the demand zone and showed a bullish reaction, confirming short-term accumulation. Expect continuation higher toward the next liquidity pocket near the target zone. Time Frame 2H.
LONG🚀
✅Like and subscribe to never miss a new idea!✅

EUR-GBP Free Signal! Sell!
Hello,Traders!
EURGBP formed a clean double-top structure at premium pricing and broke below the neckline with momentum, signaling bearish intent. The move targets a key imbalance zone below.
-------------------
Stop Loss: 0.8818
Take Profit: 0.8783
Entry: 0.8804
Time Frame: 1H
-------------------
Sell!
Comment and subscribe to help us grow!
Check out other forecasts below too!
Disclosure: I am part of Trade Nation's Influencer program and receive a monthly fee for using their TradingView charts in my analysis.

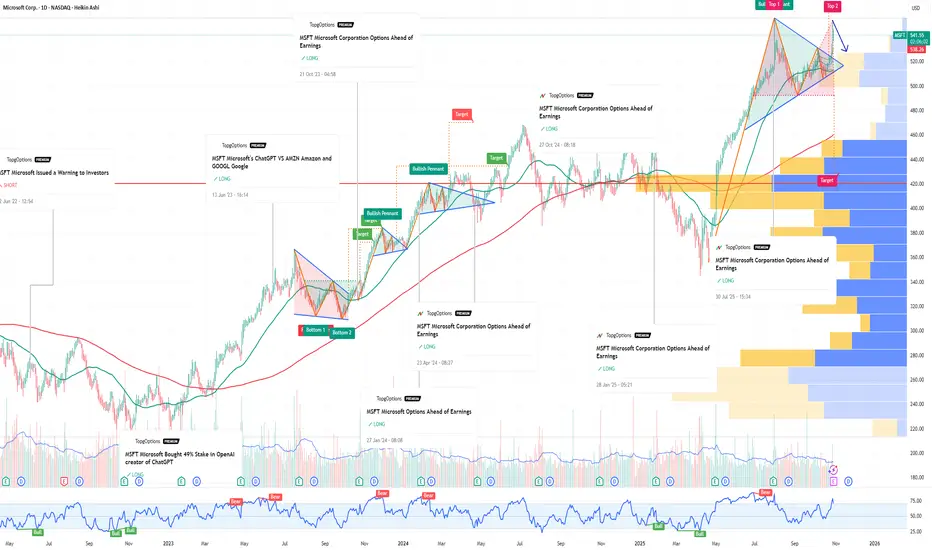
MSFT Microsoft Corporation Options Ahead of EarningsIf you haven`t bought MSFT before the rally:
Now analyzing the options chain and the chart patterns of MSFT Microsoft Corporation prior to the earnings report this week,
I would consider purchasing the 550usd strike price Puts with
an expiration date of 2025-12-19,
for a premium of approximately $26.70.
If these options prove to be profitable prior to the earnings release, I would sell at least half of them.
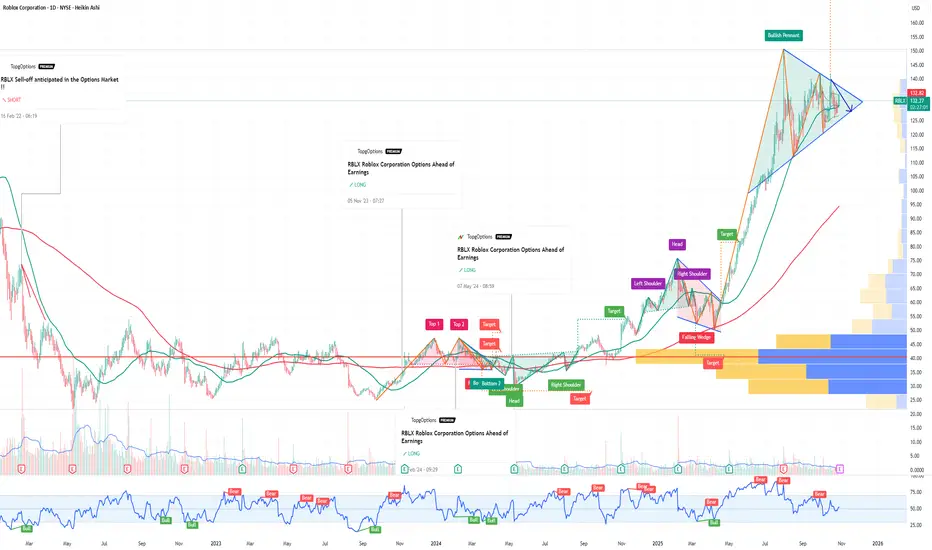
RBLX Roblox Corporation Options Ahead of EarningsIf you haven`t bought RBLX before the rally:
Now analyzing the options chain and the chart patterns of RBLX Roblox Corporation prior to the earnings report this week,
I would consider purchasing the 130usd strike price Puts with
an expiration date of 2026-1-16,
for a premium of approximately $13.80.
If these options prove to be profitable prior to the earnings release, I would sell at least half of them.
BLESS - bullish SET:BLESS - Price analysis: 🟩
Current price = pretty bearish 📉; But Long term uptrend still supporting prices here!
I remember SET:KGEN yesterday pumped 30%+ with the same Price structure/configuration!
Zooming on the M15 - H1 view, I also see a possible bottom forming:
✅Bull div RSI
✅Higly oversell (ichimoku & shinkou head)
✅DownTrend & Uptrend support prices
✅Falling wedge structure?
Overall; I expect to see a bull reaction soon & bottom could be in.📈
At the opposite,
In case of bearish break under 0.3580$ ==> then watch for 0.0330 - 0.03200📉
I bought the dip at 0.03675$ while writting this post! :) #DYOR

ZEC - SAME SETUPCRYPTOCAP:ZEC - Similar view, uptrend channel still holding.
I expect to see a final pump to grab liquidities higher, likely toward 390 - 400$.
Then we could see a strong rejection following by a double top (monthly basis).

LINK - BULLISHCRYPTOCAP:LINK - holding nicely! 📈
100$+ per tokens in 2026 still programmed!
Fundematals are too big. 💎

Solana – Saucer Pattern & Key Resistance in FocusSolana is starting to stand out with notable relative strength versus both Bitcoin and Ethereum, and it's catching my attention this week.
✅ Key Support Holding:
Price recently held firm at the $185–$190 support zone, bouncing with strength and attempting to establish a higher low. If this level holds, it would further confirm the uptrend in place since April.
📉 Corrective Phase Since September:
Despite the pullback, the larger trend structure remains bullish. A break above the September high is still needed to confirm trend continuation.
🔵 Multi-Month Saucer Formation:
A rounded base is developing on the daily chart—a classic saucer bottom. If confirmed, this pattern points to major upside potential, with a projected move possibly targeting $500 over time.
⚠️ Watch This Zone Closely:
The $250–$260 resistance area is the key overhead level to clear. A decisive breakout here could trigger a strong rally and confirm the saucer breakout.
📌 Summary:
Solana is showing resilience, building a bullish structure, and forming a significant base. If momentum builds above $260, bulls may take control in a big way.

CRUDE OIL Local Short! Sell!
Hello,Traders!
CRUDE OIL is reacting from the horizontal supply area after liquidity above previous highs was taken. Expect continuation to the downside as the market rebalances toward the target level.
Sell!
Comment and subscribe to help us grow!
Check out other forecasts below too!
Disclosure: I am part of Trade Nation's Influencer program and receive a monthly fee for using their TradingView charts in my analysis.

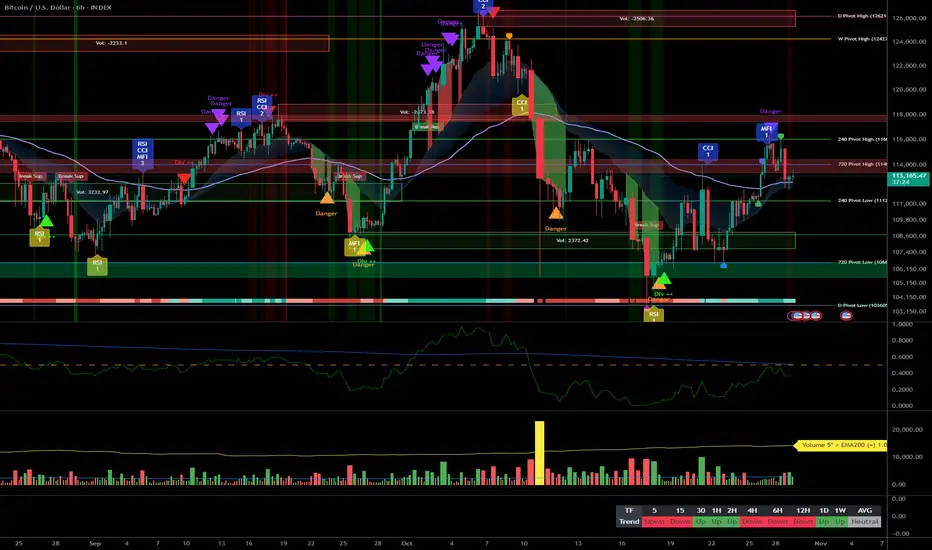
BTC pinned below 116k: FOMC to break the range__________________________________________________________________________________
Market Overview
__________________________________________________________________________________
BTC is coiling into the FOMC: capped at 115–116k and defended at 112.7k, with volatility set to expand on the trigger.
Momentum: Range with a tactical bearish tilt 📉 — compression below 115–116k, dip buyers active at 112.7k.
Key levels:
Resistances (HTF) : 114.9–115.1k (1D/4H), 116.0k (1D/12H), 117.9k (1D extension).
Supports (HTF) : 112.7k (1D/12H), 111.7k (HTF), 109.05–109.07k (2H/6H/1D cluster).
Volumes: Moderate on 1D; “normal” intraday; “very high” on 30m during impulses.
Multi-timeframe signals: 12H Down while 1D is Up — transitional range; a confirmed break above 115–116k would align TFs, otherwise risk of a 112.7k → 109k sweep.
Risk On / Risk Off Indicator: NEUTRAL SELL — validates caution and counters any sustained push until 115–116k is reclaimed; favors edge trading.
__________________________________________________________________________________
Trading Playbook
__________________________________________________________________________________
Strategy: event‑driven range with a risk‑off tilt — trade the edges with confirmation.
Global bias: NEUTRAL SELL below 115.1–116k; bias invalidated on daily close > 116k .
Opportunities:
- Breakout buy: Reclaim/close above 115.1–116k with volume, target 121–122k.
- Buy the dip: Confirmed (≥2H) bullish rejection at 109.05–109.07k, back to 112.7k then 114.9–115.1k.
- Tactical sell: Clear 114.9–116k rejection (2H/4H bearish close), aim 113.0k then 112.7k, runner 111.7k.
Risk zones / invalidations: A close < 111.7k opens the 109k cluster; a ≥2H close < 109k invalidates dip‑buys.
Macro catalysts (Twitter, Perplexity, news): FOMC cut (25 bps) with possible QT changes; options crowding = whipsaw risk; spot ETF inflows = mild cushion.
Action plan:
Entry: confirmed post‑breakout retest 116,050–116,200.
Stop: below 114,900.
TP1: 117,900; TP2: 121,000–122,000; TP3: let it run if extends.
R/R: approximately 1:2 to 1:3 depending on fill.
__________________________________________________________________________________
Multi-Timeframe Insights
__________________________________________________________________________________
Overall, 1D remains constructive but intraday groups lean NEUTRAL SELL, keeping price in an event‑driven range.
12H/6H/4H/2H/1H/30m: NEUTRAL SELL with lower highs below 115–116k; supports at 112.7k then 111.7k; highest‑quality demand at 109.05–109.07k, deeper near ~107k.
1D: Still constructive while 109k holds; a 1D close above 116k would align TFs and open 121–122k (potential squeeze).
Major divergence: 12H Down vs 1D Up — a transitional signal; 115–116k is the decision band for trend alignment or a rotation toward 109k.
__________________________________________________________________________________
Macro & On-Chain Drivers
__________________________________________________________________________________
FOMC‑led macro should decide the range resolution and drive the next volatility expansion.
Macro events: 25 bps cut expected with QT end/slowdown discussed — direct risk‑on/off catalyst; options are crowded long → whipsaw risk; equities at highs keep the tone constructive but fragile around the event.
Bitcoin analysis: US spot ETF inflows add a small downside cushion; corporate bids and stablecoin mints help demand; technically, >116k unlocks 121–122k, losing 111k ups odds of a 109k flush.
On-chain data: Modest whale prints; stablecoin mints increasing; no clear systemic distribution — tactical support rather than a trigger.
Expected impact: Technical bias stays NEUTRAL SELL until 115–116k is reclaimed; the post‑FOMC reaction should confirm either a squeeze to 121–122k or a liquidity hunt toward 109k.
__________________________________________________________________________________
Key Takeaways
__________________________________________________________________________________
BTC is in a catalyst‑driven range under a major resistance shelf.
- Overall trend: neutral with a bearish tilt while 115–116k caps.
- Most relevant setup: confirmed breakout above 116k toward 121–122k; alternative is a confirmed dip‑buy at 109.05–109.07k.
- One macro factor: FOMC decision and QT guidance can flip risk tone quickly.
Stay nimble: trade confirmation, not guesses — let the reaction lead.