AUDCHF: Intraday Bullish Signal 🇦🇺🇨🇭
Quick update for AUDCHF.
Earlier, we spotted a confirmed breakout of a key
daily horizontal resistance.
Retesting the broken structure, the price successfully
violated a resistance line of a falling parallel channel on an hourly time frame.
It suggests a strong buying interest.
We can expect a move up now at least to 0.5264
❤️Please, support my work with like, thank you!❤️
I am part of Trade Nation's Influencer program and receive a monthly fee for using their TradingView charts in my analysis.
Trading

LiamTrading - XAUUSD: Prospect of $5,000 USD and Priority BUY...LiamTrading - XAUUSD: Prospect of $5,000 USD and Priority BUY Strategy at POC $3973
Hello traders community,
Gold is positioned between an extremely optimistic long-term outlook (forecast of $5,000 USD in the next 12-18 months by Bank of America) and short-term technical adjustments.
Although Gold has broken the upward trendline, a sustainable downward trend has not been confirmed.
BUY positions are still prioritized!
🔥 LONG-TERM CONTEXT & INFLATION
Long-Term Driver: Gold prices adjusted for inflation have DOUBLED over the past 4 years.
Highlight: Gold reinforces its role as an anti-inflation asset as real prices soar to all-time highs.
📊 DETAILED TRADING PLAN (ACTION PLAN)
Strategy: Buy at POC Zone to leverage liquidity advantage.
🟢 BUY Scenario (BUY Primary) - Buy at High Value Zone
Logic: The $3973 - 3975$ zone is right above the Buy POC (highest value zone).
Entry (BUY): $3973 - 3975$
SL: $3968$
TP1: $3988$ | TP2: $4000
Buy Target 2: Buy when price retests the trendline around $4002$.
🔴 SELL Scenario (SELL Scalping) - Preemptive strike at resistance zone
Entry (SELL): $4032 - 4034$
SL: $4040$
TP1: $4022$ | TP2: $4015
📌 SUMMARY & DISCIPLINE (Liam's Note)With the $5,000 USD forecast and inflation factors, the risk of SELL is increasing.
Focus on BUY at POC $3973$ and absolute SL.
Trade responsibly and with discipline!

#038: SHORT Investing Opportunity on NZD/USD
The NZD/USD exchange rate is exhibiting behavior that warrants attention from institutional traders. Hello, I'm Andrea Russo, an independent Forex trader and prop trader with $200,000 in capital under management. Thank you in advance for your time.
After a consolidation phase characterized by progressively higher lows, the market has reached a technical area that historically represents a decision point for directional flow.
In recent sessions, price action has shown a slowdown in the bullish momentum, with small-bodied candles and clear upper wicks, a sign of absorption of buying pressure. At the same time, an increase in intraday volatility has been observed, typical of phases in which liquidity begins to change sides.
Fundamentally, the environment remains fragile for the New Zealand dollar. Expectations of a more accommodative monetary policy from the RBNZ, combined with mixed macroeconomic data, are keeping medium-term sentiment anchored to a cautious outlook. The US dollar, while not showing particular strength, continues to benefit from the rate differential and demand for hedging in times of uncertainty.
From a technical perspective, recent price behavior suggests that the market is seeking liquidity near resistance areas, where pending orders and potential profit-taking by those who have been long in previous weeks are concentrated. This is often where the institutional transition between accumulation and distribution occurs, a prelude to broader directional movements.
Professional traders are closely monitoring the price reaction in this range: a confirmed rejection of the upper range, accompanied by consistent volume, could be an early sign of a return to bearish interest.

#039: SHORT Investing Opportunity on NZD/CHF
The NZD/CHF exchange rate is in a particularly interesting technical phase after the strong bullish expansion of recent weeks. Hello, I'm Andrea Russo, an independent Forex trader and prop trader with $200,000 in capital under management. Thank you in advance for your time.
The market has begun to show signs of structural weakness, with a sequence of lower highs and gradually declining volumes, while institutional flow suggests profit-taking at the top of the range.
The 4-hour chart shows a clear break of the short-term ascending trendline, accompanied by a loss of momentum in commodity currencies. The Swiss franc, on the other hand, is showing increasing relative strength, supported by defensive flows and gradually increasing volatility.
The current area represents a key point: the price is testing the volume equilibrium zone, where buy orders had accumulated in the past. A close below this level would open the door to a deeper bearish extension, while any bullish reactions at this range would be considered simple technical pullbacks until the market structure shows a true change in direction.
Momentum indicators confirm increasing bearish pressure, with negative divergences already active and cyclicality favorable to a further downturn.
On the intermarket level, the franc tends to benefit from the current risk-averse environment, while the New Zealand dollar remains exposed to more fragile sentiment linked to the agricultural sector and Asian demand dynamics.
Building Rock-Solid Confidence: The Trader’s Unshakable EdgeConfidence is the foundation of every great trader — not because it guarantees wins, but because it guarantees consistency. In this session, we break down the psychology of self-belief and how to build confidence that doesn’t crumble when the market tests you.
Learn why confidence isn’t built from profits but from disciplined execution. We’ll cover how to stop second-guessing your trades, rebuild trust in your system, and detach your self-worth from your results. This episode shows you how professional traders use repetition, reflection, and recovery to stay calm, clear, and confident — even in drawdowns.
You’ll learn:
The difference between ego and true confidence
How to rebuild trust in your trading plan
Why the market manipulates your confidence and how to protect it
The 3-step framework for building self-trust in trading
If you’ve ever felt anxious before pressing “Buy” or “Sell,” or you constantly question your setups, this discussion will help you develop the rock-solid mindset needed to execute with precision and confidence.
Tags: trading psychology, trading confidence, self-belief for traders, trading mindset, forex psychology, discipline in trading, consistency in trading, emotional control, trader development, performance mindset

How to enter a successful futures tradeDrop everything and let me show you how to enter a successful long position with the lowest possible risk.
You need to understand that the market maker usually acts against us at major support areas on the chart — like the 100 EMA, 0.618 Fibonacci level, or a trendline.
To make this clearer, let’s take TAO as an example and I’ll explain why.
TAO has strong momentum and a large market cap,
so don’t apply what I’m about to say to meme coins, for example.
Now let’s go step by step on how to enter a futures position after choosing the coin 👇
1. First, wait for a bullish pattern to form — like a triangle — and for the coin to break it upwards with increasing long momentum.
2. The price will then retest the trendline, encouraging people to enter with larger positions, and those who missed the first breakout will likely place buy orders at the retest zone.
3. Then, the market surprises them — it drops back inside the triangle, giving a small bounce at the lower side.
4. But it doesn’t stop there — it continues dropping, breaking below the triangle and closing below the 100 EMA on the 4-hour chart.
This makes you panic and close your long position.
Others start entering shorts thinking it’s a real breakdown.
5. That’s when the market reverses sharply upward,
trapping short traders in losses,
while long traders who exited too early also lose.
In the end, only those who placed buy orders slightly below the strong support level (not directly on it, like under the 100 EMA) — and of course the market maker — end up winning.
So basically, the long traders lose, the short traders lose,
and only a small percentage of smart traders and the market maker win.
Small things to pay attention to 👇
-Your entry point should be slightly below the support, not too far below it.
(That support could be the 100 EMA, below the triangle pattern, or the 0.618 Fibonacci level, as we mentioned.)
-Don’t use high leverage — x5 should be your maximum.
-Place your stop loss 5% below your entry zone,
which equals about 25% loss if you’re using x5 leverage.
And with that, you’ve got yourself a long setup with over a 90% success rate,
and you can apply the same logic in reverse when taking a short position.
Best Regards:
Ceciliones🎯
NZDCHF: H1 ATL BreakKey observations across the D1 and H1 timeframes
D1
Pair is in a clean downtrend
Right now, the bearish bar hasn't closed below the low of the bullish bar, which is a small point of concern for selling strength
H1
Price is crossing below a very structural ATL
EMA bands haven't crossed over yet

ETH/USDT: Price Decline Warning, Caution for Buy Opportunities!The ETH/USDT pair is currently facing clear downward pressure after failing to break through the strong resistance at 4,150.00. The 4-hour chart shows that Ethereum is moving in a short-term downtrend, with prices heading towards the important support level of 3,780.00. The strong rejection from this area indicates that the current market sentiment is leaning towards selling.
The market's cash flow also reflects short-term distribution, and the RSI indicator shows that ETH has previously entered overbought territory, and may continue to correct downward. These factors suggest that Ethereum could continue to face selling pressure, especially if the support levels are not strong enough to hold the price.
Impact of Recent News:
1. Australia's Core Inflation Data Rises Sharply: Australia's core inflation index increased by 1.0% in Q3, exceeding the forecast of 0.8%. This reduces expectations of a near-term rate cut and could affect ETH/USDT if the USD strengthens.
2. Expectations on U.S. Federal Reserve's Monetary Policy: The market expects the Fed to maintain high interest rates, which could strengthen the USD and put downward pressure on ETH/USDT.
Conclusion: Given the current downtrend and pressure from technical indicators, ETH/USDT is likely to continue decreasing over the next 48 hours. However, traders need to be cautious and closely monitor the support level at 3,780.00. If the price shows strong signs of recovery from here, it could present a good opportunity to enter the market.

Gold Price Analysis October 31🟡 XAUUSD Update
After a correction period, gold has formed a double bottom pattern, showing a clear reversal signal. The price has just broken out of the important resistance zone of 4026, reaffirming the main uptrend. Currently, the bullish momentum is still being consolidated, with the next target around the 4141 area.
Technically, if the buying force is strong enough to push the price above 4141 – 4126, the uptrend will continue to expand, heading towards higher peaks in the coming time. The fundamental data is also supporting this bullish momentum.
📈 Trading Strategy:
Prioritize BUYing with the trend
BUY Trigger: When the price breaks the resistance zone of 4141–4126
BUY Now
🎯 Target: 4141 and above

AUDCAD FREE SIGNAL|LONG|
✅AUDCAD reacted from a clean demand level with strong bullish intent. Liquidity beneath previous lows has been swept, suggesting a possible continuation toward the next imbalance zone.
—————————
Entry: 0.9162
Stop Loss: 0.9145
Take Profit: 0.9182
Time Frame: 3H
—————————
LONG🚀
✅Like and subscribe to never miss a new idea!✅

NATGAS CORRECTION AHEAD|SHORT|
✅NATGAS after rallying into a high-timeframe supply level, price shows signs of exhaustion and potential mitigation before retracement. Liquidity sits below the recent swing lows. Time Frame 5H.
SHORT🔥
✅Like and subscribe to never miss a new idea!✅

GOLD Free Signal! Sell!
Hello,Traders!
GOLD Price has reached a horizontal supply area after a corrective move upward. Bears are likely to step in, targeting the previous low for liquidity.
-------------------
Stop Loss: 4,052$
Take Profit: 3,997$
Entry: 4,027$
Time Frame: 2H
Setup Risk: High
-------------------
Sell!
Comment and subscribe to help us grow!
Check out other forecasts below too!
Disclosure: I am part of Trade Nation's Influencer program and receive a monthly fee for using their TradingView charts in my analysis.

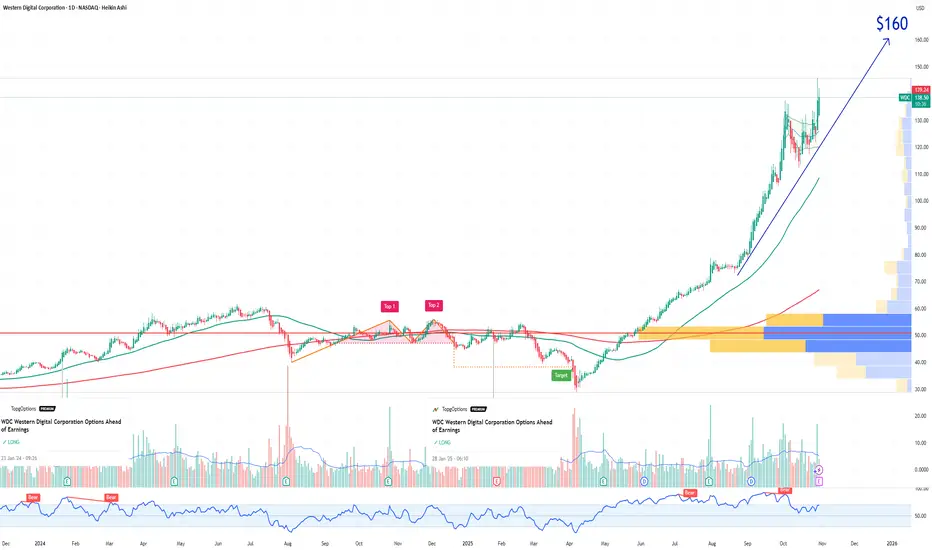
WDC Western Digital Corporation Options Ahead of EarningsIf you haven`t bought WDC before the rally:
Now analyzing the options chain and the chart patterns of WDC Western Digital Corporation prior to the earnings report this week,
I would consider purchasing the 160usd strike price Calls with
an expiration date of 2025-11-21,
for a premium of approximately $4.35.
If these options prove to be profitable prior to the earnings release, I would sell at least half of them.
NZD-USD Bearish Breakout! Sell!
Hello,Traders!
NZDUSD broke below its bearish flag pattern, confirming a potential continuation to the downside. The next liquidity target sits near the lower support zone. Time Frame 4H.
Sell!
Comment and subscribe to help us grow!
Check out other forecasts below too!
Disclosure: I am part of Trade Nation's Influencer program and receive a monthly fee for using their TradingView charts in my analysis.

How to Analyze Your Trading Performance ScientificallyBy Skeptic – Founder of Skeptic Lab
Most traders know how to analyze charts — but few know how to analyze themselves.
A professional trader doesn’t just look at last month’s profit or loss; they examine consistency , volatility , and long-term stability.
Earlier today, as part of my usual routine, I was reviewing my trading performance and reflecting on my recent results. That’s when I decided to share my analysis process with you :) — a framework built from personal study and research that might help others turn raw data into real improvement.
In this tutorial , we’ll walk through a data-driven framework to evaluate your trading performance like a portfolio manager — using metrics such as cumulative return, volatility, Sharpe ratio, and trend analysis.
1. Data Collection: Turning Trades into Monthly Returns
Instead of focusing on single trades, record your monthly returns in percentage terms.
It can look as simple as this:
This structure helps you see the bigger behavioral pattern behind your system — not just isolated results.
“If you can’t describe what you’re doing as a process, you don’t know what you’re doing.” – W. Edwards Deming
2. Cumulative Return: The Power of Compounding
Your total return isn’t the average of each month — it’s compounded over time:
This shows whether your trading system has truly grown across time, not just fluctuated.
A positive total means your system is resilient; a negative one signals structural issues.
3. Key Statistical Metrics
Once your data is ready, calculate the following metrics — the backbone of every professional performance review:
4. Coefficient of Variation (CV) – Stability Indicator
A CV below 1 implies your returns are stable and predictable.
Above 1.5 suggests your system’s risk-to-reward profile is unstable — and may need adjustment.
5. Sharpe-like Ratio – Measuring Efficiency
Assuming a zero risk-free rate, the Sharpe ratio measures how much return you generate per unit of volatility:
Sharpe > 0.5 → healthy performance
Sharpe > 1 → professional-level consistency
Sharpe < 0.3 → the system needs review
“It’s not about being right, it’s about being consistent.” – Mark Douglas
6. Trend Analysis – Detecting Growth or Decay
Run a simple linear regression between time (month number) and return.
Positive slope: system improving
Negative slope: decline in edge or discipline
Positive slope with high variance: profitable but unstable behavior
Combining this with the Sharpe ratio gives a complete health check of your strategy.
📝Summary Table
Data without action is noise.
Use these insights to correct weaknesses and scale strengths:
Identified Issue: High volatility
→ Practical Fix: Reduce position size in range-bound markets
Identified Issue: Consecutive drawdowns
→ Practical Fix: Add trailing stops or break-even adjustments
Identified Issue: Low average return
→ Practical Fix: Reassess position sizing or strategy fit
Identified Issue: Overconfidence after wins
→ Practical Fix: Apply daily or weekly risk caps
🧩 Final Thoughts
Analyzing your performance is not just about profits — it’s about understanding your patterns .
By measuring Sharpe, CV, and trend, you can answer three crucial questions:
Is my growth consistent or random?
Is my risk proportional to my return?
Can I replicate this performance?
If the answer is yes, you’re not just improving your system —
you’re evolving as a trader :)
🩵If you found this tutorial helpful, give it a boost and share it with your fellow traders. Let’s grow together, not alone!
Happy trading, and see you in the next tutorial ! 💪🔥
GBPJPY Buyers In Panic! SELL!
My dear subscribers,
GBPJPY looks like it will make a good move, and here are the details:
The market is trading on 202.70 pivot level.
Bias - Bearish
My Stop Loss - 203.05
Technical Indicators: Both Super Trend & Pivot HL indicate a highly probable Bearish continuation.
Target - 202.02
About Used Indicators:
The average true range (ATR) plays an important role in 'Supertrend' as the indicator uses ATR to calculate its value. The ATR indicator signals the degree of price volatility.
Disclosure: I am part of Trade Nation's Influencer program and receive a monthly fee for using their TradingView charts in my analysis.
———————————
WISH YOU ALL LUCK

Globalstar (GSAT) — Expanding Reach in the Satellite IoT MarketCompany Overview:
Globalstar, Inc. NASDAQ:GSAT is a leading satellite communications provider, offering mobile voice, data, and IoT services through its low-Earth orbit (LEO) satellite network. The company continues to build a strong position in the fast-growing global connectivity and IoT space.
Key Catalysts:
IoT Innovation: Launch of the RM200M two-way IoT module (Oct 21, 2025) strengthened GSAT’s position in the $4.9B satellite IoT market projected by 2030, triggering a 4.1% stock increase post-announcement.
Infrastructure Expansion: New ground stations in Alaska and a $9M Estonian expansion enhance global coverage and scalability, especially for IoT and direct-to-device solutions.
Revenue Visibility: Long-term contracts totaling $60M, including a major partnership powering Apple’s iPhone SOS feature, ensure steady cash flow and strategic market relevance.
Investment Outlook:
Bullish above: $38.00–$39.00
Upside target: $67.00–$68.00, driven by IoT growth, network expansion, and strong enterprise partnerships.
📢 GSAT — Leveraging LEO technology to power the next wave of global IoT and connectivity.
#GSAT #SatelliteCommunications #IoT #LEO #AppleSOS #SpaceTech #Investing

LiamTrading - XAUUSD: FED IMPACT AFTER FOMC NEWSLiamTrading - XAUUSD: FED IMPACT AFTER FOMC NEWS
Hello Traders Community,
The Fed’s latest rate decision has sent shockwaves through the market — Gold and BTC dropped sharply while the USD regained strength. The Fed cut interest rates for the second time this year, bringing them down to 3.75%–4%, but the announcement to end Quantitative Tightening (QT) on Dec 1, 2025, is the real game-changer.
Now’s the time to stay calm, analyze the price structure, and trade according to plan.
📰 MACRO ANALYSIS: THE DOUBLE IMPACT FROM THE FED
Rate Cuts (Supportive for Gold): The second rate cut should have boosted Gold, but much of this move was already priced in by the market.
Ending QT (Strengthening the USD): The announcement of ending QT in December sends a strong signal — the Fed is rebalancing its policy stance. The USD’s rebound right after the news added selling pressure to Gold and BTC.
Market Reality: Gold dropped sharply after the announcement and is now consolidating within a wide range. During the Asian session today, Gold moved nearly 70 points before correcting again.
📊 TECHNICAL ANALYSIS: WIDE RANGE & BULLISH STRUCTURE
Based on the current XAUUSD market structure:
Structure: Gold is trading in a wide sideways range, but a bullish structure is gradually forming, showing signs of a sustainable Dow pattern.
Strategy: Trade both directions to capture strong volatility — SELL at key liquidity resistance zones and BUY at deep liquidity support areas.
🎯 DETAILED TRADING PLAN (ACTION PLAN)
🔴 SELL Scenario (Continuation Trade) – Sell at Short-term Resistance
Entry: $4005
Stop Loss (SL): $4013
Take Profit (TP): TP1: $3990 | TP2: $3975 | TP3: $3960 | TP4: $3943
🟢 BUY Scenario (Recovery Trade) – Buy at Deep Liquidity Support
Entry: $3907−$3909
Stop Loss (SL): $3902
Take Profit (TP): TP1: $3933 | TP2: $3954 | TP3: $3970 | TP4: $3999
The Fed’s decision has reshaped the short-term market landscape. The 70-point swing highlights Gold’s high liquidity — and its high risk.
LiamTrading’s Advice: The bullish structure is building on lower timeframes. Be patient and wait for the ideal BUY zone at $3907 to catch the next potential recovery leg. Strict risk management is essential in this post-news phase.
Are you ready to take advantage of this 70-point range? LIKE 👍 & COMMENT if you are!

BITCOIN LONG FROM SUPPORT
BITCOIN SIGNAL
Trade Direction: long
Entry Level: 109,971.94
Target Level: 115,314.48
Stop Loss: 106,410.24
RISK PROFILE
Risk level: medium
Suggested risk: 1%
Timeframe: 2h
Disclosure: I am part of Trade Nation's Influencer program and receive a monthly fee for using their TradingView charts in my analysis.
✅LIKE AND COMMENT MY IDEAS✅

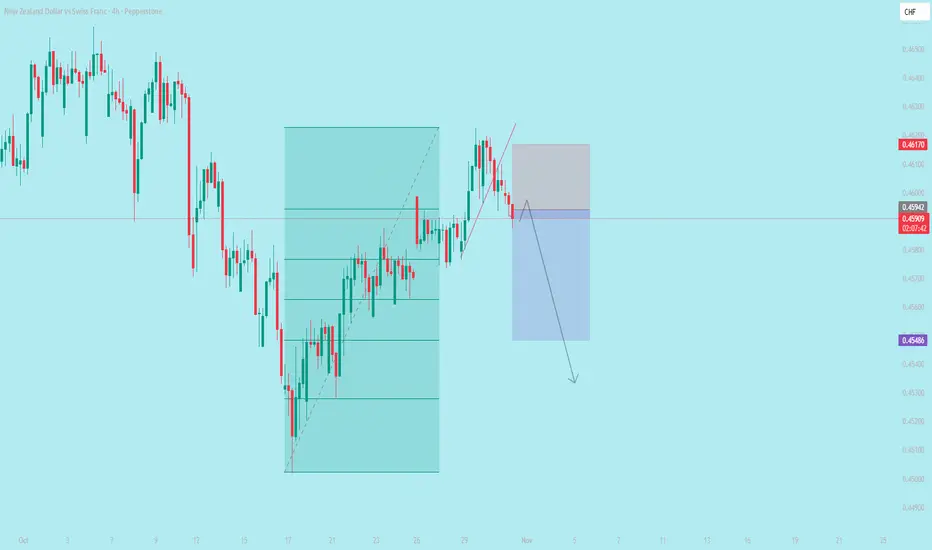
NZD/CHF BEARS WILL DOMINATE THE MARKET|SHORT
NZD/CHF SIGNAL
Trade Direction: short
Entry Level: 0.460
Target Level: 0.450
Stop Loss: 0.467
RISK PROFILE
Risk level: medium
Suggested risk: 1%
Timeframe: 12h
Disclosure: I am part of Trade Nation's Influencer program and receive a monthly fee for using their TradingView charts in my analysis.
✅LIKE AND COMMENT MY IDEAS✅

AUD/NZD SENDS CLEAR BEARISH SIGNALS|SHORT
Hello, Friends!
The BB upper band is nearby so AUD-NZD is in the overbought territory. Thus, despite the uptrend on the 1W timeframe I think that we will see a bearish reaction from the resistance line above and a move down towards the target at around 1.132.
Disclosure: I am part of Trade Nation's Influencer program and receive a monthly fee for using their TradingView charts in my analysis.
✅LIKE AND COMMENT MY IDEAS✅

CAD/CHF BEARS ARE GAINING STRENGTH|SHORT
Hello, Friends!
Bearish trend on CAD/CHF, defined by the red colour of the last week candle combined with the fact the pair is overbought based on the BB upper band proximity, makes me expect a bearish rebound from the resistance line above and a retest of the local target below at 0.566.
Disclosure: I am part of Trade Nation's Influencer program and receive a monthly fee for using their TradingView charts in my analysis.
✅LIKE AND COMMENT MY IDEAS✅

EURUSD What Next? BUY!
My dear followers,
I analysed this chart on EURUSD and concluded the following:
The market is trading on 1.1608 pivot level.
Bias - Bullish
Technical Indicators: Both Super Trend & Pivot HL indicate a highly probable Bullish continuation.
Target - 1.1636
About Used Indicators:
A super-trend indicator is plotted on either above or below the closing price to signal a buy or sell. The indicator changes color, based on whether or not you should be buying. If the super-trend indicator moves below the closing price, the indicator turns green, and it signals an entry point or points to buy.
Disclosure: I am part of Trade Nation's Influencer program and receive a monthly fee for using their TradingView charts in my analysis.
———————————
WISH YOU ALL LUCK
