GBPJPY BULLISH BIAS|LONG|
✅GBPJPY after mitigating the key demand level, price shows bullish order flow and imbalance fill. A potential rally may target the next external liquidity zone above recent swing highs. Time Frame 4H.
LONG🚀
✅Like and subscribe to never miss a new idea!✅
Trading

GBP-AUD Bullish Breakout! Buy!
Hello,Traders!
GBPAUD broke structure after a clean liquidity sweep and reclaimed the demand zone. Bullish displacement confirms smart money accumulation targeting external liquidity above. Time Frame 5H.
Buy!
Comment and subscribe to help us grow!
Check out other forecasts below too!
Disclosure: I am part of Trade Nation's Influencer program and receive a monthly fee for using their TradingView charts in my analysis.

EURJPY My Opinion! SELL!
My dear friends,
EURJPY looks like it will make a good move, and here are the details:
The market is trading on 177.35pivot level.
Bias - Bearish
Technical Indicators: Supper Trend generates a clear short signal while Pivot Point HL is currently determining the overall Bearish trend of the market.
Goal - 176.90
About Used Indicators:
Pivot points are a great way to identify areas of support and resistance, but they work best when combined with other kinds of technical analysis
Disclosure: I am part of Trade Nation's Influencer program and receive a monthly fee for using their TradingView charts in my analysis.
———————————
WISH YOU ALL LUCK

USDCAD Technical Analysis! BUY!
My dear friends,
Please, find my technical outlook for USDCAD below:
The instrument tests an important psychological level 1.4071
Bias - Bullish
Technical Indicators: Supper Trend gives a precise Bullish signal, while Pivot Point HL predicts price changes and potential reversals in the market.
Target - 1.4090
Recommended Stop Loss - 1.4054
About Used Indicators:
Super-trend indicator is more useful in trending markets where there are clear uptrends and downtrends in price.
Disclosure: I am part of Trade Nation's Influencer program and receive a monthly fee for using their TradingView charts in my analysis.
———————————
WISH YOU ALL LUCK

GRASS - ANOTHER TP4 HIT!! In long or in short? I don't care, my Froggy Guru technical outlook skills is pure experience 🐸🔥
Yesterday's setup:
#GRASS -->my TP4 HIT ✅🔥
-12% ✅

US30: Strong Growth Ahead! Long!
My dear friends,
Today we will analyse US30 together☺️
The recent price action suggests a shift in mid-term momentum. A break above the current local range around 46,699.24 will confirm the new direction upwards with the target being the next key level of 46,842.98 and a reconvened placement of a stop-loss beyond the range.
❤️Sending you lots of Love and Hugs❤️

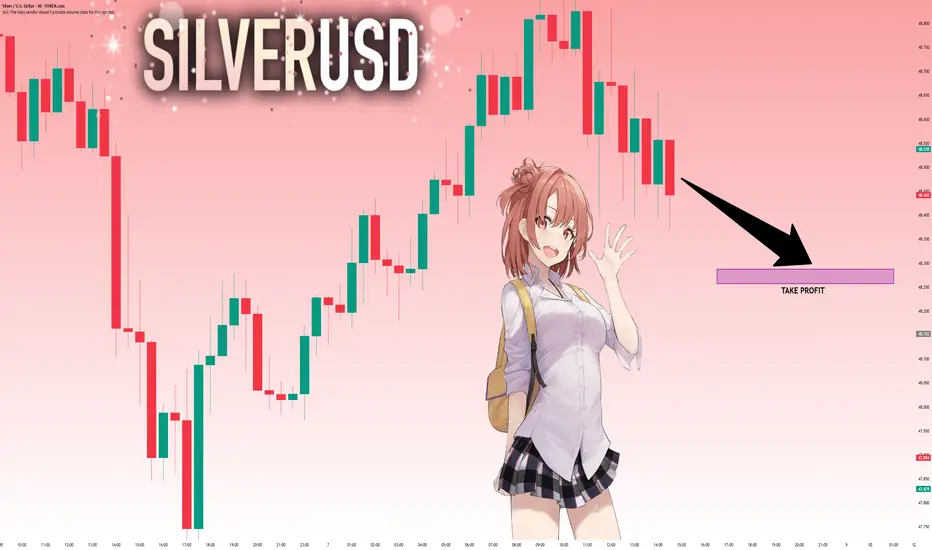
SILVER: Will Go Down! Short!
My dear friends,
Today we will analyse SILVER together☺️
The in-trend continuation seems likely as the current long-term trend appears to be strong, and price is holding below a key level of 48.433 So a bearish continuation seems plausible, targeting the next low. We should enter on confirmation, and place a stop-loss beyond the recent swing level.
❤️Sending you lots of Love and Hugs❤️
GOLD: The Market Is Looking Down! Short!
My dear friends,
Today we will analyse GOLD together☺️
The market is at an inflection zone and price has now reached an area around 4,005.00 where previous reversals or breakouts have occurred.And a price reaction that we are seeing on multiple timeframes here could signal the next move down so we can enter on confirmation, and target the next key level of 3,992.90.Stop-loss is recommended beyond the inflection zone.
❤️Sending you lots of Love and Hugs❤️

Robinhood (HOOD) | Explosive Q3 & Bullish Setup📊 Fundamental Highlights – Q3 2025
Robinhood NASDAQ:HOOD just posted blowout earnings for Q3:
🔼 Revenue up 100% YoY to $1.27B
💥 EPS up 259% YoY
📈 Total platform assets surged 119% to $333B
💸 Transaction-based revenues +129%, led by crypto, options & equities
💰 Net interest income +66% to $456M
🏦 Cash reserves > $4B
👑 Robinhood Gold users up 77% YoY to 3.9M
They also hinted at adding Bitcoin to the balance sheet, which could fuel major sentiment momentum in the coming quarters.
📐 Technical Setup
HOOD is currently trading above strong support near $113–$118. Price is consolidating in a healthy zone following the earnings spike.
🟢 Trade Idea
Entry Zone: $113–$118 (watch for reaction near support)
Targets (TP): $137 and $153
Stop Loss (SL): $105
Risk-reward is attractive with strong fundamentals and growing institutional interest. If markets hold, this could be a runner.
🔔 Watchlist Material – Stay alert for breakout confirmation or Bitcoin-related news from HOOD in upcoming quarters.

EURUSD: Strong Bullish Sentiment! Long!
My dear friends,
Today we will analyse EURUSD together☺️
The price is near a wide key level
and the pair is approaching a significant decision level of 1.15719 Therefore, a strong bullish reaction here could determine the next move up.We will watch for a confirmation candle, and then target the next key level of 1.15903.Recommend Stop-loss is beyond the current level.
❤️Sending you lots of Love and Hugs❤️

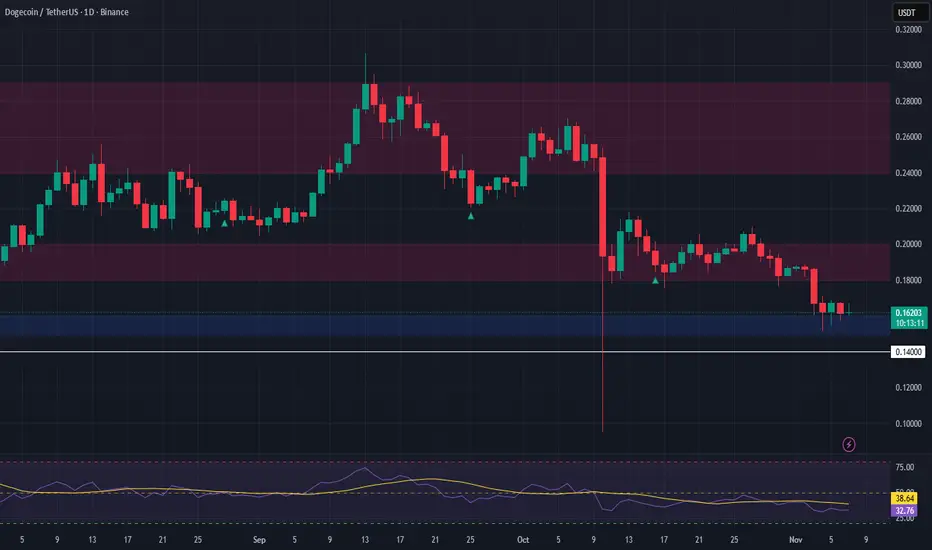
DOGE Testing Key Support – Watching for ConfirmationDOGE is currently testing a critical support zone in the $0.15–$0.16 range. This level has historically acted as a base for bullish reversals. However, we're only considering a long entry if both DOGE and BTC confirm signs of holding their respective support levels. BTC’s structure remains crucial for altcoins to gain traction.
🔹 Long Spot Trade Setup (Conditional on Confirmation):
Entry Zone: $0.15 – $0.16
Take Profit Targets:
• TP1: $0.18 – $0.20
• TP2: $0.24 – $0.29
Stop Loss: Below $0.14
This setup targets a strong risk-to-reward structure, but we stress the importance of waiting for bullish confirmation before entry.
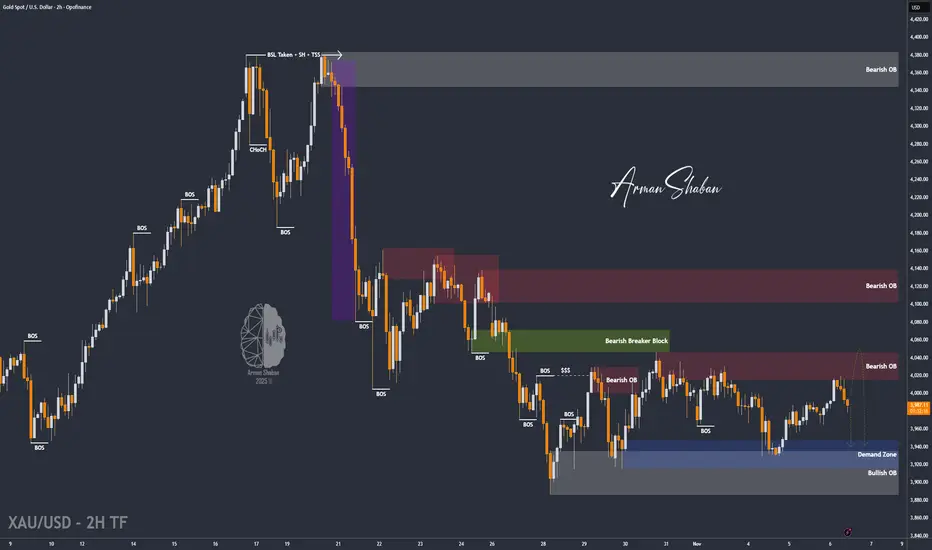
XAU/USD | Gold Rejected Again! Mid-Term Target Could Reach $3550By analyzing the Gold chart on the 2-hour timeframe, we can see that after the previous analysis, price started to rise but faced strong selling pressure when it entered the supply zone between $4016 and $4020.
Recently, Gold dropped to around $3978 and is now trading near $3990. The previous analysis remains valid — as long as Gold doesn’t break above $4040, the main scenario is still bearish, and we could even see a deeper correction toward $3550 in the mid-term.
This analysis will be updated soon — stay tuned for some powerful trade setups!
Please support me with your likes and comments to motivate me to share more analysis with you and share your opinion about the possible trend of this chart with me !
Best Regards , Arman Shaban
CHF/JPY SELLERS WILL DOMINATE THE MARKET|SHORT
CHF/JPY SIGNAL
Trade Direction: short
Entry Level: 190.016
Target Level: 189.715
Stop Loss: 190.214
RISK PROFILE
Risk level: medium
Suggested risk: 1%
Timeframe: 1h
Disclosure: I am part of Trade Nation's Influencer program and receive a monthly fee for using their TradingView charts in my analysis.
✅LIKE AND COMMENT MY IDEAS✅

Bitcoin BTC – Short Term Update📊 CRYPTO:BTCUSD initial reaction failed, and price action suggests one more leg lower to complete a 5th wave from the 10/27 peak. This would wrap up the current impulsive decline and set the stage for a larger corrective bounce.
⚠️ Important Note:
Treat any upcoming bounce as corrective, not impulsive. The structure does not yet support a new ATH scenario unless the market proves otherwise with a decisive bullish shift.

NZD/JPY BULLISH BIAS RIGHT NOW| LONG
Hello, Friends!
NZD/JPY is making a bearish pullback on the 10H TF and is nearing the support line below while we are generally bullish biased on the pair due to our previous 1W candle analysis, thus making a trend-following long a good option for us with the target being the 87.304 level.
Disclosure: I am part of Trade Nation's Influencer program and receive a monthly fee for using their TradingView charts in my analysis.
✅LIKE AND COMMENT MY IDEAS✅

CAD/JPY BEST PLACE TO BUY FROM|LONG
Hello, Friends!
It makes sense for us to go long on CAD/JPY right now from the support line below with the target of 110.285 because of the confluence of the two strong factors which are the general uptrend on the previous 1W candle and the oversold situation on the lower TF determined by it’s proximity to the lower BB band.
Disclosure: I am part of Trade Nation's Influencer program and receive a monthly fee for using their TradingView charts in my analysis.
✅LIKE AND COMMENT MY IDEAS✅

EUR/GBP BULLISH BIAS RIGHT NOW| LONG
Hello, Friends!
It makes sense for us to go long on EUR/GBP right now from the support line below with the target of 0.880 because of the confluence of the two strong factors which are the general uptrend on the previous 1W candle and the oversold situation on the lower TF determined by it’s proximity to the lower BB band.
Disclosure: I am part of Trade Nation's Influencer program and receive a monthly fee for using their TradingView charts in my analysis.
✅LIKE AND COMMENT MY IDEAS✅

GOLD Is Going Up! Long!
Take a look at our analysis for GOLD.
Time Frame: 2h
Current Trend: Bullish
Sentiment: Oversold (based on 7-period RSI)
Forecast: Bullish
The market is approaching a key horizontal level 4,007.16.
Considering the today's price action, probabilities will be high to see a movement to 4,053.41.
P.S
Overbought describes a period of time where there has been a significant and consistent upward move in price over a period of time without much pullback.
Like and subscribe and comment my ideas if you enjoy them!

USDJPY Will Fall! Sell!
Please, check our technical outlook for USDJPY.
Time Frame: 12h
Current Trend: Bearish
Sentiment: Overbought (based on 7-period RSI)
Forecast: Bearish
The market is approaching a significant resistance area 153.342.
Due to the fact that we see a positive bearish reaction from the underlined area, I strongly believe that sellers will manage to push the price all the way down to 151.544 level.
P.S
Please, note that an oversold/overbought condition can last for a long time, and therefore being oversold/overbought doesn't mean a price rally will come soon, or at all.
Like and subscribe and comment my ideas if you enjoy them!

AUDUSD Will Go Lower From Resistance! Short!
Here is our detailed technical review for AUDUSD.
Time Frame: 2h
Current Trend: Bearish
Sentiment: Overbought (based on 7-period RSI)
Forecast: Bearish
The market is on a crucial zone of supply 0.648.
The above-mentioned technicals clearly indicate the dominance of sellers on the market. I recommend shorting the instrument, aiming at 0.643 level.
P.S
The term oversold refers to a condition where an asset has traded lower in price and has the potential for a price bounce.
Overbought refers to market scenarios where the instrument is traded considerably higher than its fair value. Overvaluation is caused by market sentiments when there is positive news.
Like and subscribe and comment my ideas if you enjoy them!

EURCHF Will Go Up From Support! Buy!
Take a look at our analysis for EURCHF.
Time Frame: 6h
Current Trend: Bullish
Sentiment: Oversold (based on 7-period RSI)
Forecast: Bullish
The price is testing a key support 0.932.
Current market trend & oversold RSI makes me think that buyers will push the price. I will anticipate a bullish movement at least to 0.935 level.
P.S
We determine oversold/overbought condition with RSI indicator.
When it drops below 30 - the market is considered to be oversold.
When it bounces above 70 - the market is considered to be overbought.
Like and subscribe and comment my ideas if you enjoy them!

EURUSD On The Rise! BUY!
My dear subscribers,
EURUSD looks like it will make a good move, and here are the details:
The market is trading on 1.1482 pivot level.
Bias - Bullish
Technical Indicators: Both Super Trend & Pivot HL indicate a highly probable Bullish continuation.
Target - 1.1530
About Used Indicators:
The average true range (ATR) plays an important role in 'Supertrend' as the indicator uses ATR to calculate its value. The ATR indicator signals the degree of price volatility.
Disclosure: I am part of Trade Nation's Influencer program and receive a monthly fee for using their TradingView charts in my analysis.
———————————
WISH YOU ALL LUCK

GOLD Buyers In Panic! SELL!
My dear friends,
GOLD looks like it will make a good move, and here are the details:
The market is trading on 3999.2 pivot level.
Bias - Bearish
Technical Indicators: Supper Trend generates a clear short signal while Pivot Point HL is currently determining the overall Bearish trend of the market.
Goal - 3985.2
Recommended Stop Loss - 4007.7
About Used Indicators:
Pivot points are a great way to identify areas of support and resistance, but they work best when combined with other kinds of technical analysis
Disclosure: I am part of Trade Nation's Influencer program and receive a monthly fee for using their TradingView charts in my analysis.
———————————
WISH YOU ALL LUCK
