GBPUSD H1 Analysis Must Follow this signal
Used Proper Moneymanagement
Book your profit or set BE after 25 pips Move
Tradingidea

Trade Idea for EURUSD60% Fib retracement
market rejected daily resistance
market in sell zone
waiting for pullback to 1Hr resistance before entry

long term of adaNow we have a good analysis of adausdt and I want to share it with you so that you can use it
BINANCE:ADAUSDT

DXY$DXY Dollar Showed Little Reaction to CPI Data so i'm looking for the markets to act normal with no more major news ahead anytime soon.
Therefore, i'm looking for DXY to drop and make a correction.
Disclaimer: This is not trade advice. Trading foreign currencies, stocks, indices, etc can be a challenging and potentially profitable opportunity for investors. However, before deciding to participate in the financial markets, you should carefully consider your investment objectives, level of experience, and risk appetite. Most importantly, do not invest money you cannot afford to lose!!!
Good luck and Happy trading!

EURNZD-15M-Sideways EURNZD is trading on sideways, trade plan is we have 2 entries on resistance 2and support 2, through buy stop and buy sell, if any of the SnR will break our entry will be execute
risk is 1% on each trade and total risk is 2%

How to allocate your funds for profit?
There are no wasted paths in life. All your efforts now either earn experience, knowledge, or wealth. As the Chinese saying goes, "Don't put all your eggs in one basket." This is because if you accidentally drop the basket, all the eggs will break. This principle applies to investment markets as well. It is recommended to avoid concentrating all funds into one type of investment, as it could lead to uncontrollable risk.
So, how can we allocate our funds sensibly?
Here are three investment types to consider:
Cryptocurrencies
After the emergence of countless "get-rich-quick" stories in the cryptocurrency market, many people have flocked to invest. However, the reality is that the market is merciless and risky. Only those who are strategic and opportunistic can make a profit. It is recommended to invest 10% of your funds into the market for a coin with a lower price point, and hold it for the long-term. If the value increases, your assets will expand infinitely. If it fails, you won't lose everything.
Forex Market
To participate in the forex market, choose currency pairs with lower liquidity, such as EURUSD, USDJPY, and GBPUSD. When these products show good buying opportunities, it is recommended to invest 50% of your funds into the market. The fluctuation of currency pairs is relatively small, making it a stable option for long-term trading. However, it requires a certain amount of capital accumulation to see profits.
Futures Market
In this market, let's focus on XAUUSD. This product has storage value internationally, making it suitable for trading. However, due to its sensitivity to news and geopolitical events, it can experience severe fluctuations. It is recommended to invest 20% of your funds into the market for short-term operations. Trading once or twice a day to gain short-term profits is the suggested approach.
The remaining 20% of your funds can be used for your daily expenses. Trading is not gambling. It is important to learn how to plan within your capabilities, manage your finances wisely, and make trading easier.
I have extensive knowledge in cryptocurrencies, forex, stocks, gold, and crude oil futures products. I will continue to update my daily operation strategies. Thank you for your attention and likes. If you have any questions, please feel free to leave a message. I will provide the most reliable advice to help you.

GBPCAD chart analysisHey everyone,
In this analysis, price is showing us a slight bullish correction after the sharp impulse. which indicate the phase is about to complete impulse>correction>impulse.
Now my bias for this is a buy on possible touch on trendline.
WHAT ARE WE EXPECTING:
# a lower time frame bullish continuation pattern to form/break of trendline
HOW DO WE ENTER:
# rejections candles for risky entry
# for reduce risk entry we need to see a break of trendline followed by a retest or a lower time frame correction
INVALID SETUP
# when you see a sharp impulse followed by a bearish continuation correction which means trend change
TARGET:
# top of slight correction
THANKS FOR READING
AS ALWAYS TRADE SAFE AND STAY SAFE!!

UJ Looking for bearish movement to the downside 02/23/23$USDJPY -Looking for bearish movement to the downside after top down analysis.
Looking for a retest at my POI lead to this bias.
Good luck!
The information and publications are not meant to be, and do not constitute, financial, investment, trading, or other types of advice or recommendations supplied or endorsed by TradingView.

UniSwap's waterfallFibonacci's ratios show a constant decrease in the trend as bearish scenario.
We might get another 10% deeper if BTC decreases drastically.
1H candlesticks show more aggresivenes than in 4H, but still it is in the
Fib's ratio.

UJ Looking for bullish movement to the upside.$USDJPY -Looking for bullish movement to the upside after top down analysis.
Several retest on my weekly POI lead to this bias.
Good luck and have a Happy Friday.

ETH (ETHEREUM DETAILED ANALYSIS)BINANCE:ETHUSDT
HI , TRADER'S ..AS you can see in chart
ETH is trading in Rectangle , market is trading Between Major Support And resistance
As 20,50 & 200 EMA is above current price , So it can push market down
possibly market will breakout from support Zone and will go Down to next support level
Target is set on chart .
❤️Please, support my work with follow ,share and like, thank you!❤️

THIS IS MAGIC!Intraday setup for purchase and sale of the BINANCE:MAGICUSDT asset. The transaction must be accompanied by a short stop, or the purchase should be made in parts at each of the levels.
The goals are minimal, you can carry some higher.

GoldViewFX - 4H CHART UPDATED LEVELS & TARGETSHey Everyone,
Please see our updated 4H chart weighted Goldturns and targets.
Although we saw a well overdue retracement and tank in price on Gold last week, as you can see by zooming out, we are still in a strong uptrend long term. Price is now testing support structure with still room to move down to 1836. If we see a EMA5 break below 1836 we are likely to see the full swing range.
We are likely to see some more swings and then establish a safe tested range to trade between.
We will use our EMA5 cross and lock above and below our weighted Goldturn support and resistance levels to track and trade the movement up and down level to level. We will now wait patiently for price to settle and then continue with our long terms plans to buy dips.
BULLISH TARGETS
1871
1894
1917
BEARISH TARGETS
1836
1802
SWING RANGE
1802 - 1772
As always, we will keep you all updated with regular updates throughout the week and how we manage the active ideas and setups. Please don't forget to like, comment and follow to support us, we really appreciate it!
GoldViewFX
XAUUSD TOP AUTHOR

Alice long tradeWait for the price to retest
Entry= 1.767
Follow strict stoploss and manage your risk accordingly.
This is an analysis for professionals only.

Bank Nifty Analysis for TomorrowBanknifty 30min Chart Analysis & prediction for upcoming trading section.

Bitcoin cycle First scenario
The price is over 22800 but without falling below 19300.
Second scenario:
It drops below 19300, reaches the price of 19300 only as a maximum price in a single trend and falls below 19300.
Third scenario:
When we got here, we were already used to knowing what was happening, a sudden drop to the area of 15000-16000.
BINANCE:BTCUSDT

ATOMUSDT Short Trading Idea with Easy Invalidation.ATOM Short Trading Setup.
What I'm Looking In this Trade:
H4 Retest of key level 9.5 to fill previous vector candle.
Starting to DCA from 9.447 following next bid at 9.615 just incase fake pump or scam wick.
Confirmation to setup will be hard rejection at 9.615 with H4 Closing near 9.5
Hence, Its an easy invalidation to setup and reward is 4x time grater than risk.

USDJPY | Detail Analysis | DecryptersHi people welcome Greetings
We are short term bullish on USDJPY
further details are on chart
PLZ LIKE ,SHARE & COMMENT

Gold Detail Analysis | XAUUSD ForecastHi people Greetings , We are wafting for Breakout for clear direction
We Expect breakout will come at time of major news till that we have scalping opportunities which we will Avoid for now

US30 : Intraweek Technical AnalysisUS500 Intraweek Technical Analysis:
after rejection from 3925 the SP500 found some support at 3790. The US500 reversed from 3890 and after testing the support of 3700 twice the US500 gave a weekly closure at 3763. The US500 is expected to test the resistance of 3900 in coming week. 3800 is the key resistance for tomorrow where we can see some rejection. My idea for coming week is to enter long on support of 3700 and profit taking at 3800 and 3900. The key resistances and supports for coming week are 3900 and 3700.
there is also a moving average crossover on 4Hr time frame at 38% fib level.
If you like this or if you think the opposite of this or if there is any other opinion, mention it in the comments. I am open to all kind of suggestions and critics.

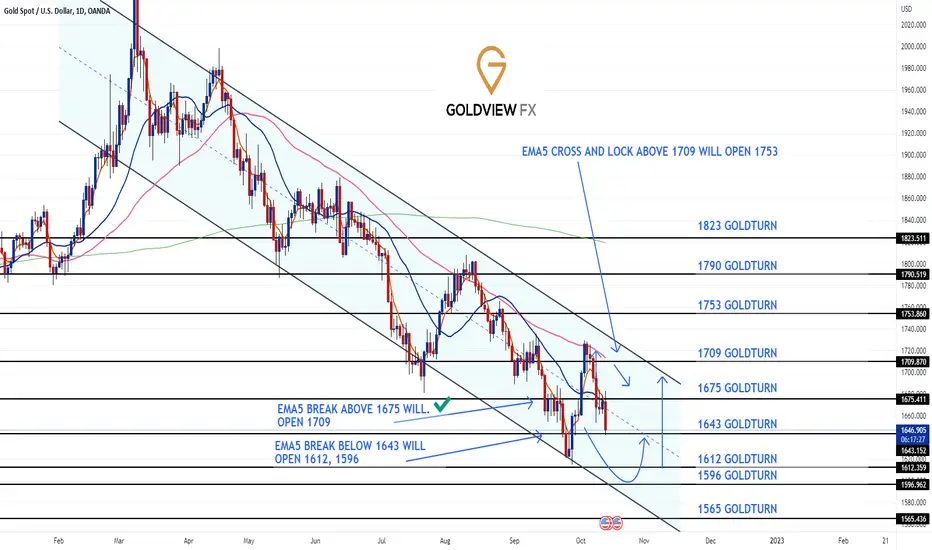
GoldViewFX - DAILY CHART UPDATEHey Everyone,
Our daily chart is tracking well, up and down our descending Goldturn channel. We had another fantastic day at premiere, booking 2 signals from today's support with a perfect TP to 1675 and 1677.
Our descending Goldturn channel on the daily chart is being respected well, and price is now testing and respecting 1643 Goldturn. We will still need to see a cross and lock below 1643 to see the lower Goldturns down to 1612-1596, or we will see a retest back to 1675.
Price has also broken out of the 1H chart Rangebox and currently in a range shift zone testing Rangebox 2. We will now look for a rejection or break into rangebox 2 to confirm our next move.
As always, we will keep you all updated with any changes to our plans throughout the week. Please don't forget to like, comment and follow to support us, we really appreciate it!
GoldViewFX
XAUUSD TOP AUTHOR1
EURUSD H4 setupThe change in the market was signaled by the break in structure and now we're waiting to see if the buyers will step in again.

EURUSD SHORT TERM BUYDaily:
1. Bearish
2. Price at discount
3. came from premium
4. target D LL
4H:
1. Bearish
2. Price at discount
3. came from premium
4. 4H HL
15M:
1. Bearish
2. Price at discount
3. Came from discount
4. 15 MIN HH
