De-Dollarization & Currency Wars1. Introduction
For nearly 80 years, the U.S. dollar has ruled the world economy. It’s the currency in which oil is priced, international trade is settled, and central banks hold their reserves. But in recent years, we’ve heard a new buzzword—de-dollarization. This means countries are actively trying to reduce their reliance on the U.S. dollar in trade and finance.
Alongside this trend, another term pops up—currency wars. These are not fought with tanks or missiles but with exchange rates, sanctions, and financial strategies. In short, it’s the battle of money versus money, where nations use currencies as weapons to protect their own interests or undermine rivals.
Both de-dollarization and currency wars are shaping the future of global trade. To understand where the world is heading, we must look back at how the dollar became so powerful and why many nations now want to escape its grip.
2. The Rise of the Dollar’s Dominance
The U.S. dollar didn’t always dominate global finance. Before World War II, the British pound sterling was the world’s primary reserve currency. But after the war, Britain was economically weakened, and the U.S. emerged as the strongest economy.
Bretton Woods Agreement (1944): The world agreed to peg major currencies to the dollar, and the dollar itself was pegged to gold. This system made the dollar the centerpiece of global trade.
End of Gold Standard (1971): President Richard Nixon ended dollar-gold convertibility, but the dollar retained dominance.
Petrodollar System (1970s): The U.S. struck deals with Saudi Arabia and OPEC, ensuring oil was sold only in dollars. Since every country needs oil, every country needed dollars.
These moves cemented the dollar as the backbone of global finance. By the 1990s, over 70% of world trade and reserves were in dollars.
3. Why Countries Want to Escape the Dollar Trap
So, if the dollar has been so powerful, why are countries now trying to move away from it? Several reasons:
Sanction Power of the U.S.: Nations like Russia, Iran, and Venezuela have been cut off from dollar-based systems like SWIFT. They see dependence on the dollar as a political vulnerability.
U.S. Debt & Inflation Concerns: America’s ballooning national debt and money printing raise doubts about the dollar’s long-term stability.
Desire for Multipolarity: Emerging powers like China, India, and Brazil want a world where no single country controls the financial system.
Currency Sovereignty: Many nations want trade in their own currencies to reduce foreign exchange risks.
In short, de-dollarization is not only economic—it’s also political and strategic.
4. Currency Wars Explained
A currency war happens when nations deliberately manipulate currency values or financial systems to gain an advantage. These wars take different forms:
Exchange Rate Manipulation: Countries devalue their currencies to boost exports (China has been accused of this).
Sanctions & Financial Exclusion: The U.S. uses the dollar’s dominance to freeze assets, block trade, and isolate nations.
Reserve Diversification: Central banks reduce dollar holdings and increase gold, euro, or yuan reserves.
Digital Battles: Central Bank Digital Currencies (CBDCs) are the new frontier of currency competition.
Currency wars are silent but powerful—they can reshape trade flows, weaken rivals, and redistribute wealth.
5. Current Players in De-Dollarization
The biggest pushback against dollar dominance comes from BRICS nations (Brazil, Russia, India, China, South Africa), recently joined by countries like Saudi Arabia, UAE, and Iran.
China: Promoting the yuan through Belt & Road projects, oil trade, and Shanghai oil futures.
Russia: After U.S. sanctions, Moscow shifted oil and gas sales to rubles and yuan.
India: Pushing rupee trade settlement with neighbors and partners.
Middle East: Saudi Arabia and UAE are exploring non-dollar oil sales, breaking the petrodollar system.
Africa & Latin America: Countries are exploring local currency trade to avoid dollar shortages.
Together, these moves mark a growing wave of financial independence.
6. Alternative Systems Emerging
As countries de-dollarize, what replaces the dollar?
Chinese Yuan (Renminbi): Growing in trade but still limited by capital controls.
Euro: Strong but hampered by EU’s fragmented politics.
Gold: Central banks have massively increased gold buying as a hedge.
Cryptocurrencies & Stablecoins: Offer decentralized alternatives but face volatility and regulation.
CBDCs (Digital Currencies): China’s digital yuan is already in use, and many nations are testing their own versions.
None alone can fully replace the dollar yet, but together, they reduce its monopoly.
7. Impact on Global Trade & Finance
De-dollarization changes the way money flows:
Trade Settlements: More deals are now settled in yuan, rupee, or local currencies.
Banking Systems: New payment networks like China’s CIPS challenge SWIFT.
Reserve Management: Central banks diversify away from dollar-heavy portfolios.
Commodity Pricing: Gold, oil, and gas could increasingly be priced in non-dollar terms.
Inflation & Forex Volatility: Currency wars often trigger inflation in weaker economies.
For ordinary people, this may mean currency fluctuations, higher import costs, or new opportunities in trade.
8. Case Studies
Russia (Post-Ukraine Sanctions): Cut off from dollar payments, Russia turned to China, India, and Turkey for yuan and ruble trade. The ruble survived only by leaving the dollar system.
China’s Yuan Push: Beijing signed currency swap agreements with dozens of countries, expanding yuan trade share.
India’s Rupee Trade: India has started settling with countries like Sri Lanka and Iran in rupees.
These examples show that de-dollarization is no longer theory—it’s happening.
9. Challenges in Replacing the Dollar
Despite progress, replacing the dollar is very hard. Why?
Liquidity: The dollar is the most liquid currency—easy to buy/sell globally.
Trust: Investors trust U.S. institutions more than those of rivals.
Military & Geopolitical Power: The U.S. Navy protects trade routes, indirectly backing the dollar.
Network Effect: Everyone uses dollars because everyone else does—it’s hard to break this cycle.
So, while de-dollarization is real, it’s a slow, long-term process.
10. Future Scenarios
Looking ahead, three possible outcomes emerge:
Multipolar Currency World: The dollar remains important but shares power with yuan, euro, rupee, and digital assets.
Fragmented Finance: Countries split into blocs—U.S. dollar bloc, China-led yuan bloc, regional trade blocs.
Digital Currency Revolution: CBDCs and blockchain-based systems reshape global money, bypassing traditional systems.
Whichever path unfolds, the era of absolute U.S. dollar dominance is fading.
11. Conclusion
De-dollarization and currency wars represent the hidden financial battles of our time. For decades, the dollar was king, but now rising powers are challenging its throne. Currency wars are not fought with soldiers but with sanctions, interest rates, and payment systems.
For ordinary people, these shifts may show up in fluctuating exchange rates, changing fuel prices, or the rise of digital money. For nations, it’s about sovereignty, independence, and survival in a financial system long controlled by one power.
The world is moving from a dollar-dominated system to a multipolar currency order. The transition will be messy, filled with currency wars and power struggles, but it marks the beginning of a new financial era.
Tradingideas

Energy Transition & Commodity Supercycle1. Introduction
The world is standing at the intersection of two powerful forces shaping the global economy: the energy transition and the possibility of a new commodity supercycle.
The energy transition refers to the global shift away from fossil fuels like coal, oil, and natural gas, toward renewable and cleaner energy sources such as solar, wind, hydrogen, and nuclear. This transformation is driven by climate change concerns, technological advancements, and policy shifts by governments worldwide.
A commodity supercycle is a prolonged period (often 10–20 years) where commodity prices—such as oil, copper, lithium, and agricultural goods—rise significantly due to strong structural demand outpacing supply. Past supercycles were fueled by industrial revolutions, wars, and urbanization waves.
Today, these two phenomena are interlinked. The push for clean energy demands massive amounts of new materials—copper for wires, lithium and cobalt for batteries, rare earths for wind turbines, and silver for solar panels. At the same time, fossil fuel demand doesn’t vanish overnight, creating a tug-of-war between old energy and new energy, each influencing commodity markets in profound ways.
2. Historical Context: Past Commodity Supercycles
To understand today’s situation, it’s important to look at history. Commodity supercycles have occurred several times over the past century:
Late 19th century (Industrial Revolution)
Rapid industrialization in Europe and the U.S. fueled huge demand for steel, coal, and oil.
Post-World War II (1950s–70s)
Reconstruction of Europe and Japan required enormous amounts of metals, oil, and agricultural products.
China-led Boom (2000s–2014)
China’s entry into the World Trade Organization (WTO) and its infrastructure-heavy growth led to a surge in oil, iron ore, copper, and coal demand.
Each of these supercycles reshaped global trade and investment. Today, the green energy revolution may drive the next one.
3. What is the Energy Transition?
The energy transition is about changing the way we produce, distribute, and consume energy.
Key Drivers:
Climate Change: Rising global temperatures, extreme weather, and net-zero commitments.
Technology: Falling costs of solar, wind, and batteries.
Policy: Carbon taxes, emission regulations, and renewable energy mandates.
Consumer Behavior: Electric vehicles (EVs), rooftop solar, and ESG (environmental, social, governance) investing.
Main Pillars of Energy Transition:
Renewables: Solar, wind, hydropower, geothermal.
Electrification: EVs, electric heating, smart grids.
Storage: Lithium-ion batteries, hydrogen, pumped hydro.
Decarbonization of industry: Green hydrogen for steel, carbon capture technologies.
This shift requires enormous physical resources, which links the energy transition directly to commodities.
4. Commodity Demands of the Energy Transition
Unlike the oil-driven 20th century, the 21st-century energy system relies on minerals and metals.
Copper
Vital for electrical wiring, EVs, and renewable grids.
A single EV uses 2.5x more copper than a gasoline car.
Demand could double by 2035.
Lithium
Core of rechargeable batteries for EVs and storage.
Demand may rise 7-fold by 2030.
Cobalt
Improves battery life and performance.
Supply concentrated in the Democratic Republic of Congo (DRC), raising geopolitical concerns.
Nickel
Needed for high-energy-density batteries.
Indonesia is emerging as the global hub.
Rare Earths (Neodymium, Dysprosium, etc.)
Essential for magnets in wind turbines and EV motors.
China controls ~80% of global supply.
Silver
Used in solar panels.
Rising solar installations = surging silver demand.
This demand creates the foundation for a green commodity supercycle.
5. Supply-Side Challenges
Demand growth is one side of the equation. Supply, however, faces major bottlenecks:
Long Lead Times: New mines take 10–15 years to develop.
Geopolitical Risks: Resource nationalism, export bans, and trade tensions.
Environmental & Social Concerns: Local opposition, ESG scrutiny, and water use in mining.
Underinvestment: Years of low prices discouraged new projects in oil and mining sectors.
The result? Structural shortages that push prices higher.
6. The Role of Fossil Fuels in Transition
While the world shifts to renewables, oil and gas remain critical in the short and medium term:
Oil: Needed for transportation, petrochemicals, aviation.
Natural Gas: Acts as a “bridge fuel” to renewables.
Coal: Still dominant in India, China, and parts of Africa.
Ironically, underinvestment in fossil fuels—due to climate pressures—could trigger short-term price spikes, fueling inflation and instability.
This creates a paradox: the transition away from fossil fuels may actually make them more expensive in the interim.
7. Economic Implications of an Energy-Driven Supercycle
If the green transition sparks a commodity supercycle, the ripple effects are vast:
Inflationary Pressures
Higher commodity prices = higher costs of goods.
Potential stagflation risks.
Winners & Losers
Winners: Resource-rich nations (Chile for lithium, Indonesia for nickel, Australia for iron ore, Africa for cobalt).
Losers: Import-dependent nations (India, Japan, Europe).
Investment Shifts
Mining, renewable infrastructure, EV supply chains attract capital.
Traditional oil & gas companies under pressure but may benefit from short-term price spikes.
Currency Impact
Commodity exporters’ currencies (AUD, CAD, CLP) strengthen.
Importers’ currencies weaken.
Global Trade Patterns
New alliances forming around critical minerals (U.S. + Australia, China + Africa).
8. Geopolitics of Energy Transition
Energy has always been geopolitical. In the past, oil shaped wars, alliances, and global dominance. In the future, critical minerals will play that role.
China: Dominates rare earths and battery manufacturing.
U.S. & Europe: Trying to secure supply chains via partnerships (Inflation Reduction Act, EU Critical Raw Materials Act).
Africa & Latin America: Emerging as key battlegrounds for resources.
Middle East: Investing in hydrogen and renewables to stay relevant in a post-oil world.
This geopolitical race adds volatility and competition, feeding into the supercycle narrative.
9. Financial Markets & Commodities
A commodity supercycle doesn’t just impact physical trade—it also reshapes financial markets:
Hedge Funds & ETFs: Increasing exposure to lithium, copper, and rare earths.
Retail Investors: Gaining access via green commodity ETFs.
Central Banks: Worry about inflation and commodity-driven shocks.
Corporates: Automakers (Tesla, BYD, Ford) racing to secure long-term mineral contracts.
Commodities are no longer just “raw materials”—they are becoming strategic assets.
10. Risks to the Supercycle Thesis
While the green supercycle is a strong narrative, there are risks:
Technological Breakthroughs
Battery alternatives (sodium-ion, solid-state) could reduce lithium/cobalt demand.
Policy Shifts
Political resistance to climate policies may slow transition.
Recycling & Circular Economy
Secondary supply from recycling could offset new demand.
Economic Slowdowns
Recessions or prolonged low growth may dampen demand.
Overestimation of Speed
Energy transitions historically take decades, not years.
11. Case Studies
a. Lithium Boom
Between 2020–2023, lithium prices rose more than 500%, driven by EV demand. Though prices later corrected, the volatility highlights supply-demand mismatches.
b. Copper as “New Oil”
Goldman Sachs and other analysts call copper the “new oil” because electrification is impossible without it. Current supply projections suggest a multi-million-ton deficit by 2030.
c. Oil Paradox
Despite climate goals, oil demand hit record highs in 2023–2024, showing the sluggish pace of transition. This means both fossil fuels and green metals can rally simultaneously.
12. Future Outlook: 2025–2040
Looking ahead, the interplay of energy transition and commodities will shape economies:
Short Term (2025–2030):
High volatility, shortages in copper, lithium, and nickel.
Oil remains essential but faces supply tightness.
Prices of key metals remain elevated.
Medium Term (2030–2040):
Renewables and EVs dominate new investment.
Recycling industry scales up.
New supply from Africa/Latin America stabilizes markets somewhat.
Long Term (2040+):
Fossil fuel demand declines sharply.
Clean energy minerals dominate trade flows.
Commodity power shifts from Middle East to Latin America & Africa.
13. Conclusion
The energy transition is not just about climate—it’s a structural re-engineering of the world economy. This transformation requires vast amounts of resources, creating conditions for a commodity supercycle unlike any in history.
But unlike past cycles driven by industrial revolutions or urbanization, this one is shaped by decarbonization, technology, and geopolitics. It’s a cycle that could bring prosperity to resource-rich nations, inflationary shocks to consumers, and massive shifts in global trade.
Whether it lasts 10 years or 20, the green commodity supercycle is likely to redefine wealth, power, and progress in the 21st century.
Cybersecurity Risks in Global Trading Systems1. The Technological Backbone of Global Trading Systems
Modern trading systems are built upon a complex ecosystem of hardware, software, and networks. Key components include:
Trading Platforms: Electronic systems enabling order placement, execution, and settlement.
Market Data Feeds: Real-time price and volume data from exchanges, which are essential for algorithmic and high-frequency trading.
Cloud Infrastructure: Many trading firms now use cloud-based services for scalability, storage, and computational power.
APIs and Interconnections: Systems connect via APIs to brokers, exchanges, and other financial institutions, creating interdependencies.
Decentralized Finance (DeFi) Protocols: Emerging blockchain-based trading platforms that operate without traditional intermediaries.
While these technologies increase efficiency, speed, and accessibility, they also create vulnerabilities that cybercriminals can exploit.
2. Key Cybersecurity Risks in Trading Systems
Cyber threats to global trading systems can be categorized into several types, each with distinct characteristics and potential impacts.
2.1 Data Breaches and Theft
Sensitive financial data—trading algorithms, client information, and transaction histories—are prime targets for cybercriminals. Breaches can occur via:
Phishing attacks: Fraudulent emails or messages trick employees or traders into revealing credentials.
Credential stuffing: Automated attacks using stolen login credentials to access accounts.
Insider threats: Employees or contractors intentionally or unintentionally leak sensitive data.
Impact: Data breaches can lead to financial loss, reputational damage, and regulatory penalties. For instance, a breach exposing high-frequency trading algorithms can allow competitors or criminals to exploit market positions.
2.2 Distributed Denial-of-Service (DDoS) Attacks
DDoS attacks flood trading platforms or exchanges with overwhelming traffic, causing outages or slowdowns.
Motivation: Hackers may aim to manipulate market conditions by disrupting trading during volatile periods.
Historical example: In 2012, the NASDAQ faced DDoS attacks that briefly disrupted trading, highlighting vulnerabilities in market infrastructure.
Impact: DDoS attacks can halt trading, erode investor confidence, and create opportunities for price manipulation.
2.3 Market Manipulation through Cyberattacks
Cyberattacks can be used to distort market prices artificially.
Spoofing attacks: Fake orders are placed to create false demand or supply.
Algorithmic exploitation: Hackers exploit vulnerabilities in automated trading systems to trigger erroneous trades.
Impact: Such attacks can lead to significant financial losses and undermine trust in market integrity. Regulators have become increasingly vigilant about algorithmic manipulation.
2.4 Malware and Ransomware
Malware targeting trading systems can cause disruptions, exfiltrate sensitive data, or lock critical systems.
Ransomware: Attackers encrypt trading data and demand payment for access restoration.
Advanced persistent threats (APTs): Long-term, stealthy attacks targeting high-value trading operations, often state-sponsored.
Impact: Malware and ransomware can cripple trading firms, delay settlements, and trigger cascading financial consequences in interconnected markets.
2.5 Cloud and Third-Party Risks
The adoption of cloud infrastructure and third-party services has introduced new vulnerabilities:
Misconfigured cloud servers can expose sensitive trading data.
Third-party vendors may have weaker security standards, providing an entry point for attacks.
Supply chain attacks: Hackers compromise trusted software providers to infiltrate multiple trading firms simultaneously.
Impact: Cloud and third-party vulnerabilities can compromise multiple market participants, amplifying the systemic risk.
2.6 Blockchain and DeFi Vulnerabilities
Decentralized trading platforms and cryptocurrency exchanges are susceptible to unique cyber risks:
Smart contract exploits: Flaws in code can allow hackers to drain funds from DeFi protocols.
51% attacks: In smaller blockchain networks, attackers controlling a majority of network power can manipulate transactions.
Wallet phishing: Users’ private keys or wallets can be stolen through phishing or malware.
Impact: These vulnerabilities can lead to massive financial losses and shake confidence in emerging digital financial markets.
3. Systemic Risks in Global Trading
The interconnectivity of global trading systems means cyberattacks on a single node can ripple across markets.
3.1 Cross-Border Implications
Trading firms operate in multiple jurisdictions. A cyberattack in one country can affect:
Market liquidity in another country.
Foreign exchange settlements.
Multinational clearinghouses.
3.2 Contagion Risk
Failures in one platform can trigger panic selling, algorithmic misfires, or delayed settlements, magnifying market volatility.
3.3 Operational Disruption
Even temporary outages in critical trading infrastructure can disrupt order flows, create gaps in market transparency, and affect investor trust.
4. Regulatory Landscape and Compliance
Regulatory authorities globally recognize the critical importance of cybersecurity in financial markets:
U.S. Securities and Exchange Commission (SEC): Enforces cybersecurity standards for broker-dealers and exchanges.
European Securities and Markets Authority (ESMA): Requires risk assessments and incident reporting for trading firms.
Financial Stability Board (FSB): Provides guidelines on operational resilience for global financial infrastructure.
India’s SEBI: Mandates cybersecurity audits and reporting for trading platforms and brokers.
Challenges: Regulatory frameworks struggle to keep pace with rapidly evolving technology. Moreover, global coordination is challenging, as cyberattacks do not respect borders.
5. Case Studies of Cybersecurity Incidents in Trading
5.1 The 2010 Flash Crash
Although primarily caused by algorithmic trading, the Flash Crash highlighted the vulnerability of automated trading systems to manipulation, accidental errors, or system failures.
5.2 Nasdaq and DDoS Attacks (2012–2013)
Repeated DDoS attacks caused temporary outages, raising awareness of the importance of infrastructure resilience.
5.3 Mt. Gox Bitcoin Exchange Hack (2014)
The Mt. Gox hack resulted in the loss of 850,000 bitcoins, illustrating risks in cryptocurrency trading platforms and the consequences of inadequate cybersecurity.
5.4 Colonial Pipeline Ransomware Attack (2021)
Though not a trading platform, the Colonial Pipeline incident showed how ransomware can disrupt supply chains and trading-related commodities, affecting market pricing globally.
6. Emerging Threats and Future Risks
6.1 AI-Powered Cyberattacks
Artificial intelligence can be weaponized to:
Craft highly convincing phishing attacks.
Automatically exploit vulnerabilities in trading algorithms.
Conduct market manipulation at unprecedented speeds.
6.2 Quantum Computing Threats
Quantum computing could potentially break current encryption standards, threatening the confidentiality and integrity of trading systems.
6.3 Deepfake and Social Engineering Attacks
Advanced deepfakes could impersonate executives or regulatory authorities to authorize fraudulent transactions.
6.4 Increased Targeting of SMEs in Trading
Smaller trading firms and emerging market platforms often have weaker security, making them attractive targets that can be gateways to larger markets.
7. Mitigation Strategies
Addressing cybersecurity risks requires a multi-layered approach:
7.1 Technical Measures
Encryption: Securing sensitive data at rest and in transit.
Multi-factor authentication: Reducing the risk of credential theft.
Regular penetration testing: Identifying and fixing vulnerabilities.
AI-driven threat detection: Monitoring for unusual trading patterns and potential attacks.
7.2 Operational Measures
Incident response planning: Ensuring rapid recovery from attacks.
Employee training: Reducing phishing and insider threats.
Vendor risk management: Auditing third-party security practices.
7.3 Regulatory and Collaborative Measures
Global standards harmonization: Coordinating cybersecurity frameworks across markets.
Information sharing: Exchanges and regulators sharing threat intelligence to prevent attacks.
Stress testing and simulation: Evaluating system resilience under cyberattack scenarios.
8. The Human Factor in Cybersecurity
Even the most advanced technology is vulnerable without proper human oversight. Common human errors include:
Using weak passwords or reusing credentials.
Falling for phishing attacks.
Misconfiguring cloud services.
Failing to follow incident response protocols.
Training, awareness, and a culture of cybersecurity are essential components of risk management in global trading systems.
9. Conclusion
Cybersecurity risks in global trading systems represent one of the most pressing challenges in modern finance. The combination of complex technology, interconnectivity, and rapid innovation creates a landscape where threats are constantly evolving. Breaches, attacks, or system failures can have cascading effects, impacting not only individual firms but entire markets and economies.
Mitigating these risks requires a holistic approach:
Investing in robust technical infrastructure and advanced threat detection.
Developing strong operational protocols, including employee training and incident response plans.
Coordinating globally through regulators, exchanges, and industry consortia to share intelligence and best practices.
Emphasizing ongoing research into emerging threats such as AI-powered attacks, quantum computing risks, and blockchain vulnerabilities.
In the high-speed, high-stakes world of global trading, cybersecurity is not just a technical issue—it is a fundamental pillar of market stability, investor trust, and economic resilience. Firms that proactively manage cybersecurity risks are better positioned to thrive in an increasingly interconnected, technology-driven
Global IPO trends & SME listings1. Brief history — how we got here
IPOs historically follow cycles tied to macro liquidity, investor sentiment, and policy. The mid-2010s saw steady IPO activity, disrupted dramatically in 2020 by COVID-19; markets recovered in 2021 with a surge in tech and growth listings. 2022–2023 brought market corrections: higher interest rates, equity de-rating for growth assets, and legislative/regulatory shocks in key jurisdictions (China, EU regulatory changes). By late-2023 and into 2024, a combination of easing lulls in some markets, fresh corporate readiness, and improved public market reception produced a recovery in 2024 and a stronger H1 2025, with proceeds and listing counts rising year-over-year in many datasets. Global consultancies and market trackers reported this lift in IPO volume and proceeds in H1 2025 compared with H1 2024.
2. The numbers — volume, proceeds and notable metrics (2023–H1 2025)
Key empirical takeaways from market trackers and advisory firms:
Overall rebound: Several major reports recorded a meaningful rebound in H1 2025 versus H1 2024, both in number of listings and aggregate proceeds — an increase in global proceeds in the order of mid-teens percent for the first half of 2025.
Listings count: Different trackers report slightly different counts (methodologies vary — inclusion/exclusion of SPACs, smaller exchanges), but the trend is broadly consistent: 2024 saw more IPOs than 2023, and 2025 continued that momentum. Renaissance Capital and other IPO trackers show dozens to a few hundreds of IPOs in 2025 depending on inclusion rules.
SPACs and alternatives: SPAC activity — after a lull in 2021–2022 — resurfaced in 2024 and into 2025, contributing materially to total IPO counts and providing a revived route for some issuers. Reports indicate SPACs accounted for a significant share of IPO activity in early-to-mid 2025.
3. Structural shifts reshaping global IPO markets
3.1 Cross-border listings and jurisdictional choice
A striking trend in 2024–2025 is increasing cross-border activity: more issuers are choosing to list outside their home jurisdiction. The U.S. regained strong pull for many high-growth companies (including non-U.S. issuers), driven by deep liquidity pools, active institutional appetites, and better aftermarket performance in certain sectors. Advisory reports in 2025 document record cross-border listings with a large proportion choosing the U.S. as destination.
Drivers:
Liquidity and valuation premia: U.S. and certain developed exchanges still offer higher valuations and deeper institutional demand for large growth names.
Regulatory clarity or flexibility: Some markets provide disclosure frameworks attractive to growth companies (or conversely, some home markets face regulatory headwinds that push issuers abroad).
Strategic investor access: Listings in a target market can bring strategic investors, research coverage, and credibility within that investor base.
3.2 Return of alternative listing routes: SPACs, direct listings, and IPO hybrids
After the SPAC boom and subsequent regulatory scrutiny, SPAC issuance cooled but revived with a “new generation” that is more selective and better structured. Direct listings remain an option for certain capital-rich companies seeking liquidity without a traditional roadshow. Both alternatives change timing, cost and governance dynamics of going public and have become a permanent part of the capital-raising toolkit.
3.3 Bifurcation: mega-deals vs. SME venues
Large, high-value deals (megafirms, big privatizations, resource spin-outs) dominate headline proceeds, while separate ecosystems of SME or “growth market” exchanges (AIM, TSX Venture, BSE SME, Nasdaq First North, ChiNext, STAR Market derivatives) provide tailored listing regimes for smaller issuers. The result is a two-tiered market: a handful of large capital raisings plus a broad base of smaller listings, often on specialized SME platforms. The OECD and exchanges’ research stress the importance of SME markets in sustaining job creation and innovation.
4. Regional dynamics — how different markets are behaving
United States
The U.S. equity market remains magnetically attractive for large growth and tech names: deep pools of institutional capital, active aftermarket trading, and robust underwriting capacity. Q2 2025 saw a rise in the number of U.S. IPOs compared with the previous year, though proceeds per deal varied; aftermarket performance in several 2025 IPOs added confidence for issuers. At the same time, regulatory scrutiny (e.g., around disclosures and SPAC post-dealmaking) continues to influence structures.
Hong Kong & Mainland China
Hong Kong regained momentum as a listing hub—particularly for resource and state-linked listings—benefiting from several large issuances in 2025. Mainland China’s reforms and new issuance windows for certain domestic sectors (STAR/ChiNext) continue to create localized IPO activity. The Zijin Gold HK IPO in September 2025 exemplifies Hong Kong’s ability to host very large resource and strategic listings.
Europe & UK
European IPO activity improved, helped by AIM-style venues for growth firms and regional regulatory efforts to encourage listings. Europe also sees a concerted policy push (OECD, exchanges) to strengthen SME access to public markets. Fragmentation across multiple national exchanges, however, remains a challenge for pooled liquidity.
India and other emerging markets
India’s primary market has been notably active at the SME and mainboard level, spurred by domestic savings, retail participation, and state support for IPO pipelines. Local SME segments (BSE SME, NSE Emerge) offer lower cost and scaled compliance to help smaller issuers list. Emerging markets frequently oscillate between domestic demand surges and capital flight during global risk episodes. Recent Indian weeks showed dozens of new SME and mainboard offers crowding the pipeline, indicating robust local issuance appetite.
5. SME listings: design, purpose and global models
SME listing segments are not smaller copies of main markets — they’re intentionally designed to lower entry costs, provide simpler compliance, and sequence growth. Key features include:
Lower minimum capital/float thresholds and reduced free-float requirements.
Streamlined disclosure and ongoing reporting, often calibrated to firm size and investor sophistication.
Investor protection tradeoffs: more disclosure leniency can increase risk-return variability; many SME venues require more active retail education or specialist market makers to maintain liquidity.
Support services: mentorship programs, fast-track delisting safeguards, and post-listing support such as investor outreach and sustainability guidance.
Major SME market examples: AIM (London), Nasdaq First North (Nordics), BSE SME (India), TSX Venture/CSE (Canada), ChiNext (China). OECD and UN SSE (Sustainable Stock Exchanges) initiatives increasingly recommend exchanges offer sustainability guidance to SMEs to future-proof growth and attract ESG-minded capital.
6. Why SME listings matter (economic and financial rationales)
Capital access for growth: SMEs often lack scale for institutional private rounds or high-cost bank financing — a public listing can supply growth capital and an acquisition currency (listed shares).
Price discovery & signaling: Public markets provide transparent valuation benchmarks that can aid subsequent capital raises or exits.
Market discipline & governance: Listing brings governance upgrades that can improve managers’ incentives and access to professional networks.
Local economic development: SME listings can anchor local ecosystems, create jobs, and increase tax bases — a reason regulators promote SME markets. OECD analysis emphasizes this public-good aspect.
7. Demand side: who is buying IPOs today?
Institutional investors: Long-only funds, hedge funds and sovereign wealth funds participate in larger deals; they increasingly demand strong governance credentials, clear path to profitability, and defensible competitive positions.
Retail investors: Remain a crucial source of demand for SMEs and many mainboard deals, especially where allocation rules favor retail participation (notably in India). Retail interest can create short-term pricing momentum but also volatility.
Cornerstone & long-term investors: For very large listings (e.g., resource or infrastructure spin-outs), cornerstone investors anchor deals and signal confidence — examples in 2025 include large cornerstone allocations to major institutional investors.
8. Sector dynamics — who’s going public?
Technology & AI-enabled firms: Renewed interest in tech, especially AI infrastructure and enterprise AI plays, as investors seek exposure to transformative productivity gains.
Energy and resources: With commodity price cycles and strategic national interests, energy/resource listings (including miners and renewables) have been prominent, especially where projects require capital for expansion. The Zijin Gold listing is an example of a resource IPO that tapped strong appetite.
Financial services and fintech: Continued listings as fintechs mature and pursue scale.
Healthcare & biotech: Ongoing pipeline as research hits commercial inflection points and capital needs become public market-sized.
Sector mix varies by region: e.g., Asia has substantial resource and industrial deals in some periods, while the U.S. attracts high-growth tech and healthcare companies.
Conclusion
The global IPO market in 2024–H1 2025 is not merely recovering — it is evolving. Cross-border flows, alternative listing structures (SPACs/direct listings), renewed investor appetite for certain sectors, and a robust ecosystem of SME listing venues combine to make the public markets a more versatile but also more complex place. For issuers, investors and policymakers, the main task is to match strategies to market structure: pick the right venue, be operationally ready, and design investor engagement that reflects the realities of modern capital markets. Exchanges that successfully scaffold SME access — by combining reduced barriers, investor protection, and active post-listing support — will unlock substantial long-term economic value.
Derivatives Trading in Emerging Markets1. Understanding Derivatives in Simple Terms
A derivative is essentially a financial contract whose value is derived from an underlying asset. That asset could be anything — stocks, bonds, currencies, commodities, or even interest rates.
Think of it like this:
If you and your friend bet on whether the price of gold will go up or down next month, you’ve entered into a type of derivative contract.
The bet itself has no standalone value; it derives its worth from the movement of gold prices.
The most common types of derivatives include:
Futures Contracts – Agreements to buy or sell an asset at a fixed price on a future date.
Options Contracts – Rights (but not obligations) to buy or sell an asset at a specific price before a given date.
Forwards Contracts – Custom, over-the-counter (OTC) agreements similar to futures, but privately negotiated.
Swaps – Agreements to exchange cash flows, such as fixed interest for floating interest.
In developed economies, derivatives trading is massive. The notional value of global derivatives markets runs into hundreds of trillions of dollars. But in emerging markets, the journey is still evolving.
2. Why Derivatives Matter in Emerging Markets
Emerging markets — like India, Brazil, China, South Africa, Mexico, and Turkey — are characterized by fast economic growth, higher volatility, and developing financial institutions.
Here’s why derivatives play such a crucial role in these economies:
Risk Management (Hedging)
Commodity producers (like farmers in India or oil exporters in Brazil) face price volatility. Derivatives allow them to lock in prices and reduce uncertainty.
For example, an Indian farmer can use a futures contract on wheat to protect against falling prices during harvest.
Price Discovery
Derivatives markets help determine fair prices of commodities and financial assets. Futures on stock indices or currencies often reflect real-time demand-supply expectations.
Liquidity & Market Depth
They increase participation in markets. A liquid derivatives market often boosts liquidity in the cash (spot) market as well.
Investment Opportunities
For global investors, derivatives provide exposure to emerging market growth stories without needing to directly own local stocks or bonds.
Integration with Global Finance
Derivatives connect emerging markets with global capital flows, making them part of the broader financial ecosystem.
3. Historical Development of Derivatives in Emerging Markets
The journey of derivatives in emerging economies is relatively recent compared to the U.S. or Europe. Let’s take a quick tour:
India
India banned derivatives trading in 1952 due to speculation risks.
In 2000, it reintroduced derivatives on stock indices and later expanded into single-stock futures, options, and commodity derivatives.
Today, India has one of the largest derivatives markets in the world by volume.
Brazil
BM&F Bovespa (now part of B3 exchange) has been a pioneer in Latin America.
It introduced futures contracts on commodities like coffee and later expanded into financial derivatives.
China
Initially cautious due to speculation risks, China opened derivatives trading in the 1990s.
Today, the Shanghai Futures Exchange and China Financial Futures Exchange trade a wide range of contracts.
South Africa
The Johannesburg Stock Exchange (JSE) has a robust derivatives segment, including agricultural futures.
Turkey & Mexico
Both countries have developed active currency and interest rate derivative markets, driven by macroeconomic volatility.
The common thread? Derivatives in emerging markets often start with commodities (agriculture, metals, or energy) and later expand into financial products.
4. Key Types of Derivatives in Emerging Markets
a. Commodity Derivatives
Farmers, miners, and exporters rely heavily on futures and options.
Example: Brazil’s coffee futures, India’s gold futures, and South Africa’s maize futures.
b. Equity Derivatives
Stock index futures and options are increasingly popular.
India’s Nifty50 futures are among the most traded globally.
c. Currency Derivatives
Emerging markets often face currency volatility due to capital flows.
Currency futures (like USD/INR in India) help businesses hedge exchange rate risks.
d. Interest Rate Derivatives
Less developed compared to developed nations, but growing fast.
For example, Mexico and Turkey have active interest rate swap markets due to inflation risks.
5. Opportunities in Derivatives Trading in Emerging Markets
Emerging markets present unique opportunities for traders, investors, and institutions:
High Growth Potential
As economies grow, demand for derivatives rises.
Market Inefficiencies
Emerging markets often display mispricing due to less competition, creating arbitrage opportunities.
Commodity Exposure
Emerging economies are major commodity producers. Derivatives give exposure to commodities like oil, metals, and agriculture.
Retail Participation
In markets like India, retail investors are driving growth in equity derivatives.
Global Diversification
International investors can diversify by accessing emerging market derivatives.
6. Risks and Challenges
While the opportunities are strong, derivatives in emerging markets come with risks:
Volatility
Emerging markets often face sharp price swings due to political or economic shocks.
Regulatory Uncertainty
Policies can change overnight, restricting or liberalizing derivative trading.
Liquidity Issues
Some contracts lack depth, making it hard to exit positions.
Counterparty Risk
In over-the-counter markets, the risk of default is higher.
Speculation vs. Hedging
Regulators often worry about excessive speculation destabilizing markets.
Lack of Awareness
Many small businesses or retail traders in emerging markets don’t fully understand derivatives, leading to misuse.
7. Regulatory Landscape
Regulation plays a defining role in shaping derivative markets.
India: The Securities and Exchange Board of India (SEBI) oversees derivatives trading. It has gradually opened the market but remains cautious about speculation.
Brazil: B3 Exchange operates under the Brazilian Securities and Exchange Commission (CVM).
China: The China Securities Regulatory Commission (CSRC) keeps a tight grip, limiting speculative contracts.
South Africa: The Financial Sector Conduct Authority regulates derivatives under the JSE.
A common theme is balancing market development with financial stability. Too much speculation could cause systemic risks; too much control could stifle growth.
8. Case Studies
Case 1: India’s Nifty Derivatives Boom
Nifty index futures and options dominate global trading volumes.
Low margin requirements and high retail participation fueled this growth.
Case 2: Brazil’s Coffee Futures
Brazil is the world’s largest coffee producer. Coffee futures contracts in São Paulo provide global benchmarks for pricing.
Case 3: China’s Cautious Path
China introduced stock index futures in 2010 but imposed heavy restrictions after the 2015 market crash. This shows the delicate balance regulators maintain.
9. The Future of Derivatives in Emerging Markets
The next decade could see explosive growth in emerging market derivatives:
Digital Platforms & Fintech
Online trading apps will democratize access.
ESG & Green Derivatives
New contracts may emerge around carbon credits and renewable energy.
Cross-Border Trading
Greater integration with global exchanges.
Blockchain & Smart Contracts
Could reduce counterparty risks and improve transparency.
Retail Power
Just like in India, retail traders will drive volume growth in many countries.
10. Conclusion
Derivatives trading in emerging markets is both a story of promise and caution. On one hand, these instruments help farmers, exporters, and investors hedge against volatility, improve price discovery, and connect to global finance. On the other, misuse and over-speculation can destabilize fragile economies.
For investors, derivatives in emerging markets are not just about chasing profits — they are about understanding the heartbeat of fast-growing economies. As regulations mature, technology spreads, and education improves, these markets could very well become the engines of global derivatives growth.
Oil Wars and OPEC+ Price InfluencePart 1: Oil as a Geopolitical Weapon
Oil and Global Power
Ever since oil replaced coal as the primary energy source in the early 20th century, it has been intertwined with national security, industrial growth, and military power. The British Navy’s decision in 1912 to shift from coal to oil was a strategic move that highlighted the importance of securing reliable petroleum supplies. From World War I to the Iraq wars, oil has dictated alliances, interventions, and even regime changes.
Countries with abundant oil—like Saudi Arabia, Russia, Iraq, and Venezuela—have leveraged their reserves for geopolitical clout. Conversely, nations dependent on oil imports, like the United States, China, Japan, and India, have structured much of their foreign policy around securing energy supplies.
Oil Wars: A Historical Overview
“Oil wars” are not always literal wars fought exclusively for oil, but rather conflicts where oil plays a central role in the motives, strategies, or outcomes. Some major examples include:
World War II (1939–1945): Control of oil fields was critical to the Axis and Allied powers. Germany’s failed push into the Caucasus (Operation Blue) was motivated by access to Soviet oil. Japan’s attack on Pearl Harbor was partly triggered by U.S. sanctions restricting Japanese access to oil.
The Arab-Israeli Conflicts & Oil Embargo (1973): In response to Western support for Israel during the Yom Kippur War, OPEC Arab members imposed an oil embargo. Prices quadrupled, exposing the world to the geopolitical leverage of oil producers.
The Iran-Iraq War (1980–1988): Both nations targeted each other’s oil infrastructure. Tanker wars in the Persian Gulf disrupted global supplies.
The Gulf War (1990–1991): Iraq’s invasion of Kuwait was directly linked to control of oil wealth. The U.S.-led coalition intervened not only for sovereignty but also to secure global oil markets.
The Iraq War (2003): While debated, many analysts argue that oil interests influenced the U.S. decision to invade Iraq, reshaping Middle Eastern energy politics.
Syrian Civil War (2011–present): Control of oil fields and pipelines became central for different factions, with global powers eyeing energy routes as well.
Russia-Ukraine Conflict (2014–present, escalated 2022): While largely territorial and political, oil and gas pipelines have been weapons in Russia’s economic standoff with Europe. Sanctions on Russian crude reshaped global trade flows.
These conflicts illustrate that oil wars are not simply about owning oil fields—they are about controlling global supply routes, ensuring market access, and weaponizing energy for diplomatic or military leverage.
Part 2: Birth and Evolution of OPEC
Why OPEC Was Formed
By the mid-20th century, the oil industry was dominated by Western multinational corporations—the so-called “Seven Sisters” (Exxon, Shell, BP, Chevron, Gulf, Texaco, Mobil). They controlled exploration, production, and pricing, while oil-producing nations received minimal returns.
In response, five countries—Saudi Arabia, Iran, Iraq, Kuwait, and Venezuela—founded the Organization of Petroleum Exporting Countries (OPEC) in 1960 in Baghdad. Their goal was simple: to coordinate policies and secure fairer revenues.
OPEC’s Early Years
Initially underestimated, OPEC gained prominence after the 1973 oil crisis when Arab members used production cuts and embargoes as political tools. This event showcased OPEC’s ability to shock the global economy. Oil prices skyrocketed, inflation surged worldwide, and industrial nations realized their vulnerability.
In the 1980s, however, OPEC’s unity was challenged. Internal rivalries, cheating on quotas, and external pressures (like North Sea oil discoveries) weakened its control. Yet, OPEC retained the role of a “swing producer,” particularly through Saudi Arabia, which used its massive spare capacity to balance markets.
Part 3: OPEC+ and the Modern Oil Market
The Birth of OPEC+
By the 2000s, OPEC alone could not fully control prices due to the rise of non-OPEC producers, especially Russia, the U.S. (shale oil), and Canada. In 2016, in the aftermath of the oil price crash triggered by shale oil oversupply, OPEC allied with non-OPEC producers, most notably Russia, Kazakhstan, and Mexico, forming OPEC+.
This alliance was critical in rebalancing markets through coordinated production cuts. Russia brought immense weight to the group as the world’s second-largest crude exporter, while Saudi Arabia retained its role as leader.
How OPEC+ Influences Prices
OPEC+ does not directly set prices; instead, it influences them through production targets. By cutting supply, they push prices up; by raising production, they cool markets. Key mechanisms include:
Production Quotas: Members agree on collective output ceilings.
Spare Capacity: Saudi Arabia and UAE often adjust supply to stabilize markets.
Market Communication: Even announcements and forward guidance move prices, as traders react to perceived scarcity or abundance.
Emergency Meetings: OPEC+ convenes when crises—such as the COVID-19 pandemic or Russia-Ukraine war—disrupt markets.
Major OPEC+ Interventions
2016 Production Cuts: After oil crashed below $30 per barrel, OPEC+ cut 1.8 million barrels per day (mbpd), reviving prices.
COVID-19 Crash (2020): Oil demand collapsed, and at one point, U.S. crude futures went negative. OPEC+ enacted historic cuts of nearly 10 mbpd to stabilize markets.
Russia-Ukraine War (2022): With sanctions on Russia, OPEC+ resisted Western pressure to raise output, choosing instead to support Russia and maintain stability for producers. Prices surged above $120 before stabilizing.
2023–2025 Cuts: OPEC+ has continued voluntary cuts, particularly by Saudi Arabia and Russia, to defend price levels against slowing global demand and rising U.S. shale output.
Part 4: Oil Wars Meet OPEC+—A Symbiotic Relationship
Oil wars and OPEC+ decisions often overlap. For instance:
During the Iran-Iraq War, OPEC struggled to maintain unity as members fought each other.
The Gulf War pushed OPEC to stabilize supply after Kuwait’s oil fields were set ablaze.
The U.S.-Russia standoff over Ukraine has forced OPEC+ to navigate geopolitical divisions while maintaining production discipline.
Thus, OPEC+ not only manages economics but also absorbs the shocks of oil wars, sometimes exploiting them to strengthen its influence.
Part 5: The Economics of Price Influence
Why Prices Matter
Oil is not just a commodity; it’s a macroeconomic driver. Prices affect:
Producer Nations: High prices boost revenues for OPEC+ states, funding budgets and political stability. Low prices create deficits and unrest.
Consumer Nations: Importers like India, China, and Europe face inflation, trade deficits, and currency pressures when oil rises.
Global Trade: Since oil is priced in dollars, higher prices strengthen the U.S. dollar and worsen debt burdens for emerging markets.
The Price Band Strategy
OPEC+ has often targeted a “comfortable” price band, usually between $70 and $100 per barrel. Too low hurts their revenues; too high accelerates renewable adoption and incentivizes rival production. The art of OPEC+ strategy lies in maintaining this balance.
Part 6: Challenges Facing OPEC+
Despite its success, OPEC+ faces growing challenges:
U.S. Shale Oil: Flexible and responsive, U.S. shale producers ramp up output when prices rise, capping OPEC+’s influence.
Energy Transition: With the world shifting to renewables, long-term demand for oil may peak within decades, pressuring producers to maximize current revenues.
Internal Unity: Not all OPEC+ members comply with quotas. Political rivalries (Saudi-Iran, Russia-Saudi tensions) threaten cohesion.
Geopolitical Pressures: Western nations often accuse OPEC+ of manipulating markets, sometimes threatening antitrust actions.
Global Economic Slowdowns: Recessions and crises, like COVID-19, reduce demand, testing OPEC+’s ability to respond.
Part 7: The Future of Oil Wars and OPEC+
Looking ahead, oil will remain strategically vital even as renewables grow. Three possible scenarios unfold:
Continued Relevance: OPEC+ maintains its dominance through discipline and coordination, ensuring prices stay profitable.
Fragmentation: Internal rivalries and external competition weaken OPEC+, reducing its control.
Transition Era Wars: As global demand slows, competition for shrinking market share could trigger new oil wars, especially in regions like the Middle East and Africa.
At the same time, OPEC+ is exploring cooperation in renewable energy investments, hedging against a post-oil future. Yet for now, the cartel remains the single most important force in shaping global energy markets.
Conclusion
The history of oil is the history of power, conflict, and economic influence. From wars fought over fields and pipelines to the coordinated strategies of OPEC+, the price of oil has never been left to free markets alone. Instead, it has been molded by both bloodshed and diplomacy.
Oil wars remind us of the destructive potential when energy becomes a weapon of conflict. OPEC+ illustrates the stabilizing—or destabilizing—impact of collective price management. Together, they show that oil is far more than fuel; it is leverage, influence, and survival.
As the world transitions toward cleaner energy, the influence of oil may eventually decline. But in the foreseeable future, oil wars and OPEC+ price influence will remain at the core of global economics and geopolitics—deciding the fates of nations and the rhythm of the world economy.

Currency Wars Between Major Economies1. What is a Currency War?
A currency war (sometimes called “competitive devaluation”) occurs when countries deliberately try to devalue their own currencies in order to:
Make exports cheaper and more attractive in global markets.
Reduce the relative cost of domestic production compared to foreign competitors.
Improve trade balances by discouraging imports.
Stimulate domestic economic growth in times of slowdown.
The central idea is: a weaker currency helps exporters and supports jobs at home, but it often comes at the expense of trading partners.
However, currency wars are not always explicit. Sometimes they result from domestic monetary policies (like cutting interest rates or expanding money supply through quantitative easing) that incidentally weaken a currency. In other cases, governments openly intervene in foreign exchange markets, buying or selling large amounts of currency to influence exchange rates.
2. The Historical Roots of Currency Wars
a) The 1930s: The Great Depression and the “Beggar-Thy-Neighbor” Policies
The first widely recognized currency war took place during the Great Depression. In the 1930s, demand collapsed worldwide, unemployment skyrocketed, and countries scrambled to protect their industries.
Britain left the Gold Standard in 1931, devaluing the pound to boost exports.
The U.S. followed in 1933 under President Franklin D. Roosevelt, devaluing the dollar against gold.
Other nations like France, Germany, and Japan also adjusted their exchange rates.
This competitive devaluation became known as a “beggar-thy-neighbor” policy, where one country’s gain came at the expense of others. Instead of solving the crisis, it deepened global tensions and reduced cooperation — contributing indirectly to the geopolitical instability that led to World War II.
b) Bretton Woods and the Post-War Era
After World War II, leaders sought to prevent a repeat of destructive currency conflicts. In 1944, the Bretton Woods Agreement created a system of fixed exchange rates anchored to the U.S. dollar, which itself was pegged to gold.
This system promoted stability, but it had cracks:
Countries with trade surpluses (like Germany and Japan) accumulated reserves, while deficit nations (like the U.S.) faced growing pressure.
By 1971, the U.S. under President Richard Nixon ended dollar convertibility to gold — known as the Nixon Shock.
This collapse of Bretton Woods unleashed a new era of floating exchange rates, opening the door again for currency maneuvering.
c) The Plaza Accord (1985)
One of the most famous episodes of currency coordination (and conflict) came in the 1980s. The U.S. dollar had become excessively strong, hurting American exporters and creating huge trade deficits.
In 1985, the Plaza Accord was signed by the U.S., Japan, West Germany, France, and the U.K. The agreement coordinated efforts to weaken the U.S. dollar and strengthen other currencies like the Japanese yen and German Deutsche mark.
This marked a rare moment of cooperation in a currency conflict. However, the yen’s sharp appreciation later contributed to Japan’s asset bubble and “lost decades” of economic stagnation.
3. Tools Used in Currency Wars
Major economies deploy several instruments when waging currency wars:
a) Monetary Policy
Interest Rate Cuts: Lower rates reduce returns on investments in a currency, weakening its value.
Quantitative Easing (QE): Central banks create money to buy government bonds, expanding liquidity and pushing the currency downward.
b) Direct Market Intervention
Central banks buy or sell currencies in massive volumes. For example, China has historically purchased U.S. dollars to keep the yuan weaker and boost exports.
c) Trade Policies
Tariffs, subsidies, and capital controls can indirectly pressure currency values.
d) Capital Controls
Restricting or encouraging flows of foreign capital influences currency demand.
e) Rhetorical Pressure
Leaders often use verbal intervention — statements signaling that they prefer weaker or stronger currencies — to sway markets.
4. Major Episodes of Currency Wars in the Modern Era
a) The 2008 Global Financial Crisis and “Currency War II”
After the 2008 financial meltdown, the U.S. Federal Reserve launched unprecedented quantitative easing. The massive expansion of money supply weakened the dollar, making U.S. exports more competitive.
Emerging economies, particularly Brazil, India, and China, complained that the U.S. was effectively waging a currency war. Brazil’s Finance Minister Guido Mantega famously declared in 2010 that the world was in the midst of a “currency war” triggered by U.S. policies.
Other countries responded:
Japan intervened to prevent yen appreciation.
Switzerland capped the Swiss franc’s value against the euro to protect exporters.
China maintained tight control over the yuan’s value.
b) U.S.–China Currency Tensions
The U.S. has long accused China of deliberately undervaluing its currency to gain trade advantages. By pegging the yuan to the dollar and intervening heavily in markets, China kept its exports competitive.
In 2019, during the U.S.–China trade war, the U.S. Treasury officially labeled China a “currency manipulator”.
Though the label was later removed, the tension highlighted how currency policies are deeply tied to geopolitical rivalries.
c) Eurozone and Japan in the 2010s
The European Central Bank (ECB) and the Bank of Japan (BOJ) also engaged in aggressive monetary easing. Both sought to stimulate sluggish economies and raise inflation. The result was a weaker euro and yen — moves criticized by trading partners who saw them as currency manipulation.
5. Winners and Losers in Currency Wars
Currency wars create complex outcomes:
Winners:
Exporters: A weaker currency boosts competitiveness abroad.
Industries with excess capacity: Can offload products internationally.
Countries with high unemployment: Export growth creates jobs.
Losers:
Import-dependent economies: Weaker currencies make imported goods (like oil, technology, or raw materials) more expensive.
Consumers: Face higher prices for foreign goods.
Global stability: Currency wars often fuel retaliatory trade wars.
6. The Geopolitical Dimension of Currency Wars
Currency values are not just about economics — they are tools of power.
The U.S. Dollar: As the world’s reserve currency, the dollar’s strength or weakness has global ripple effects. Dollar dominance gives the U.S. a unique ability to run deficits and still attract capital.
China’s Yuan: Beijing aims to internationalize the yuan, challenging dollar supremacy. Currency management is part of its broader geopolitical ambition.
Euro and Yen: Represent regional stability and serve as counterweights in financial markets.
Emerging Markets: Often caught in the crossfire, suffering from volatile capital flows and inflation risks when major economies manipulate currencies.
7. Are We in a Currency War Today?
As of the 2020s, elements of currency competition are visible:
Post-COVID Stimulus: Massive monetary easing in the U.S., Europe, and Japan initially weakened currencies, though inflation later forced tightening.
Dollar Strength (2022–2024): The U.S. dollar surged due to aggressive Federal Reserve rate hikes, putting pressure on emerging markets with dollar-denominated debt.
China’s Slowdown: China has allowed the yuan to weaken at times to support exports amid slowing domestic demand.
De-Dollarization Trends: BRICS nations and others are exploring alternatives to the dollar, signaling future battles over currency influence.
8. The Risks of Currency Wars
Currency wars may provide temporary relief for domestic economies, but they carry significant risks:
Trade Wars: Competitive devaluation often spills into tariffs and protectionism.
Inflation: Weaker currencies make imports costlier, fueling inflation.
Financial Instability: Rapid capital flight from weaker currencies can destabilize economies.
Loss of Credibility: Persistent manipulation undermines trust in a nation’s financial system.
Global Tensions: Currency disputes exacerbate geopolitical rivalries.
9. Pathways to Cooperation
While conflict is common, cooperation remains possible:
IMF Surveillance: The International Monetary Fund monitors exchange rate policies to discourage manipulation.
Currency Swap Agreements: Central banks often collaborate to provide liquidity in crises.
Multilateral Dialogues: Platforms like the G20 discuss currency issues to prevent escalation.
Global Reserve Diversification: Gradual movement toward a multipolar currency system (dollar, euro, yuan) may reduce tensions.
10. The Future of Currency Wars
Looking ahead, several themes will shape the currency battles of the future:
U.S.–China Rivalry: The yuan’s internationalization vs. dollar dominance will remain central.
Digital Currencies: Central Bank Digital Currencies (CBDCs) could reshape currency competition. China is already ahead with its digital yuan.
Geopolitical Fragmentation: As regional blocs (BRICS, ASEAN, EU) strengthen, multiple currency spheres of influence may emerge.
Energy and Commodities: Countries like Russia are pushing for non-dollar trade in oil and gas, tying currencies directly to resource power.
Technology and Finance: Cryptocurrencies and fintech innovations may add another dimension to currency wars.
Conclusion
Currency wars are a recurring feature of the global economy, blending economics, politics, and power. From the Great Depression’s competitive devaluations to the modern U.S.–China rivalry, these wars reveal how deeply currencies influence trade, growth, and geopolitics.
While a weaker currency may provide short-term relief to struggling economies, the long-term costs often outweigh the gains. Inflation, financial instability, and rising tensions are frequent outcomes. True stability requires cooperation, transparency, and reforms in the global monetary system.
In the 21st century, the battlefield of currency wars is shifting. It is no longer just about exchange rates, but about digital currencies, technological control, and global influence. Whether the future brings cooperation or deeper conflict depends on how major economies balance national interests with global stability.

Ethereum Elliott Wave Buy Setup: Targets 4550 and 4600Ethereum Daily Update (Elliott Wave Setup)
Based on my daily monitoring of Ethereum and according to the Elliott Wave count (which I’ll share shortly with the full analysis), I see a long opportunity forming.
Here’s my personal trade plan:
✅ Entry 1: Buy from current price 4450 / 4445
✅ Entry 2: If price dips, add another buy at 4400
🎯 Target 1: 4550
🎯 Target 2: 4600
Stop-loss: For both entries, a daily close below 4350
Please note:
This is not financial advice – I’m only sharing my personal trades.
Always do your own research before taking action.
👍 Don’t forget to like if you found this useful, and feel free to follow me for more analysis of this kind.
Best of luck 🌹

High-Risk, High-Reward: In Emerging Market1. Understanding Emerging Markets
Emerging markets are countries whose economies are transitioning from being primarily agricultural or resource-based to more industrialized, urbanized, and globally integrated. Unlike developed economies, these markets are still building infrastructure, regulatory frameworks, and financial institutions, which means they have enormous growth potential—but also higher uncertainty.
Key characteristics of emerging markets include:
Rapid Economic Growth: These economies can grow at double the pace of developed markets due to industrialization, urban migration, and modernization.
Young and Expanding Population: Many emerging markets have a demographic advantage—a large, youthful labor force that can drive productivity and consumption.
Growing Middle Class: As incomes rise, more people enter the middle class, increasing demand for consumer goods, financial services, real estate, healthcare, and technology.
Global Integration: These countries are increasingly participating in global trade, foreign direct investment (FDI), and capital markets. This integration can accelerate growth but also exposes them to global shocks.
Examples of major emerging markets include China, India, Brazil, Russia, and South Africa, but there are many others like Vietnam, Indonesia, Nigeria, and Mexico. Each has its own economic structure, political system, and investment landscape.
2. Why Investors Are Attracted to Emerging Markets
The attraction of emerging markets lies in their potential for outsized returns. Historically, investors who correctly timed their entry into emerging economies enjoyed growth rates far above what was possible in developed markets. Some reasons include:
High GDP Growth Rates: While developed countries often grow at 2–3% annually, emerging markets can achieve 5–8% or more, compounding wealth faster.
Undervalued Assets: Stock markets, real estate, and bonds in these regions are often undervalued relative to their growth potential.
Demographic Dividend: Young populations are more adaptable, tech-savvy, and entrepreneurial, fueling innovation and consumption.
Infrastructure Development: Rapid urbanization and government-led projects create investment opportunities in construction, energy, transport, and telecommunications.
Innovation and Entrepreneurship: Startups in tech, fintech, e-commerce, and healthcare are growing exponentially, often with low competition initially.
The combination of high growth, untapped potential, and early-stage investment opportunities explains why high-risk investors are drawn to these markets.
3. Investment Opportunities in Emerging Markets
Emerging markets offer multiple avenues for investment, each with its own risk-return profile.
3.1 Equity Markets
Investing in local companies or exchange-traded funds (ETFs) that focus on emerging markets is one of the most common strategies. Equities offer:
High Potential Returns: Fast-growing companies can multiply in value as markets expand.
Sectoral Diversity: Investors can choose from consumer goods, technology, healthcare, energy, and financial sectors.
Stock Market Reforms: Many emerging markets are improving transparency, governance, and market infrastructure, making equity investment more attractive.
Example: Investing in India’s technology companies in the early 2000s or Brazil’s consumer sector in the 2010s generated massive returns.
3.2 Fixed Income Securities
Bonds in emerging markets, issued by governments or corporations, offer higher yields than those in developed economies. Benefits include:
Attractive Interest Rates: Emerging market bonds often pay higher coupons to compensate for risk.
Diversification: Adding emerging market debt can reduce overall portfolio risk if correlated carefully with developed market assets.
Local Currency Opportunities: For investors willing to take currency risk, local-denominated bonds can boost returns.
Risks: Political instability, inflation, and currency depreciation can erode returns.
3.3 Real Estate
Rapid urbanization, industrialization, and growing middle classes create strong demand for residential, commercial, and industrial properties.
Residential Real Estate: Cities expanding quickly often experience housing shortages, creating investment potential in apartments and housing projects.
Commercial Real Estate: Offices, retail spaces, and industrial parks grow with urban economies and FDI inflows.
REITs and Funds: Real estate investment trusts focused on emerging markets allow investors to participate with lower capital requirements.
3.4 Private Equity and Venture Capital
Startups in emerging markets can offer enormous upside. Sectors like fintech, healthtech, e-commerce, and renewable energy are booming.
Early-Stage Investment: Entering early allows for potentially exponential growth.
Innovation and Market Gaps: Many sectors remain underdeveloped, leaving room for disruptive business models.
Partnerships with Local Entrepreneurs: Working with local founders provides market knowledge and increases the likelihood of success.
Challenges: High failure rates, regulatory hurdles, and exit risks if local capital markets are underdeveloped.
3.5 Commodities
Many emerging markets are resource-rich. Investing in commodities such as oil, metals, agricultural products, and energy infrastructure can be profitable.
Natural Resources: Countries like Brazil (soybeans), Russia (oil and gas), and South Africa (minerals) have global export potential.
Rising Global Demand: Growing populations in emerging markets themselves increase internal demand for commodities.
Risks: Commodity prices are volatile and dependent on global supply-demand dynamics.
4. Risks of Investing in Emerging Markets
While the opportunities are substantial, risks are equally significant. Emerging markets are high-risk by nature due to several factors:
4.1 Political Instability
Sudden policy changes, coups, corruption, or civil unrest can wipe out investments. Governments may alter regulations affecting foreign investors, taxation, or property rights.
4.2 Currency Volatility
Exchange rate fluctuations can erode returns for foreign investors. A strong dollar, inflation, or balance-of-payments crisis can lead to sudden depreciation of local currency.
4.3 Economic Vulnerabilities
Emerging markets may be heavily dependent on commodities, exports, or foreign capital. Global economic shocks, trade wars, or declining commodity prices can significantly impact growth.
4.4 Market Liquidity
Financial markets may be less liquid, with fewer buyers and sellers, leading to price swings. Large transactions can move markets, and exiting investments quickly may be difficult.
4.5 Regulatory Risks
Legal systems may be underdeveloped or inconsistent. Intellectual property rights, contract enforcement, and investor protections may not be strong, increasing business risks.
5. Strategies for Mitigating Risk
Investing successfully in emerging markets requires careful planning, research, and risk management.
5.1 Diversification
Spread investments across countries, sectors, and asset classes.
Avoid concentrating exposure in one country or industry.
5.2 Thorough Research
Understand local economics, politics, culture, and regulations.
Analyze companies, market trends, and financial statements carefully.
5.3 Local Partnerships
Collaborate with local firms, advisors, or entrepreneurs.
They can provide insights into market dynamics, consumer behavior, and regulatory compliance.
5.4 Hedging
Use derivatives, currency hedges, or funds to protect against volatility.
Hedging can mitigate currency, interest rate, and commodity risks.
5.5 Long-Term Perspective
Be prepared for short-term volatility.
Focus on long-term growth potential, riding out market cycles.
Conclusion
Investing in emerging markets is a balancing act between enormous opportunity and significant risk. These markets can create wealth faster than developed economies, but volatility, political uncertainty, and regulatory weaknesses make caution essential.
For investors with the knowledge, patience, and discipline to navigate these markets, the rewards can be extraordinary. By diversifying investments, conducting thorough research, partnering with local experts, and maintaining a long-term perspective, investors can capture the growth potential while mitigating the inherent risks.
Emerging markets are not for everyone—but for those willing to embrace uncertainty intelligently, they offer a chance to be part of the next wave of global economic transformation.

Trading Strategies and Index Investing1. Introduction to Trading and Investing
At its core, trading is the act of buying and selling financial instruments—stocks, derivatives, currencies, or commodities—over short periods to profit from market fluctuations. Traders thrive on volatility and market movements, exploiting them with precise timing and strategy.
Investing, on the other hand, involves committing capital to financial assets with the expectation of long-term growth. Investors focus on fundamental analysis, value creation, and compounding returns over years or decades.
A sub-category of investing, index investing, is the practice of buying index funds or exchange-traded funds (ETFs) that track a market index, such as the S&P 500, Nifty 50, or Dow Jones Industrial Average. This approach simplifies portfolio management, reduces risk through diversification, and aligns with long-term wealth-building strategies.
While trading and investing may appear divergent, they are interconnected. Understanding both allows market participants to develop flexible strategies that balance risk and reward.
2. Understanding Trading Strategies
Trading strategies are structured approaches to buying and selling assets. Traders use them to capitalize on short-term price movements. These strategies vary widely in duration, complexity, and risk tolerance.
2.1 Types of Trading Strategies
Day Trading
Day traders buy and sell securities within the same trading day. They aim to profit from intraday price movements.
Techniques Used: Technical analysis, chart patterns, momentum indicators, and high-volume stocks.
Example: Buying a stock in the morning after observing a breakout pattern and selling before market close.
Swing Trading
Swing traders hold positions for several days or weeks to capitalize on short-term trends.
Techniques Used: Moving averages, RSI (Relative Strength Index), MACD (Moving Average Convergence Divergence), and Fibonacci retracement.
Example: Buying a stock when it dips to a support level and selling when it reaches resistance.
Scalping
Scalping is a high-frequency, ultra-short-term strategy aiming for small profits multiple times a day.
Techniques Used: Order book analysis, bid-ask spread, and micro-trends.
Example: Entering a trade to capture a 0.5% price movement repeatedly.
Position Trading
Position traders hold positions for months or even years. This is more aligned with investing but with a trading mindset.
Techniques Used: Technical trends, economic indicators, and long-term chart patterns.
Example: Investing in a technology stock for 12 months based on growth projections.
Algorithmic Trading
Uses computer algorithms to execute trades automatically based on predefined criteria.
Techniques Used: Quantitative models, machine learning, backtesting, and high-frequency trading.
Example: A bot programmed to buy stocks when the 50-day moving average crosses above the 200-day moving average.
2.2 Key Principles of Trading
Risk Management: Traders must define stop-loss and target levels to protect capital.
Discipline: Following strategies without emotional interference is critical.
Market Analysis: Combining technical and fundamental analysis improves decision-making.
Liquidity Awareness: Trading assets with high liquidity ensures smoother entry and exit points.
2.3 Tools Used in Trading
Technical Indicators: RSI, MACD, Bollinger Bands, and moving averages help spot trends.
Chart Patterns: Head & shoulders, double tops, and triangles indicate potential reversals or breakouts.
News and Events: Earnings reports, economic data, and geopolitical developments impact market sentiment.
Trading Platforms: Real-time data, analytics tools, and order execution software are essential.
3. Understanding Index Investing
Index investing is a long-term strategy aimed at replicating the performance of a market index rather than picking individual stocks. This method offers diversification, cost-efficiency, and lower risk.
3.1 What is an Index?
A market index is a statistical measure that reflects the performance of a specific group of securities. Examples include:
S&P 500 (USA): Represents 500 large-cap U.S. companies.
Nifty 50 (India): Tracks 50 major Indian companies.
Dow Jones Industrial Average: Monitors 30 prominent U.S. companies.
Investors can buy index funds or ETFs to replicate these indices without having to purchase individual stocks.
3.2 Advantages of Index Investing
Diversification: Exposure to multiple stocks reduces risk compared to investing in a single company.
Lower Costs: Passive management reduces transaction and management fees.
Consistent Returns: Historically, broad-market indices tend to grow steadily over time.
Simplicity: Investors don’t need to analyze individual stocks continuously.
3.3 Types of Index Funds
Mutual Fund Index Funds: Professionally managed funds tracking specific indices.
Exchange-Traded Funds (ETFs): Trade like stocks and mimic index performance.
Sector-Specific Index Funds: Track specific sectors like technology or energy.
3.4 Index Investing Strategies
Buy-and-Hold: Purchase an index fund and hold it for decades, allowing compounding to work.
Dollar-Cost Averaging (DCA): Invest fixed amounts regularly to smooth out market volatility.
Rebalancing: Adjust portfolio weights periodically to maintain desired risk levels.
Dividend Reinvestment: Reinvest dividends from index funds to accelerate growth.
4. Combining Trading and Index Investing
While trading seeks short-term gains and index investing targets long-term growth, combining both can enhance portfolio performance.
4.1 Tactical Asset Allocation
Investors can allocate a portion of their portfolio to active trading while keeping the majority in index funds for stability. This balances growth potential with risk management.
4.2 Hedging Strategies
Traders can hedge index investments using derivatives like options and futures to protect against market downturns. For example:
Buying put options on an index fund to limit potential losses.
Using futures contracts to hedge exposure during periods of high volatility.
4.3 Sector Rotation
Traders can actively switch exposure among sectors while keeping the core of their portfolio in broad-market indices. This exploits cyclical trends while maintaining long-term market alignment.
5. Risk Management in Trading and Index Investing
Effective risk management is vital to prevent catastrophic losses.
5.1 Trading Risk Management
Stop-Loss Orders: Automatically sell an asset when it reaches a predefined price.
Position Sizing: Allocate capital proportionally to the risk level of each trade.
Diversification: Avoid over-concentration in a single asset or sector.
5.2 Index Investing Risk Management
Diversification Across Indices: Spread investments across multiple indices to reduce systemic risk.
Global Exposure: Include international index funds to hedge against domestic market volatility.
Rebalancing: Maintain the portfolio’s risk profile by adjusting asset allocation periodically.
6. Behavioral Factors in Trading and Investing
Human psychology plays a significant role in both trading and investing:
Greed and Fear: Traders often make impulsive decisions during market extremes.
Loss Aversion: Investors may hold losing positions too long due to emotional attachment.
Overconfidence: Excessive trading can reduce long-term returns.
Discipline and Patience: Successful investors and traders follow strategies systematically.
Understanding these biases helps individuals maintain rational decision-making.
Conclusion
Both trading strategies and index investing play essential roles in modern financial markets. While trading offers opportunities for short-term gains, index investing provides long-term wealth accumulation with lower risk. Understanding their principles, risk factors, and tools enables market participants to build a balanced portfolio that combines growth, stability, and flexibility.
By integrating the tactical precision of trading with the steady compounding of index investing, investors can navigate the complexities of financial markets with confidence, resilience, and strategic foresight.
The Dollar Dominance: How U.S. Currency Shapes Global TradeIntroduction: The Power of a Currency
Imagine a single currency that influences nearly every corner of global trade, from oil shipments in the Middle East to the price of wheat in the American Midwest. That currency is the U.S. dollar (USD), and its dominance is more than a matter of convenience—it is a pillar of global economic stability. The dollar is not just another currency; it is the benchmark for international finance, the reference point for commodities, and the primary currency in which countries hold their foreign reserves. Understanding the dollar’s influence means understanding how the global economy functions, how nations interact financially, and how the U.S. leverages its economic position.
Historical Roots of Dollar Dominance
The journey of the dollar to global supremacy did not happen overnight. Its rise is deeply intertwined with history, economics, and geopolitics.
Post-War Foundations
After World War II, much of Europe and Asia lay in ruins. The United States, relatively unscathed and economically robust, became the world's largest creditor and industrial power. This economic preeminence positioned the U.S. dollar as a natural choice for global trade.
The pivotal moment came with the Bretton Woods Agreement of 1944, which created a new international monetary system. Under Bretton Woods:
The U.S. dollar was pegged to gold at $35 per ounce.
Other major currencies were pegged to the dollar.
The International Monetary Fund (IMF) and the World Bank were established to support global economic stability.
This system made the dollar the linchpin of global finance. Countries needed dollars for trade and reserves, cementing its dominance.
Post-Gold Standard Era
In 1971, President Richard Nixon ended the direct convertibility of the dollar to gold, a move that could have destabilized its global role. Surprisingly, the dollar maintained its dominance. Why? Because:
The U.S. economy remained the largest and most stable.
Financial markets in the U.S. were deep, transparent, and liquid.
Global trust in U.S. institutions persisted.
Even without gold backing, the dollar had become the default currency for global trade.
How the Dollar Shapes Global Trade
The influence of the dollar manifests in several tangible ways. From trade transactions to financial policies, the USD permeates international commerce.
Trade Invoicing and Settlement
Roughly half of global trade transactions are denominated in dollars. This means whether a European company buys oil from Saudi Arabia or imports machinery from China, the dollar often serves as the currency of choice.
Why is this significant?
Simplifies Transactions: Using a single currency reduces the need for constant currency conversions.
Reduces Risk: Companies are shielded from exchange rate volatility.
Provides Transparency: Prices in dollars make international trade comparable and standardized.
Commodity markets are a prime example. Oil, gold, copper, and many agricultural products are priced almost exclusively in USD. This “petrodollar” system, particularly for oil, forces nations to hold substantial dollar reserves to participate in global trade.
Foreign Exchange Reserves
Central banks worldwide keep a large portion of their reserves in dollars. According to the IMF:
About 58% of global foreign exchange reserves are held in USD.
U.S. Treasury securities are a preferred investment for governments seeking safety and liquidity.
These reserves are not idle—they allow countries to stabilize their own currencies, fund imports, and manage economic shocks. In essence, the dollar serves as a global financial safety net.
Financial Markets and Investment
U.S. financial markets are the largest and most liquid in the world. Foreign governments, corporations, and investors pour money into:
U.S. Treasury bonds
Equities
Real estate
Corporate debt
Investing in USD-denominated assets ensures stability and predictability. This cycle reinforces the dollar’s dominance: international demand for U.S. assets strengthens the currency, which in turn supports its use in trade.
Dollarization and Currency Pegs
Some countries adopt the dollar directly or peg their currencies to it:
Dollarization: Official use of the USD as legal tender (e.g., Ecuador, El Salvador).
Currency Pegs: Linking local currency to USD to maintain stability (e.g., many Gulf and Caribbean nations).
These practices reduce inflation risks and provide economic stability, particularly for nations with historically volatile currencies.
Geopolitical Implications of Dollar Dominance
The dollar’s dominance is not just an economic phenomenon—it’s a geopolitical tool.
U.S. Economic Leverage
Because the USD is central to global finance:
The U.S. can borrow in its own currency at low interest rates.
U.S. monetary policies, such as interest rate changes, ripple globally.
Economic sanctions are more effective because many international transactions involve USD and thus fall under U.S. jurisdiction.
In short, the dollar gives the U.S. both economic influence and geopolitical power.
Challenges from Other Currencies
Despite its dominance, alternatives are emerging:
Chinese yuan: China has signed numerous currency swap agreements and encourages yuan usage in trade.
Euro and other regional currencies: Some regional trade agreements promote alternatives to the dollar.
However, obstacles remain:
Limited liquidity and convertibility of non-dollar currencies.
Established trust in the dollar is hard to replace.
Geopolitical tensions may slow adoption of alternatives.
Technology and the Digital Revolution
Emerging technologies could disrupt traditional currency dominance:
Central Bank Digital Currencies (CBDCs): China is pioneering the digital yuan, potentially making cross-border transactions easier.
Cryptocurrencies: While decentralized, they face regulatory hurdles and lack widespread trust.
Digital currencies may challenge the dollar in niche markets, but a full-scale replacement is unlikely in the near future.
The Dollar and Global Trade Crises
History shows the dollar plays a stabilizing role during crises:
Oil Shocks: Countries with USD reserves can continue purchasing energy even during price spikes.
Financial Crises: During 2008, central banks lent dollars to stabilize local banks.
Geopolitical Conflicts: Dollar dominance helps maintain international trade flows even amid sanctions or regional instability.
The dollar acts as a global anchor, providing confidence when uncertainty arises.
Risks and Limitations
While the dollar is dominant, it faces risks:
U.S. Debt Levels: Rising national debt could undermine confidence in the dollar.
Inflationary Pressures: Persistent inflation may weaken purchasing power globally.
Political Uncertainty: Instability in U.S. policies could ripple through global markets.
Technological Disruption: Digital currencies and decentralized finance could erode traditional dollar use.
Despite these risks, no currency currently offers a viable alternative at the scale and liquidity of the USD.
The Future of Dollar Dominance
Predicting the dollar’s future requires looking at multiple factors:
U.S. Economic Strength: Sustained growth, low inflation, and strong institutions will maintain confidence.
Global Politics: Stability encourages continued reliance on the USD.
Financial Innovation: Adoption of digital solutions could reinforce or challenge dollar dominance.
Competition: China’s yuan or digital currencies may slowly chip away at dollar supremacy, but any change will be gradual.
The dollar’s role is likely to remain central in the foreseeable future, though its share of global reserves may evolve.
Conclusion: More Than Just Money
The U.S. dollar is more than a currency—it is the backbone of global trade. Its dominance simplifies international transactions, stabilizes economies, and empowers the United States with unparalleled economic influence. For nations around the world, holding and trading in dollars is both practical and necessary.
While challenges exist—from geopolitical shifts to technological innovations—the dollar’s entrenched position is resilient. Its story is not just about money, but about trust, stability, and the interwoven fabric of the global economy.
Understanding the dollar means understanding the world economy itself: how trade flows, how nations interact, and how financial power is distributed. The dollar is, in every sense, the world’s common language of trade.
From Barter to Blockchain: The Evolution of the World EconomyPart I: The Age of Barter – Foundations of Exchange
1. The Nature of Barter
Barter was the earliest form of trade. In primitive societies, people exchanged what they had in surplus for what they lacked. A farmer with extra grain might trade with a potter who could provide cooking vessels. A shepherd could exchange wool for salt from a coastal trader.
Barter was built on trust and immediate need. But while it served as the foundation of early economies, it had major limitations:
Double Coincidence of Wants: Both parties had to want what the other had at the same time.
Indivisibility: Some goods couldn’t be easily divided (you couldn’t trade half a cow).
Lack of Standard Value: No universal way to measure how many pots equaled one sheep.
Perishability: Many goods (grain, fish, fruit) couldn’t be stored long enough to retain value.
Despite its inefficiencies, barter laid the groundwork for trade and specialization. It fostered relationships, built early markets, and prepared the way for more sophisticated systems.
2. Social and Cultural Dimensions of Barter
Barter wasn’t just economic; it was cultural. Exchanges often happened within rituals, festivals, and ceremonies. In some tribes, barter carried symbolic meaning—gifts exchanged not only for material benefit but also to strengthen alliances. In this sense, the first economy was as much about community and survival as about profit.
Part II: The Rise of Money – Coinage and Currency
1. Commodity Money
To overcome barter’s limitations, societies began using commodity money—items with intrinsic value that could serve as a medium of exchange. Examples include:
Salt (ancient Rome)
Cowrie shells (Africa and Asia)
Cocoa beans (Aztecs)
Metal ingots (Mesopotamia, China)
These items were widely desired, portable, and relatively durable, making them more efficient than barter.
2. The Birth of Coinage
Around 600 BCE, the kingdom of Lydia (modern-day Turkey) minted the first standardized coins from electrum, a naturally occurring alloy of gold and silver. Coins revolutionized trade:
They were durable and easy to carry.
Their stamped markings guaranteed authenticity and value.
They standardized trade across regions.
As empires expanded—Greek, Roman, Persian, Chinese—coins became symbols of state power. The ruler’s face on currency projected authority and control over economic life.
3. Paper Money and Banking Innovations
China pioneered paper money during the Tang and Song dynasties (7th–11th centuries). Marco Polo later marveled at its use when he visited China in the 13th century. Paper money was lighter, more portable, and easier to produce than coins.
Meanwhile, medieval Europe saw the rise of banks and financial instruments like bills of exchange, which facilitated long-distance trade without carrying physical money. The Italian city-states—Florence, Venice, Genoa—became financial hubs. Banking families like the Medicis laid the foundation for modern finance.
Part III: The Age of Exploration and Mercantilism
1. Trade Routes and Global Connections
The 15th–17th centuries witnessed the opening of sea routes that connected continents. Europe’s search for spices, silk, and precious metals led to the Age of Exploration. Portuguese, Spanish, Dutch, and British empires established colonies, exploiting resources and building global trade networks.
The Silk Road connected East and West long before, but maritime routes expanded trade volumes exponentially.
The Columbian Exchange introduced new crops and goods across continents—potatoes and maize to Europe, horses and wheat to the Americas.
2. Mercantilism – Wealth as Power
Mercantilism dominated economic thought from the 16th to 18th centuries. Nations believed wealth equaled power, and wealth was measured in precious metals like gold and silver. Governments tightly controlled trade, imposed tariffs, and established monopolies through chartered companies like the British East India Company.
While mercantilism encouraged exploration and colonial expansion, it also fueled wars, exploitation, and inequality between colonizers and colonies.
Part IV: The Industrial Revolution and Capitalism
1. Industrialization Changes Everything
The late 18th and 19th centuries brought the Industrial Revolution—an economic turning point. Innovations like the steam engine, spinning jenny, and mechanized looms transformed production. Factories replaced workshops, and mass production replaced handicrafts.
This shift had profound consequences:
Urbanization as people moved to cities for factory work.
Rise of wage labor and the working class.
Massive increases in productivity and wealth creation.
Expansion of railways and steamships accelerated global trade.
2. The Growth of Capitalism
Capitalism thrived during industrialization. Private ownership, competition, and the pursuit of profit drove innovation. Stock markets expanded, providing capital for new industries. Banks and joint-stock companies became central players in financing economic growth.
However, capitalism also generated inequality, labor exploitation, and periodic financial crises. These tensions gave rise to labor movements, socialist critiques, and eventually regulatory reforms.
Part V: Globalization and the 20th-Century Economy
1. World Wars and Reconstruction
The two World Wars disrupted global trade and devastated economies. But they also led to the establishment of international institutions to rebuild and stabilize the global economy.
Bretton Woods Conference (1944) created the International Monetary Fund (IMF) and World Bank.
The U.S. dollar became the anchor of the new international monetary system.
2. Rise of Multinational Corporations
Post-war reconstruction and technological advances gave rise to multinational corporations. Companies like Coca-Cola, IBM, Toyota, and later Apple and Microsoft expanded worldwide, linking economies more closely than ever before.
3. The Digital and Information Economy
The late 20th century introduced a new era: computers, the internet, and information technology. Economies shifted from manufacturing-based to knowledge-based. Information became as valuable as physical goods. Global trade accelerated with container shipping, jet travel, and digital communication.
Part VI: The Blockchain Era – A New Frontier
1. The Origins of Blockchain
In 2008, during the global financial crisis, a mysterious figure (or group) named Satoshi Nakamoto introduced Bitcoin, a decentralized digital currency powered by blockchain technology. Blockchain is a distributed ledger system that records transactions securely, transparently, and without the need for central intermediaries like banks.
2. Features of Blockchain
Decentralization: No single authority controls the network.
Transparency: Every transaction is recorded and visible.
Security: Cryptography ensures data integrity.
Programmability: Smart contracts allow self-executing agreements.
3. Cryptocurrencies and Beyond
Bitcoin paved the way for thousands of cryptocurrencies (Ethereum, Ripple, Solana, etc.). Beyond currencies, blockchain is transforming industries:
Finance: Decentralized finance (DeFi) challenges traditional banking.
Supply Chains: Transparent tracking of goods.
Healthcare: Secure sharing of patient records.
Voting Systems: Tamper-proof elections.
4. Challenges and Criticisms
Blockchain isn’t without problems:
Scalability issues (slow transaction speeds compared to Visa/Mastercard).
Energy consumption (especially Bitcoin mining).
Regulatory uncertainty and risks of misuse (fraud, money laundering).
Still, blockchain represents the latest stage in humanity’s effort to make economic exchange more efficient, secure, and global.
Conclusion – The Next Chapter
The journey from barter to blockchain is not just about economics; it’s about human progress. Every step was driven by the desire to trade more easily, store value more securely, and build systems that could sustain larger and more complex societies.
The question now is: what comes after blockchain? Will artificial intelligence merge with finance to create self-governing economic systems? Will central banks launch their own digital currencies to replace cash entirely? Or will humanity rediscover the value of local, community-based exchange in an age of global complexity?
What is certain is that the evolution of the world economy will continue. Just as the people who bartered sheep for grain could never have imagined Bitcoin wallets, we too cannot fully predict the next leap. But history teaches us one lesson: the world economy is a living system, constantly evolving—and each new phase brings both opportunities and challenges for humanity to navigate.
CPI Data: The Silent Navigator of Currencies, CommoditiesChapter 1: Understanding CPI – The Pulse of Inflation
What is CPI?
The Consumer Price Index is a statistical measure that tracks changes in the price of a basket of goods and services consumed by households. This basket includes categories like:
Food and beverages
Housing and utilities
Transportation
Healthcare
Education
Recreation
Every month, agencies such as the U.S. Bureau of Labor Statistics (BLS), Eurostat, or India’s Ministry of Statistics and Programme Implementation (MoSPI) publish CPI data. Economists parse it to gauge how much everyday living costs have risen or fallen compared to a base year.
Why is CPI Important?
Central Banks: CPI determines whether interest rates should rise (to cool inflation) or fall (to stimulate growth).
Investors: CPI expectations guide bond yields, equity valuations, and commodity demand forecasts.
Governments: CPI affects wage negotiations, pensions, and social security adjustments.
Traders: Currency and commodity traders watch CPI closely for clues about future price movements.
Simply put, CPI is not just a statistical tool—it is the heartbeat of economic policy.
Chapter 2: CPI and Currencies – The Exchange Rate Compass
The Inflation-Interest Rate-Currency Triangle
Currency markets thrive on interest rate differentials between countries. And interest rates, in turn, are deeply tied to CPI. Here’s how the triangle works:
High CPI (Inflation Rising) → Central bank likely raises rates → Higher yields attract capital inflows → Currency strengthens.
Low CPI (Weak Inflation/Deflation) → Central bank cuts rates → Yields fall → Capital outflows → Currency weakens.
For example:
When U.S. CPI surges above expectations, markets anticipate the Federal Reserve will tighten monetary policy. This strengthens the U.S. dollar, often at the expense of emerging market currencies.
Conversely, when Japan’s CPI lingers near zero, it signals low inflation. The yen often weakens, especially if other countries raise rates.
CPI Surprises and Market Reactions
Currency traders pay close attention not just to CPI levels, but to surprises—the gap between expected and actual data.
A higher-than-expected CPI often sparks immediate dollar rallies.
A weaker-than-expected CPI can trigger sell-offs.
In short, CPI is the silent hand guiding daily forex volatility.
Chapter 3: CPI and Commodities – Pricing the Essentials
Inflation’s Direct Impact on Commodities
Commodities like oil, gold, copper, and wheat are real assets whose prices react strongly to inflationary signals.
Oil and Energy: Rising CPI often reflects higher energy costs. But paradoxically, higher inflation expectations can boost crude oil demand as traders hedge against future price surges.
Gold: Known as the “inflation hedge,” gold tends to rally when CPI rises sharply, as investors seek protection against currency depreciation.
Agricultural Commodities: Food inflation reflected in CPI often mirrors supply shocks in wheat, rice, or corn. Countries may adjust imports or exports based on these signals.
Feedback Loops
The relationship between CPI and commodities is not one-way. Commodities themselves often drive CPI readings. For instance:
A global spike in crude oil raises transportation and manufacturing costs, showing up as higher CPI.
Droughts that raise food prices also push CPI upward.
Thus, CPI is both a mirror (reflecting commodity movements) and a magnet (attracting speculative flows into commodities).
Chapter 4: CPI and Trade Routes – The Invisible Mapmaker
Inflation and Trade Balances
Inflation levels affect a country’s trade competitiveness:
High CPI → Domestic goods become expensive → Exports lose competitiveness → Imports rise → Trade deficits widen.
Low CPI → Domestic goods remain affordable → Exports rise → Trade surpluses build.
For example:
Persistent high inflation in Argentina has eroded its export competitiveness, forcing adjustments in trade partnerships.
Germany, historically with low inflation, often maintains strong export surpluses.
CPI as a Navigator of Trade Routes
Trade routes are not just about geography; they are shaped by economic viability. Inflation indirectly alters routes by shifting trade demand.
If Europe faces high inflation while Asia’s CPI remains controlled, Asian goods look cheaper. Shipping companies redirect routes toward Asian suppliers.
If U.S. inflation surges, import demand may weaken, leading to adjustments in trans-Pacific shipping volumes.
Case Study: Inflation and Shipping Costs
In 2021–2022, global CPI spikes—driven by energy and food—coincided with record-high shipping costs. As inflation rose, freight companies restructured routes to prioritize high-demand sectors, such as food imports over luxury goods. CPI data, therefore, indirectly reshaped trade flows.
Chapter 5: CPI, Central Banks, and Global Policy Coordination
CPI does not exist in isolation; it anchors monetary diplomacy across nations.
The U.S. Federal Reserve: Because the U.S. dollar underpins global trade, U.S. CPI announcements ripple worldwide. A high U.S. CPI forces the Fed to hike rates, strengthening the dollar and raising borrowing costs globally.
European Central Bank (ECB): CPI-driven policy changes affect the euro, which impacts intra-European trade flows.
Emerging Economies: Countries like India or Brazil often adjust subsidies, tariffs, or interest rates in response to CPI to safeguard trade competitiveness.
When multiple nations face similar CPI-driven pressures, we see global coordination (or conflict). For example, in the 1970s oil crisis, surging CPI forced many central banks to raise rates simultaneously, tightening global liquidity.
Chapter 6: CPI in Geopolitics and Economic Strategy
CPI as a Political Tool
Governments know voters feel inflation viscerally. CPI spikes often translate into political instability. Leaders facing high CPI tend to:
Subsidize imports of food or fuel.
Strengthen ties with low-cost trading partners.
Impose export bans to protect domestic consumers.
Thus, CPI can even redirect geopolitical alliances.
Inflation and Trade Wars
Persistent CPI pressures often trigger protectionist policies. For example:
High U.S. CPI has historically fueled tariff debates on Chinese imports.
Emerging nations with food inflation often restrict exports, reshaping global supply chains.
In this sense, CPI silently redraws maps of economic power.
Conclusion
The Consumer Price Index may look like a dry statistical release, but it is one of the most powerful silent forces shaping global finance and trade. From guiding central bank decisions to shifting the tides of forex markets, from influencing commodity hedging to redrawing shipping routes, CPI is everywhere.
It doesn’t shout like wars or pandemics, but whispers through spreadsheets and trading desks—subtly yet decisively navigating the economic world.
In an interconnected age, understanding CPI is not just for economists. Traders, policymakers, and businesses alike must treat it as the silent navigator that determines the currents of currencies, commodities, and trade routes.
Sea Routes & Supply Chains1. The Historical Foundation of Sea Routes
1.1 Ancient Maritime Trade
Maritime trade is as old as civilization itself.
The Phoenicians of the Mediterranean (around 1500 BCE) mastered navigation and spread commerce across North Africa, the Middle East, and Southern Europe.
The Silk Road by sea connected China, India, Arabia, and Africa, long before modern globalization. Spices, silk, and precious stones moved across oceans, shaping cultures and economies.
In South Asia, the Indian Ocean trade system linked ports from East Africa to Southeast Asia. Seasonal monsoon winds powered dhows and junks carrying pepper, gold, and textiles.
1.2 Age of Exploration and Colonization
The 15th and 16th centuries marked a turning point. European powers—Portugal, Spain, the Netherlands, and later Britain—sought new sea routes to bypass land-based trade monopolies.
Vasco da Gama’s voyage to India (1498) opened Europe to Asian spices.
Columbus’s Atlantic crossing linked Europe with the Americas.
Britain’s mastery of naval power allowed it to dominate maritime routes, turning sea trade into imperial control.
Sea routes became instruments of wealth and power, laying the groundwork for today’s globalized supply chains.
2. Sea Routes: The Arteries of Modern Trade
2.1 Major Maritime Routes
Modern maritime trade relies on established routes shaped by geography and economics.
The Suez Canal Route: Connecting Europe and Asia via the Mediterranean and Red Sea. It shortens the Europe-Asia journey by nearly 7,000 km compared to circumnavigating Africa.
The Strait of Hormuz: A narrow chokepoint through which one-fifth of the world’s oil supply passes.
The Strait of Malacca: Linking the Indian and Pacific Oceans, this is one of the busiest shipping lanes in the world.
The Panama Canal: Vital for connecting the Atlantic and Pacific, especially for trade between the Americas and Asia.
The Trans-Pacific Route: Connecting East Asian manufacturing hubs (China, Japan, South Korea) with North American markets.
The Trans-Atlantic Route: Linking Europe and North America, critical for goods, energy, and raw materials.
2.2 Strategic Chokepoints
These routes rely on chokepoints, narrow maritime passages that, if disrupted, can cripple trade. The Strait of Hormuz, Malacca, and Bab el-Mandeb are classic examples. Piracy, blockades, or accidents in these areas can trigger global economic shockwaves—as seen when the Ever Given blocked the Suez Canal in 2021.
2.3 Cargo Diversity
Sea routes transport a staggering variety of goods:
Bulk commodities: oil, coal, iron ore, grains.
Containerized goods: electronics, apparel, machinery.
Liquefied gases: LNG and LPG.
Specialized cargo: cars, chemicals, refrigerated food (reefer containers).
The efficiency of sea routes lies in their ability to handle massive volumes cheaply compared to air or land transport.
3. Supply Chains: The Skeleton Behind Sea Routes
3.1 What Is a Supply Chain?
A supply chain is the entire process of sourcing, manufacturing, and delivering goods. It includes suppliers, factories, warehouses, transport hubs, shipping lines, and retailers. Sea routes act as international connectors within this chain.
3.2 Globalization and the Rise of Complex Supply Chains
From the late 20th century, businesses adopted “just-in-time” production to minimize inventory and reduce costs. Manufacturers sourced parts globally, relying on efficient shipping. For example:
A smartphone may have components from South Korea, semiconductors from Taiwan, assembly in China, and final sales in the U.S.
Automakers source steel from Brazil, engines from Germany, and wiring harnesses from Mexico.
Sea routes enable this complex web, making supply chains international in scope.
3.3 Containerization Revolution
The introduction of the shipping container in the 1950s revolutionized logistics. Standardized containers allowed goods to move seamlessly between ships, trains, and trucks. This reduced theft, increased efficiency, and lowered shipping costs dramatically. Today, mega-container ships can carry over 20,000 TEUs (Twenty-foot Equivalent Units), making sea transport the backbone of global supply chains.
4. Geopolitics of Sea Routes and Supply Chains
4.1 Naval Power and Trade Control
Sea routes are not just commercial pathways but also strategic assets. Countries with strong navies—like the U.S., China, and historically Britain—use maritime dominance to secure trade. Control over chokepoints gives nations leverage in global politics.
4.2 Belt and Road Initiative (BRI)
China’s Maritime Silk Road, part of the BRI, seeks to expand its influence by investing in ports and shipping infrastructure worldwide. From Gwadar in Pakistan to Piraeus in Greece, China is reshaping maritime geopolitics.
4.3 Trade Wars and Supply Chain Shifts
U.S.–China tensions have exposed vulnerabilities in supply chains. Companies are “China+1” strategies, diversifying manufacturing to Vietnam, India, or Mexico. Yet, all these shifts still depend on sea routes for global distribution.
4.4 Vulnerability to Conflict
Conflicts in Ukraine, the South China Sea, or the Middle East can disrupt supply chains. Sanctions and blockades weaponize trade routes, showing how economic security is intertwined with geopolitics.
5. Challenges Facing Sea Routes and Supply Chains
5.1 Disruptions
Pandemics: COVID-19 exposed supply chain fragility when ports shut down, containers piled up, and shipping costs soared.
Piracy: Particularly in the Gulf of Aden and parts of Southeast Asia.
Climate Change: Rising sea levels, stronger storms, and melting Arctic ice are reshaping routes.
5.2 Environmental Concerns
Shipping contributes about 3% of global CO₂ emissions. Heavy fuel oil pollutes air and oceans, prompting stricter environmental regulations. The push for green shipping—using LNG, hydrogen, or wind-assisted propulsion—is gaining momentum.
5.3 Infrastructure Strain
Mega-ships require deeper ports and better logistics hubs. Not all regions can afford the infrastructure, creating bottlenecks in global trade.
6. The Future of Sea Routes and Supply Chains
6.1 Technological Transformation
Digitalization: Blockchain and AI are streamlining documentation and tracking shipments.
Autonomous Ships: Trials are underway for crewless vessels that reduce costs and risks.
Smart Ports: Automated cranes and AI-driven logistics increase efficiency.
6.2 Arctic Sea Routes
As ice melts, the Northern Sea Route along Russia and the Northwest Passage through Canada are becoming viable. These routes cut travel time between Asia and Europe but raise environmental and sovereignty concerns.
6.3 Regionalization vs. Globalization
Some argue the world is moving towards regional supply chains due to geopolitical tensions and resilience concerns. For instance, the EU encourages near-shoring manufacturing, while the U.S. promotes domestic chip production. However, sea routes will remain indispensable for intercontinental trade.
6.4 Resilient Supply Chains
Companies are rethinking strategies:
Building redundancy (multiple suppliers).
Increasing stockpiles of critical goods (semiconductors, medicines).
Investing in predictive analytics for disruptions.
Conclusion
Sea routes and supply chains truly are the hidden arteries of the global economy. From the spice traders of antiquity to the container ships of today, oceans have been the lifeblood of commerce and civilization. They connect continents, fuel industries, and ensure the smooth functioning of daily life. Yet, they remain vulnerable to geopolitical rivalries, environmental pressures, and technological disruptions.
As the world faces climate change, rising protectionism, and shifting power balances, the future of sea routes and supply chains will demand innovation, resilience, and cooperation. They may be invisible to the average consumer, but every time someone picks up a smartphone, drinks coffee, or fills their car with fuel, they are directly benefiting from the silent yet powerful arteries that keep the global economy alive.
Financial Market CoverageUnderstanding the Backbone of Modern Finance
Introduction
Financial markets are the lifeblood of the global economy. They provide the infrastructure for the allocation of capital, risk management, and wealth creation. However, the true power of financial markets lies not just in their existence, but in how they are observed, analyzed, and reported. This is where financial market coverage comes in—an essential mechanism that informs investors, regulators, policymakers, and the public about the constantly evolving financial ecosystem.
Financial market coverage is more than reporting stock prices or bond yields. It encompasses the analysis of macroeconomic trends, corporate performance, policy changes, market sentiment, and geopolitical events. Effective coverage ensures transparency, fosters confidence, and enables participants to make informed decisions. In this discussion, we will explore the scope, methods, challenges, and future of financial market coverage.
The Scope of Financial Market Coverage
Financial market coverage extends across multiple segments, each with its unique nuances and stakeholders. Key areas include:
1. Equity Markets
Equity markets, or stock markets, are arguably the most visible segment. Coverage here involves:
Stock Price Movements: Tracking real-time prices, indices, and market trends.
Company Analysis: Evaluating earnings, management strategies, mergers, acquisitions, and other corporate actions.
Sectoral Analysis: Comparing performance across sectors such as technology, healthcare, or energy.
Market Sentiment: Understanding investor psychology through trading volume, options activity, and news flow.
2. Fixed Income and Bond Markets
Bond markets are critical for funding governments and corporations. Coverage involves:
Yield Movements: Monitoring interest rate trends, yield curves, and bond spreads.
Credit Analysis: Assessing corporate and sovereign creditworthiness.
Policy Implications: Evaluating central bank actions and their effects on debt markets.
3. Derivatives and Commodities
Derivatives such as futures and options provide hedging and speculative opportunities. Coverage includes:
Price Volatility: Tracking commodity prices (oil, gold, agricultural products) and derivative contracts.
Market Structure: Observing open interest, options chains, and leverage trends.
Risk Indicators: Monitoring implied volatility indices like VIX.
4. Foreign Exchange and Currency Markets
The forex market is the largest and most liquid. Coverage includes:
Currency Pairs: Tracking movements in major and emerging market currencies.
Global Trade Impacts: Understanding how exchange rate fluctuations affect trade and investment.
Central Bank Interventions: Monitoring interest rate decisions and monetary policy adjustments.
5. Alternative Investments
Alternative assets such as private equity, hedge funds, and cryptocurrencies are increasingly covered due to their growing influence. Coverage examines:
Market Trends: Adoption rates, liquidity, and performance metrics.
Regulatory Risks: Monitoring government policies and enforcement actions.
Investor Interest: Tracking institutional and retail participation.
Methods and Channels of Financial Market Coverage
Financial market coverage employs multiple methods, tools, and media channels:
1. Traditional Media
Newspapers and Magazines: Financial dailies like The Wall Street Journal and Economic Times provide daily market summaries.
Television Channels: CNBC, Bloomberg TV, and local financial channels offer live analysis and expert interviews.
Radio and Podcasts: Financial talk shows provide commentary and insights for casual investors.
2. Digital Platforms
Financial Websites and Portals: Platforms like Bloomberg, Reuters, and Moneycontrol deliver real-time updates.
Mobile Apps: Trading apps and news apps provide push notifications and analytical tools.
Social Media: Twitter, LinkedIn, and specialized forums allow rapid dissemination and crowd-sourced sentiment.
3. Analytical Tools
Charting Software: Technical analysis relies on historical price charts and pattern recognition.
Financial Models: Fundamental analysis uses valuation models, discounted cash flows, and ratios.
AI and Big Data: Machine learning models analyze vast datasets to predict market trends and detect anomalies.
4. Institutional Reports
Brokerage Reports: Analysts provide in-depth research reports with buy/sell recommendations.
Investment Bank Publications: Macro and sectoral insights influence market perception and trading strategies.
Regulatory Disclosures: Filings such as 10-Ks, 10-Qs, and prospectuses provide authoritative information.
The Role of Financial Journalists and Analysts
Coverage is not just about raw data; interpretation is critical. Financial journalists and analysts bridge this gap:
Journalists: Provide context, highlight market-moving news, and summarize complex events in understandable language.
Analysts: Offer technical insights, forecasts, and actionable recommendations.
Influencers and Educators: Thought leaders shape sentiment and influence retail participation.
A balanced coverage ecosystem combines speed with accuracy, commentary with data, and local insights with global perspective.
Importance of Financial Market Coverage
1. Promotes Transparency
Timely coverage ensures that market participants have access to relevant information, reducing information asymmetry.
2. Enhances Market Efficiency
Markets respond more accurately when participants are informed, contributing to better price discovery.
3. Guides Investment Decisions
Coverage helps investors identify opportunities, manage risk, and adjust strategies in volatile conditions.
4. Supports Policymaking
Regulators and central banks monitor market coverage to gauge sentiment, liquidity conditions, and systemic risks.
5. Educates the Public
Effective reporting demystifies markets for retail investors, empowering financial literacy and participation.
Challenges in Financial Market Coverage
Despite its critical role, coverage faces several challenges:
1. Information Overload
The sheer volume of financial news can overwhelm investors, making it difficult to distinguish signal from noise.
2. Speed vs. Accuracy
In the digital age, the pressure to report first can compromise accuracy.
3. Bias and Conflicts of Interest
Analyst recommendations and media reporting may be influenced by corporate sponsorships or personal interests.
4. Complexity of Modern Markets
Derivatives, algorithmic trading, and decentralized finance (DeFi) make coverage increasingly technical and challenging.
5. Global Interconnectedness
Events in one country can trigger cascading effects worldwide, demanding comprehensive, real-time coverage.
Conclusion
Financial market coverage is far more than a reporting mechanism; it is a critical pillar of modern financial systems. It informs, guides, and protects the interests of investors, institutions, and regulators. In an era of rapid information flow, complex instruments, and interconnected economies, high-quality coverage ensures that markets remain transparent, efficient, and fair.
As technology evolves and markets become more sophisticated, the role of coverage will expand further, blending real-time data, advanced analytics, and global insights. For any market participant, understanding financial market coverage is no longer optional—it is an essential part of navigating the intricate world of finance.

Oil Wars: The Hidden Geopolitical Battles Introduction
The global oil market is not merely a reflection of supply and demand dynamics; it is a complex arena where geopolitical maneuvers, strategic alliances, and international conflicts play pivotal roles. Oil, often termed "black gold," has been at the heart of numerous geopolitical strategies, influencing global power structures and economic landscapes. From the early 20th century to the present day, oil has been both a catalyst for conflict and a tool for diplomacy.
The Historical Prelude: Oil as a Strategic Asset
In the early 1900s, the discovery of vast oil reserves in the Middle East transformed the region into a focal point of international interest. Nations like the United Kingdom and the United States sought to secure access to these resources, leading to the establishment of influential oil companies such as the Anglo-Persian Oil Company (now BP) and Standard Oil (now ExxonMobil). These entities not only dominated the oil industry but also shaped the political contours of the regions they operated in.
The strategic importance of oil became evident during World War I and World War II, where control over oil supplies was crucial for military operations. The U.S. emerged as a dominant oil producer in the post-war era, further solidifying oil's role in global geopolitics.
The Cold War and Oil: A Dual-Edged Sword
During the Cold War, oil became a tool for both the Western bloc, led by the United States, and the Eastern bloc, led by the Soviet Union. The U.S. sought to ensure the free flow of oil from the Middle East to prevent Soviet influence in the region. Conversely, the USSR aimed to secure energy resources to fuel its industrial ambitions. This competition led to proxy wars and political interventions in oil-rich regions.
The 1973 Oil Crisis marked a significant turning point, where OPEC's oil embargo led to a quadrupling of oil prices, highlighting the geopolitical leverage of oil-producing nations. This event underscored the vulnerability of oil-dependent economies and the intricate link between energy resources and geopolitical power.
The Middle East: Epicenter of Oil Conflicts
The Middle East has been central to many oil-related geopolitical conflicts. The Iran-Iraq War (1980–1988) was partly fueled by disputes over oil-rich territories and control of the Shatt al-Arab waterway. Similarly, the Gulf War (1990–1991) was precipitated by Iraq's invasion of Kuwait, aiming to control its oil reserves and access to the Persian Gulf.
In recent years, the region has witnessed renewed tensions. Ukrainian drone attacks on Russian oil infrastructure, such as the Primorsk terminal and the Kirishi refinery, have disrupted supply chains, leading to fluctuations in global oil prices. These incidents highlight the vulnerability of oil infrastructure to geopolitical conflicts and the ripple effects on global markets.
The Role of Major Oil Players: OPEC and Non-OPEC Nations
The Organization of the Petroleum Exporting Countries (OPEC) has been a significant force in shaping oil prices through coordinated production cuts or increases. However, the dynamics within OPEC are complex, with member countries often having divergent interests. The 2020 Russia–Saudi Arabia oil price war exemplified the challenges within OPEC+, where a breakdown in negotiations led to a dramatic fall in oil prices.
Non-OPEC countries, particularly the United States with its shale oil revolution, have also influenced global oil markets. The U.S. became a significant oil producer, challenging OPEC's dominance and leading to shifts in global oil supply and pricing mechanisms.
Sanctions and Their Impact on Oil Markets
Economic sanctions have become a tool for nations to exert pressure on oil-producing countries. For instance, sanctions on Iran and Venezuela have led to declines in their oil exports, affecting global supply. Conversely, countries like India have continued to import sanctioned oil, citing strategic energy needs, thereby challenging the efficacy of such sanctions.
The enforcement of sanctions has also led to the emergence of a "shadow fleet" of tankers, circumventing traditional shipping routes and insurance mechanisms, further complicating the global oil trade.
The Future: Renewable Energy and the Decline of Oil's Geopolitical Influence
The global shift towards renewable energy sources is gradually diminishing oil's central role in geopolitics. Countries are investing in alternative energy to reduce dependence on oil, leading to a reconfiguration of global power structures. However, oil remains a critical component of the global energy mix, and geopolitical considerations continue to influence its production and pricing.
Conclusion
Oil has been more than just an energy resource; it has been a cornerstone of geopolitical strategies, influencing international relations, economic policies, and global power dynamics. Understanding the intricate relationship between oil and geopolitics is essential for comprehending current global affairs and anticipating future developments in the energy sector.

BTC Trade Idea: Short from 117,850 at previous resistance level
Bitcoin is currently at a previous resistance level 117,500 where the price has bounced down before.
Personally, I will enter a short trade from the current price with a tight stop-loss.
✅ My Personal Strategy:
Entry: Sell from current price 117,850
🎯 Target 1: 116,000
🎯 Target 2: 115,500
Stop Lose : Daily close above the resistance level 117,500
Please note:
This is not financial advice – I’m only sharing my personal trades.
Always do your own research before taking action.
👍 Don’t forget to like if you found this useful, and feel free to follow me for more analysis of this kind.
Best of luck 🌹

GOLD DAILY CHART ROUTE MAP UPDATE3683 Target Achieved – Chart Idea Complete 🚀💥
Booooom! 💥💥 Just as we laid out, the 3683 target was smashed this week – absolutely amazing finish! This move perfectly completed the chart idea we’ve been tracking, right in line with the analysis.
🔹 3564 ➡️ 3683
We first hit the 3564 target cleanly, then carried that momentum straight through to the big 3683 level. The EMA5 confirmations delivered flawlessly, giving us one of the sharpest, most technical finishes of the week.
This closes out the breakout sequence beautifully and proves once again how powerful structured analysis + patience can be.
🔥 What’s Next?
We’ll be back on Sunday with a fresh Daily chart idea, updated targets, and a full multi-timeframe analysis to guide the next leg of the journey. Stay tuned – momentum is only heating up from here!
Thank you for the continued support, and congratulations to everyone who rode this move with us.
Mr Gold
GoldViewFX
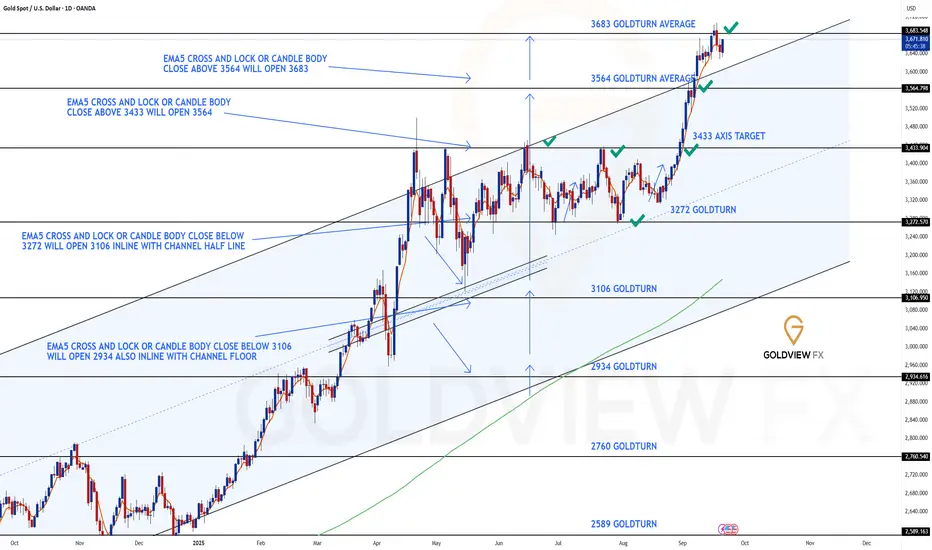
Why Spot Forex is the First Choice for Retail Traders1. Understanding Spot Forex
Before exploring the reasons for its popularity, it’s important to understand what spot forex really is.
Definition: Spot forex is the purchase or sale of one currency for another, with settlement occurring “on the spot” (usually within two business days, but in practice, retail brokers provide immediate execution).
Currency pairs: Trades happen in pairs like EUR/USD, GBP/JPY, or USD/INR. The first currency (base) is being bought or sold against the second (quote).
Objective: Traders aim to profit from the fluctuations in exchange rates between currencies.
Unlike futures or options, where contracts are traded, spot forex involves the direct exchange at current prices. For retail traders, brokers provide contracts via platforms that simulate this process with tight spreads, leverage, and easy order execution.
2. Historical Growth of Retail Forex
Until the late 1990s, forex was largely the playground of banks, hedge funds, and large corporations managing cross-border exposures. Retail investors had little or no access because:
Minimum transaction sizes were too large.
Trading required specialized knowledge and infrastructure.
Pricing was not transparent to the public.
However, the rise of online trading platforms around the year 2000 changed everything. Brokers like OANDA, FXCM, and later a flood of global platforms, introduced small contract sizes, user-friendly software (like MetaTrader), and access to leverage. Suddenly, anyone with an internet connection could participate.
By the mid-2000s, millions of retail traders had entered the forex market, with Asia, Europe, and later Africa becoming hotspots for new traders. Today, forex is the largest segment of retail online trading, far surpassing traditional stock trading in many regions.
3. Core Advantages of Spot Forex for Retail Traders
3.1 Liquidity and Market Size
Forex is the world’s most liquid market, with trillions of dollars traded daily. This liquidity brings several benefits:
Tight spreads: Bid-ask spreads are minimal, especially on major pairs like EUR/USD.
Instant execution: Orders can be filled within milliseconds.
No market manipulation (at retail scale): Because the market is so vast, individual retail traders or even brokers cannot manipulate prices significantly.
For beginners, this means fair pricing, ease of entry and exit, and reduced slippage compared to thinly traded assets.
3.2 24-Hour Market
Unlike stock exchanges that operate within specific hours, forex trading runs 24 hours a day, five days a week. From the Sydney open on Monday morning to the New York close on Friday evening, trading never stops.
This round-the-clock access is particularly attractive for retail traders who often trade part-time:
A student can trade after classes.
A working professional can trade after office hours.
A freelancer can pick sessions that match their schedule.
Flexibility is a major reason why forex fits into people’s lives more easily than stock markets with rigid timings.
3.3 Leverage and Low Capital Requirement
One of the most powerful attractions of forex is leverage. Brokers allow traders to control positions much larger than their deposit. For example:
With leverage of 1:100, a trader can control $10,000 worth of currency with just $100 margin.
Some brokers even offer leverage as high as 1:500 or more.
This means retail traders don’t need large starting capital. Someone with $500 can participate meaningfully in the market, unlike in stocks where buying even a few shares of large companies can consume the entire amount.
Of course, leverage is a double-edged sword (covered later), but its availability makes forex highly accessible.
3.4 Low Transaction Costs
Forex brokers earn mainly from spreads (the difference between buy and sell prices), which are often as low as 0.1 to 1 pip for major pairs. Compared to stock brokers who charge commissions or commodity markets with exchange fees, forex is cost-efficient.
No clearing fees, exchange fees, or government stamp duties make the cost structure simpler and lighter for retail traders.
3.5 Variety of Currency Pairs
Forex offers a wide menu of tradable instruments:
Majors: EUR/USD, GBP/USD, USD/JPY, USD/CHF.
Minors: EUR/GBP, AUD/JPY, GBP/CHF.
Exotics: USD/TRY, USD/ZAR, USD/INR.
This variety allows traders to pick pairs that suit their trading style. Some prefer stable majors with tight spreads, while others thrive on the volatility of exotic currencies.
3.6 Advanced Technology & Platforms
The retail forex industry has benefited enormously from trading technology. Platforms like MetaTrader 4 (MT4), MetaTrader 5 (MT5), and cTrader provide:
One-click execution.
Real-time charts.
Custom indicators and automated trading (Expert Advisors).
Mobile apps for trading on the go.
Such sophisticated tools, often free, are a huge reason forex became the default choice for retail traders.
4. Practical Reasons Retail Traders Prefer Spot Forex
4.1 Easy Account Setup
Opening a forex trading account is often easier than opening a stock brokerage account. With online KYC, low minimum deposits (sometimes as low as $10), and demo accounts, the barrier to entry is minimal.
4.2 Demo Accounts for Practice
Unlike many stock or commodity brokers, forex brokers almost always provide free demo accounts with virtual money. This allows beginners to practice strategies without financial risk, making the learning curve smoother.
4.3 Global Access
Forex is a truly global market. Whether you live in India, Nigeria, Brazil, or Europe, you can access the same currency pairs and pricing as traders in New York or London. This universality is rare in other asset classes.
5. Psychological & Behavioral Appeal
5.1 The Thrill of Leverage
For many beginners, the ability to control large amounts with small deposits is exhilarating. The idea of turning $100 into $1,000 in a short span appeals strongly to retail traders, even though the risks are equally high.
5.2 Freedom and Independence
Forex gives traders the sense of being their own boss. No middle managers, no clients to report to—just you, your strategy, and the market. This independence attracts people seeking financial freedom.
5.3 Quick Feedback Loop
Unlike long-term stock investing, forex provides immediate feedback. A trader knows within minutes or hours whether a trade is working, which keeps engagement high.
6. Risks and Misconceptions
It would be incomplete to discuss forex’s appeal without addressing its risks.
6.1 Overuse of Leverage
Leverage magnifies profits and losses. Many retail traders blow up accounts by over-leveraging, thinking they can get rich overnight.
6.2 Emotional Trading
The fast pace and 24-hour availability often lead to overtrading, revenge trading, or lack of discipline. Psychology plays a huge role in whether traders succeed or fail.
6.3 Broker Risks
Not all brokers are regulated. Many retail traders in emerging markets fall prey to fraudulent brokers promising unrealistic leverage or bonuses.
Despite these challenges, the majority of traders still flock to forex because the potential rewards outweigh perceived risks in their minds.
Conclusion
Spot forex has become the first choice for retail traders because it combines accessibility, liquidity, low costs, global reach, and technological sophistication in a way that no other market does. For individuals with limited capital, flexible schedules, and a desire for independence, forex is the natural starting point.
Yes, the risks are real—particularly misuse of leverage and emotional trading—but the sheer scale of opportunities continues to draw millions of retail traders each year.
For beginners and seasoned traders alike, the spot forex market remains not only the largest financial arena but also the most democratic—open to anyone, anywhere, with the willingness to learn and the discipline to trade.
World Market Scalping: Turning Small Moves into Big Opportunitie1. What is Scalping?
At its core, scalping is a trading style where traders aim to profit from tiny price changes in financial instruments. Instead of chasing large trends or waiting for news-driven swings, scalpers focus on small, predictable moves that happen frequently.
A scalper might enter and exit a trade within seconds or minutes.
Profits per trade are usually small—sometimes just a few cents, ticks, or pips.
Success depends on volume of trades and high win rates.
Example:
If a scalper trades EUR/USD in forex, they might aim to capture 3–5 pips per trade. If they make 100 trades a day, those small profits add up significantly.
This philosophy is what makes scalping so appealing: small edges, multiplied over time, equal big opportunities.
2. Why World Markets are Ideal for Scalping
Scalping thrives where there is:
High Liquidity – Global markets like forex, S&P 500 futures, or gold have massive trading volumes. Liquidity ensures tight spreads and quick order execution.
Constant Volatility – Even when major markets are calm, smaller fluctuations happen continuously.
24/5 Trading Access – The forex market and global indices run almost around the clock, giving scalpers endless opportunities.
Global Interconnections – Events in one country (like a Fed decision in the US) ripple across global markets, creating intraday opportunities.
For these reasons, scalping in world markets is a natural fit for traders seeking consistent activity and endless setups.
3. The Psychology of a Scalper
Scalping isn’t for everyone—it demands a particular mindset:
Patience with small gains – Scalpers accept that $20 here and $30 there will compound over time.
Quick decision-making – Hesitation kills scalpers; opportunities vanish in seconds.
Emotional discipline – Frequent trades can test patience; overtrading or revenge trading must be avoided.
Laser focus – Scalpers may spend hours glued to the screen, monitoring every tick.
In world markets, where volatility can spike suddenly, this discipline becomes even more critical.
4. Tools of the Scalping Trade
Scalpers rely heavily on advanced tools. Some essentials include:
High-speed trading platforms (like MetaTrader, NinjaTrader, or Thinkorswim).
Direct market access (DMA) brokers for fast execution.
Charts with one-minute or tick data to capture micro-movements.
Volume and order flow indicators to see real-time buying and selling pressure.
Algorithmic support (EAs or bots) for ultra-fast setups.
Without speed, scalping in world markets is like bringing a knife to a gunfight.
5. Scalping Techniques in World Markets
Scalpers use various methods depending on the asset:
a) Forex Scalping
Targets small pip movements.
Strategies include spread scalping, news scalping, and EMA crossovers.
b) Stock Scalping
Focuses on highly liquid stocks (e.g., Apple, Tesla, Microsoft).
Uses Level 2 data and time & sales for precision.
c) Index Scalping
Popular in instruments like S&P 500 futures (ES), Dow Jones, or Nikkei 225.
Scalpers often follow global sessions (Asian, European, US) for volatility bursts.
d) Commodity Scalping
Crude oil and gold are favorites due to global demand.
News-driven micro-volatility provides scalpers with rapid opportunities.
e) Bond Market Scalping
Though slower, bond futures and yields react instantly to economic data.
Scalpers exploit these quick yield/price adjustments.
Each market has its nuances, but the common theme is speed + volume = success.
6. The Power of Compounding Small Wins
Let’s look at how tiny wins add up:
Suppose a scalper makes $20 per trade.
They execute 50 trades a day, winning 70% of them.
Net daily profit = around $600–700.
Over 20 trading days a month, that’s $12,000–14,000.
This compounding effect demonstrates why scalpers don’t chase “home runs”—they rely on base hits that add up to a win streak.
7. Risks of Scalping in Global Markets
Scalping is not without risks:
Execution Risk – Delayed fills can turn profits into losses.
High Costs – Commissions and spreads eat into small gains.
Overtrading – Scalpers can burn out mentally or financially.
Market Noise – Small moves may be random, creating false signals.
Global Shocks – Sudden news (like central bank surprises) can wipe out hours of gains.
Risk management (tight stop-losses, trade size control) is the lifeline of world market scalping.
8. How Global Events Shape Scalping Opportunities
Scalpers thrive on volatility. World markets provide plenty of it:
Central Bank Decisions – Fed, ECB, BOJ, etc., move currencies, indices, and bonds.
Geopolitical Events – Wars, sanctions, or elections create sudden bursts.
Economic Data Releases – Jobs reports, inflation data, GDP, etc.
Commodity Supply Shocks – OPEC announcements, natural disasters, etc.
For scalpers, these are golden windows to catch lightning-fast trades.
Conclusion
Scalping is not just a trading method—it’s a mindset, discipline, and lifestyle. In the world’s largest markets, where trillions of dollars flow daily, scalpers carve out their share by seizing micro-opportunities others overlook.
It’s not about predicting the future. It’s about reacting faster, managing risk smarter, and compounding small profits into life-changing results.
For traders who crave action, thrive under pressure, and believe in the power of “small edges repeated often,” world market scalping offers a gateway to consistent success.
The opportunities are endless—the question is whether you have the speed, discipline, and mindset to capture them.
The Future of Global Trading1. Introduction: What is Global Trading?
Global trading is the interconnected web of buying and selling goods, services, and financial instruments across borders. It is the lifeline of the world economy, where financial markets, commodities, currencies, and technologies all play a role.
In the future, global trading will not just be about moving oil, gold, or stocks — it will include digital assets, carbon credits, data, intellectual property, and even tokenized real estate. The traditional definition of trade is expanding, and the pace of change is unprecedented.
2. Historical Evolution of Global Trade & Markets
To understand the future, we need to look back:
Silk Road Era – Trade was physical, slow, and limited to goods like silk, spices, and metals.
Colonial & Industrial Age – Maritime trade routes and industrialization globalized markets.
20th Century – Rise of currencies, stock exchanges, and commodity markets.
Late 20th Century – Introduction of derivatives, futures, and global index trading.
21st Century – Digital revolution: algorithmic trading, blockchain, cryptocurrencies, tokenized assets.
The shift from physical goods to financial instruments and digital assets sets the stage for the next century of global trading.
3. Current Landscape: Financial Markets, Commodities, Currencies
Today, global trading is driven by three main pillars:
Financial Instruments – Equities, bonds, derivatives, and ETFs are traded across exchanges from New York to Tokyo.
Commodities – Hard (oil, metals, gold) and soft (agriculture, coffee, cotton) commodities drive global supply chains.
Currencies & Forex – The $7+ trillion per day forex market is the most liquid in the world.
But we’re at an inflection point. The future will see integration of financial and physical trading with technology like AI, blockchain, and tokenized assets.
4. Technological Disruption in Trading
Technology is reshaping every aspect of global trade:
Algorithmic Trading: 70%+ of trades in developed markets are now automated.
High-Frequency Trading (HFT): Millisecond execution reshapes liquidity.
Artificial Intelligence: Predictive models replacing traditional analysis.
Blockchain & Smart Contracts: Transparent, decentralized, and faster settlement.
Digital Platforms: Retail traders can trade global indices and commodities from their smartphones.
Future global trading will be platform-driven, borderless, and increasingly digital.
5. Future of Financial Instruments in Global Trade
Derivatives Expansion: More futures & options for niche sectors (like EV batteries, rare earth metals, data storage).
Index Trading Growth: Global indices like MSCI, FTSE, S&P, Nikkei, and Nifty will expand as investment products.
Tokenization of Assets: Real estate, bonds, commodities will be digitized and traded 24/7.
Synthetic Assets: Platforms will allow retail traders to invest in synthetic versions of stocks, bonds, and commodities globally.
The future is “democratized global trading” — anyone, anywhere can trade anything, anytime.
6. Impact of Geopolitics & Economic Policies
Global trade is not just economic, it’s political:
US-China Trade Rivalry – Will shape global supply chains.
Sanctions & Restrictions – Affects oil, defense, and technology trading.
Regional Alliances (BRICS+, ASEAN, EU) – Compete to control commodities and currencies.
Currency Wars & De-dollarization – Rising role of Yuan, Rupee, and digital currencies in trade settlement.
The future global market will be multipolar, not dominated by a single currency or nation.
7. Role of Artificial Intelligence & Automation
AI is the new backbone of global trading:
Trade Execution – AI-driven bots will dominate execution.
Market Predictions – Machine learning models will outperform humans in detecting patterns.
Risk Management – AI will calculate probabilities of market shocks instantly.
Fraud Detection & Compliance – Real-time monitoring across borders.
The trader of the future will be less of a chart reader and more of a data strategist.
8. Digital Assets, Blockchain & Tokenization
Digitalization is redefining global trading:
Cryptocurrencies – Bitcoin, Ethereum, and central bank digital currencies (CBDCs).
Blockchain-based Trade Settlement – Faster, cheaper, and borderless.
Tokenized Commodities – Gold, oil, and real estate will be traded as digital tokens.
DeFi (Decentralized Finance) – Will compete with traditional exchanges for capital and liquidity.
This creates a 24/7 global trading environment, unlike the traditional 9-to-5 market hours.
9. Risks & Challenges in Future Global Trading
Cybersecurity Risks – Hackers targeting global exchanges.
Regulatory Fragmentation – Different rules across regions.
Volatility from AI & Algorithms – Flash crashes, liquidity gaps.
Geopolitical Conflicts – Trade wars, sanctions, currency rivalries.
Climate Risks – Extreme weather disrupting supply chains.
Future trading will be more interconnected, but fragile.
10. Opportunities for Traders, Investors & Nations
Retail Traders – Borderless access to global markets.
Institutional Investors – Ability to diversify into tokenized assets.
Nations – Can attract global capital by becoming digital trading hubs.
Entrepreneurs – New platforms, exchanges, and trading tools will emerge.
The future belongs to those who can adapt, innovate, and trade across borders seamlessly.
Conclusion: The Road Ahead
Global trading is moving toward a fully digital, decentralized, and democratized system.
Technology (AI, Blockchain, Tokenization) will be the driver.
Geopolitics will shape supply chains and currency dominance.
Sustainability will guide investment flows.
New Hubs in Asia, Africa, and the Middle East will challenge traditional powers.
The future of global trading is not just about financial profits — it is about reshaping economies, redistributing power, and reimagining how the world connects.
We are entering an era where anyone can trade anything, anywhere, anytime — the true definition of a borderless global marketplace.

Global Bond Trading1. Introduction to Global Bond Trading
Global bond trading forms the backbone of the world’s financial system. Unlike equities, which represent ownership in companies, bonds are debt instruments through which governments, corporations, municipalities, and international organizations raise capital. When an entity issues a bond, it is essentially borrowing money from investors with a promise to repay the principal along with interest (known as a coupon) at a predetermined future date.
What makes global bond trading so important is its size and influence. The global bond market is far larger than the stock market, with estimates suggesting it surpasses $130 trillion in outstanding debt securities. Every day, trillions of dollars’ worth of bonds are traded across continents, making them one of the most liquid and essential financial assets. From financing infrastructure projects to stabilizing national economies, bonds are at the center of global finance.
2. History and Evolution of Bond Markets
The concept of debt financing is not new. Ancient civilizations such as Mesopotamia and Rome engaged in lending and borrowing with basic debt contracts. However, the modern bond market began to take shape during the Renaissance, when Italian city-states like Venice and Genoa issued debt securities to fund wars and trade expeditions.
17th century: The Dutch East India Company and English Crown issued long-term bonds to finance naval operations and expansion.
18th–19th centuries: Government bonds became critical during wars. For instance, Britain financed the Napoleonic wars largely through bonds.
20th century: After World War II, the U.S. Treasury market became the global benchmark.
21st century: Globalization, electronic trading, and innovations like green bonds and digital bonds expanded the market dramatically.
Thus, bond markets have evolved from war financing to sophisticated platforms supporting global trade, corporate growth, and sustainable development.
3. Types of Bonds in Global Trading
The global bond market is diverse, with instruments catering to different needs:
Government Bonds
Issued by national governments.
Examples: U.S. Treasuries, UK Gilts, Japanese Government Bonds (JGBs), Indian G-Secs.
Seen as “risk-free” in stable economies.
Corporate Bonds
Issued by companies to fund operations or expansion.
Divided into investment-grade (safer, lower yields) and high-yield or junk bonds (riskier, higher yields).
Municipal Bonds (Munis)
Issued by state or local governments (popular in the U.S.).
Used to finance public infrastructure such as schools, roads, and hospitals.
Emerging Market Bonds
Issued by developing countries.
Offer higher returns but carry currency, political, and default risks.
Supranational and Multilateral Bonds
Issued by organizations like the World Bank, IMF, or European Investment Bank.
Support global development projects.
Green and Sustainable Bonds
Funds are directed toward environmentally friendly projects.
Growing rapidly as ESG investing gains momentum.
4. Key Players in Global Bond Markets
The global bond ecosystem involves multiple stakeholders:
Central Banks: Largest participants; they buy/sell bonds to control liquidity, set interest rates, and manage monetary policy.
Institutional Investors: Pension funds, insurance companies, and sovereign wealth funds are major long-term bondholders.
Investment Banks & Dealers: Act as intermediaries, underwriting new bond issues and facilitating secondary trading.
Hedge Funds: Use bonds for trading, arbitrage, and speculative strategies.
Retail Investors: Participate through mutual funds, ETFs, or direct purchases.
Credit Rating Agencies: Agencies like Moody’s, S&P, and Fitch assign ratings that guide investor decisions.
5. Bond Market Mechanics
Bond markets operate in two segments:
Primary Market: Where new bonds are issued. Issuers sell debt through auctions or syndications. Example: U.S. Treasury auctions.
Secondary Market: Where existing bonds are traded among investors, typically over-the-counter (OTC) or via electronic platforms.
Bond Pricing & Yield:
Price and yield move inversely.
Example: If interest rates rise, bond prices fall (because new bonds offer higher returns).
Yield types include current yield, yield to maturity (YTM), and yield to call.
Role of Ratings: Credit ratings (AAA, BBB, etc.) influence pricing and investor demand. A downgrade can sharply increase yields and reduce market value.
6. Factors Influencing Global Bond Markets
Bond markets are shaped by multiple macro and microeconomic factors:
Interest Rates: Central banks (Fed, ECB, BoJ, RBI) heavily influence bond yields. Rising rates usually depress bond prices.
Inflation: High inflation erodes the real return on bonds, leading to higher yields.
Currency Fluctuations: Foreign investors consider currency risks when buying bonds denominated in other currencies.
Credit Risk: Corporate health, sovereign debt sustainability, and fiscal deficits impact bond demand.
Geopolitical Events: Wars, sanctions, and global crises (COVID-19, Ukraine war) cause volatility in bond flows.
7. Trading Strategies in Global Bonds
Professional bond traders use several strategies:
Duration & Yield Curve Plays: Adjusting portfolios based on expectations of interest rate changes.
Credit Spread Trading: Exploiting differences in yields between corporate and government bonds.
Relative Value Trading: Identifying mispriced bonds compared to peers.
Carry Trade: Borrowing in low-yield currencies to invest in high-yield bonds abroad.
Hedging with Derivatives: Using bond futures, swaps, and options to manage risk.
8. Technology and Innovation in Bond Trading
The last two decades brought digital transformation:
Electronic Platforms: MarketAxess, Tradeweb, and Bloomberg revolutionized bond trading.
Algorithmic & AI-driven Trading: Helps in pricing, liquidity discovery, and execution.
Blockchain & Tokenization: Pilot projects are issuing bonds on blockchain, making settlement faster and transparent. Example: World Bank’s “Bond-i.”
9. Risks in Global Bond Trading
Key risks include:
Interest Rate Risk: Prices fall when rates rise.
Credit Risk: Risk of default by issuer.
Liquidity Risk: Some bonds, especially in emerging markets, may be hard to sell.
Currency Risk: Exchange rate volatility impacts foreign investors.
Systemic Risk: Global financial crises often spread through bond markets.
10. Global Bond Markets and Economic Impact
Government Financing: Bonds fund deficits and infrastructure.
Corporate Growth: Companies raise funds without diluting equity.
Capital Flows: Bonds attract cross-border investments, impacting currency values.
Financial Stability: Safe-haven government bonds provide security during crises.
Conclusion
Global bond trading is the invisible engine powering economies worldwide. From funding government welfare to financing corporate innovation, from stabilizing financial systems to driving sustainable growth, bonds remain indispensable. While risks exist—from interest rates to geopolitics—the continued evolution of technology and sustainability ensures that the global bond market will remain at the forefront of finance for decades to come.
Index Futures & Options1. Introduction to Index Derivatives
Financial markets thrive on two main goals: wealth creation and risk management. Investors, traders, and institutions constantly look for tools that can help them protect against uncertainties or magnify profits. One such set of tools are derivatives, financial contracts whose value is derived from an underlying asset such as stocks, commodities, currencies, or indices.
Within the derivatives universe, Index Futures and Options are among the most widely traded instruments globally. They are not based on a single stock but on a basket of stocks represented by a market index like the S&P 500 (US), Nifty 50 (India), FTSE 100 (UK), or Nikkei 225 (Japan).
Why indices? Because they reflect the overall performance of a market segment or economy, making them powerful tools for broad-based speculation, hedging, and arbitrage.
2. What are Index Futures?
An Index Future is a standardized derivative contract traded on an exchange where two parties agree to buy or sell the value of an index at a future date for a pre-agreed price.
Unlike stock futures, index futures do not involve delivery of actual shares since an index itself cannot be delivered. Instead, they are cash-settled contracts.
For example:
Suppose the Nifty 50 index is at 20,000 points today.
You buy one Nifty Futures contract expiring next month at 20,100 points.
If, on expiry, Nifty closes at 20,500, you make a profit of 400 points × lot size.
If it closes at 19,800, you incur a loss of 300 points × lot size.
Key Features of Index Futures:
Underlying: A stock market index.
Lot Size: Fixed by the exchange (e.g., 50 units for Nifty in India).
Cash Settlement: No delivery of shares, only the difference in value.
Margin Requirement: Traders must deposit initial and maintenance margins.
Leverage: Small capital controls large exposure.
3. Mechanics of Index Futures Trading
Steps Involved:
Select Index Future (e.g., Nifty, S&P 500).
Choose Expiry (monthly, weekly in some markets).
Place Buy/Sell Order on exchange.
Margin Blocked: Initial margin required (5–12% typically).
Mark-to-Market (MTM) Settlement: Daily profits/losses adjusted in trader’s account.
Expiry Settlement: Final cash settlement at index closing price.
Example:
Trader A buys Nifty Futures at 20,000.
Next day Nifty closes at 20,200.
Profit = 200 × 50 (lot size) = ₹10,000 credited to Trader A.
This daily settlement ensures default risk is minimal.
4. What are Index Options?
An Index Option is a derivative contract that gives the buyer the right (but not obligation) to buy or sell an index at a pre-decided strike price before or on a specified expiry date.
Like futures, index options are cash-settled since indices cannot be delivered physically.
Types of Index Options:
Call Option (CE) – Right to buy index at strike price.
Put Option (PE) – Right to sell index at strike price.
The seller (writer) of the option, however, has the obligation to fulfill the contract if the buyer exercises it.
5. Types of Index Options (Call & Put)
Let’s simplify with an example using Nifty 50:
Call Option Example:
Nifty = 20,000.
You buy a Call Option (CE) with Strike = 20,100 at Premium = 150.
On expiry, if Nifty = 20,400 → Intrinsic value = 300; Profit = 150 (after premium).
If Nifty < 20,100 → Option expires worthless; Loss = Premium (150).
Put Option Example:
Nifty = 20,000.
You buy a Put Option (PE) with Strike = 19,800 at Premium = 120.
On expiry, if Nifty = 19,400 → Intrinsic value = 400; Profit = 280 (after premium).
If Nifty > 19,800 → Option expires worthless; Loss = Premium (120).
6. Pricing & Valuation Concepts
Index futures and options pricing depends on multiple factors:
Futures Pricing (Cost of Carry Model):
Futures Price = Spot Price × (1 + r – d)^t
Where,
r = Risk-free interest rate
d = Expected dividend yield
t = Time to expiry
Option Pricing (Black-Scholes Model):
Key Inputs:
Spot Index Level
Strike Price
Time to Expiry
Volatility
Risk-free Rate
Dividends
Options’ premiums consist of:
Intrinsic Value = Difference between spot and strike.
Time Value = Premium paid for future uncertainty.
7. Key Strategies using Index Futures & Options
Futures Strategies:
Directional Trading:
Buy futures if bullish on market.
Sell futures if bearish.
Hedging:
Long-term investors sell index futures to hedge portfolio risk.
Arbitrage:
Exploit mispricing between futures and spot market.
Options Strategies:
Protective Put: Buy puts to protect long portfolio.
Covered Call: Sell call against index holdings to earn premium.
Straddle: Buy call + put at same strike → profit from high volatility.
Strangle: Buy OTM call + OTM put → cheaper than straddle.
Iron Condor: Combination of spreads → profit in low volatility.
8. Role in Hedging & Speculation
Hedging:
Institutional investors with large portfolios use index derivatives to offset market-wide risks. Example: A mutual fund holding 500 crores worth of stocks may sell Nifty futures to hedge against a market fall.
Speculation:
Traders with directional views use leverage in index futures/options to profit from short-term moves.
Portfolio Insurance:
Buying index puts acts as insurance during market downturns.
9. Advantages & Disadvantages
Advantages:
Efficient hedging tool.
High liquidity in major indices.
Cash settlement – no delivery hassle.
Lower cost compared to trading multiple individual stock options.
Good for expressing macro views.
Disadvantages:
Leverage magnifies losses.
Options can expire worthless.
Requires good understanding of pricing & volatility.
Market risks cannot be eliminated fully.
10. Risks & Challenges
Leverage Risk: Small move in index can wipe out margins.
Volatility Risk: Option buyers may lose premium if volatility drops.
Liquidity Risk: Smaller indices may have low volume.
Systemic Risk: Large index moves can create margin pressures across market.
11. Global Market Practices
US Markets: S&P 500 Futures & Options most traded globally (CME, CBOE).
India: Nifty 50, Bank Nifty dominate F&O segment (NSE).
Europe: FTSE, DAX index derivatives popular.
Asia: Nikkei 225, Hang Seng actively traded.
These instruments are also used by hedge funds, mutual funds, pension funds, and sovereign wealth funds to manage exposure.
12. Case Studies & Examples
2008 Financial Crisis:
Portfolio managers used index puts to hedge against market collapse.
Those without hedges faced catastrophic losses.
Indian Market Example:
During Budget announcements, traders use straddles/strangles on Nifty due to expected high volatility.
Global Funds:
US-based funds often use S&P 500 futures to hedge international equity exposure.
13. Conclusion
Index Futures & Options are powerful instruments that serve dual roles:
Risk Management (Hedging)
Profit Generation (Speculation & Arbitrage)
For institutions, they act as portfolio insurance. For traders, they provide opportunities to capitalize on short-term moves. However, they demand discipline, risk management, and understanding of market mechanics.
In a world where uncertainty is constant, index derivatives are no longer optional – they are essential for anyone engaged in serious investing or trading.