BITCOIN - time to buy BTCUSD nowBITCOIN (BTC/USD) has recently been stuck inside a triangle channel pattern and has struggled to break out for a few weeks. However, the price has recently broken a strong resistance level (the white trend line shown on the chart) - The price is currently above the trend line which acted as a strong resistance level and is now very likely to hit the next resistance zone which is labeled as the take profit level. Buy BTCUSD now!
Tradingindicator

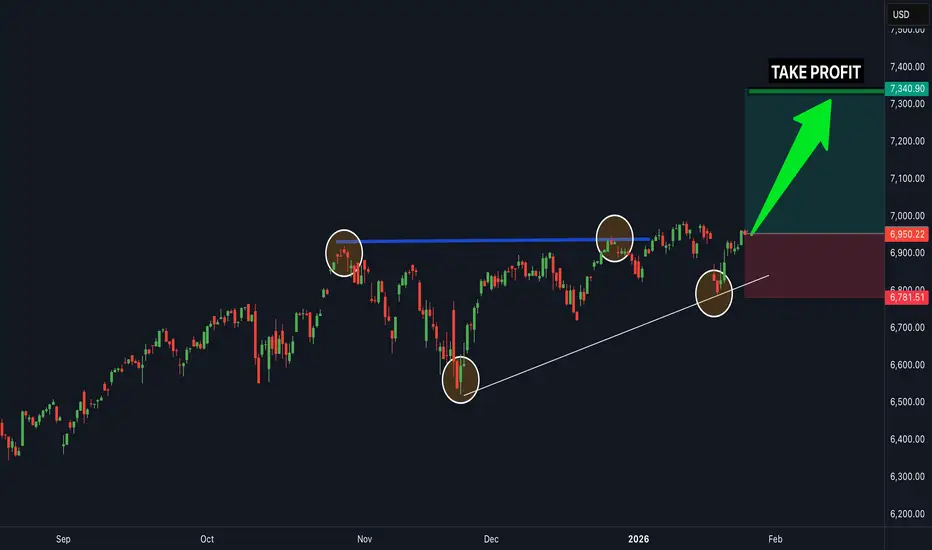
SPX.. time to buy nowSPX 500 is in a clear upwards channel and has broken the last bit of resistance (white trendline line shown) - this is a clear confirmation that the next target will be the next resistance zone to the upside shown above (this is a great buy trade opportunity) - time to buy SPX 500 now...
NZDUSD - Time To BuyNZDUSD was in a recent downtrend for the last few weeks and was struggling to stay bullish, but recently it has just broken a strong resistance trend line which it tested several times and failed to break through. NZDUSD is very likely to hit the next major resistance zone which is market as the "TAKE PROFIT" LEVEL. There are many clear signs of new bullish movements. BUY NZDUSD now.

BUY USDJPY now...USDJPY has been in a very clear uptrend for the last few weeks but recently dropped a slight bit in the last 24 hours down to a powerful support level! It is currently held by strong support levels which means it is extremely likely to keep heading to the upside for much longer. The next target will be the fibonacci extension zone which is shown on the chart. USDJPY has struggled to break below support but has constantly been breaking through resistance levels. time to BUY USDJPY.

Buy AUDUSD nowAUDUSD was in a recent downtrend for the last few weeks and struggled to stay bullish, but recently it has just broken a strong resistance trend line which it tested several times and failed to break through. AUDUSD is very likely to hit the next major resistance zone which is market as the "TAKE PROFIT" LEVEL. There are many clear signs of new bullish movements. BUY AUDUSD now

USDJPY time to buy nowUSDJPY has been in a very clear uptrend for the last few weeks and has been for a while! It is currently inside an upward channel and has recently broken the last major resistance zone which means it is extremely likely to keep heading to the upside for much longer (just a very minor resistance level which is causing slight delays for its bullish movements). The next target will be the fibonacci extension zone which is shown on the chart. USDJPY has struggled to break below support but has constantly been breaking through resistance levels. time to BUY USDJPY.

GBPUSD buy nowGBPUSD was in a recent downtrend for the last few weeks and struggled to stay bullish, but recently it has just broken a strong resistance trend line which it tested several times and failed to break through. GBPUSD is very likely to hit the next major resistance zone which is market as the "TAKE PROFIT" LEVEL. There are many clear signs of new bullish movements. Buy GBPUSD.

Buy AUDUSD nowAUDUSD was in a recent downtrend for the last few weeks and struggled to stay bullish, but recently it has just broken a strong resistance trend line which it tested several times and failed to break through. AUDUSD is very likely to hit the next major resistance zone which is market as the "TAKE PROFIT" LEVEL. There are many clear signs of new bullish movements. BUY AUDUSD now

USDJPY buy nowUSDJPY has been in a very clear uptrend for the last few weeks and has been for a while! It is currently inside an upward channel and has recently broken the last major resistance zone which means it is extremely likely to keep heading to the upside for much longer (just a very minor resistance level which is causing slight delays for its bullish movements). The next target will be the fibonacci extension zone which is shown on the chart. USDJPY has struggled to break below support but has constantly been breaking through resistance levels. BUY USDJPY NOW.

NZDUSD - Buy nowNZDUSD was in a recent downtrend for the last few weeks and was struggling to stay bullish, but recently it has just broken a strong resistance trend line which it tested several times and failed to break through. NZDUSD is very likely to hit the next major resistance zone which is market as the "TAKE PROFIT" LEVEL. There are many clear signs of new bullish movements. BUY NZDUSD now.

EURUSD ...Time To Buy Now!EURUSD was in a recent downtrend for the last few weeks and struggled to stay bullish, but recently it has just broken a strong resistance trend line which it tested several times and failed to break through. EURUSD is very likely to hit the next major resistance zone which is market as the "TAKE PROFIT" LEVEL. There are many clear signs of new bullish movements. Buy EURUSD now.

BITCOIN - buy bitcoin nowBITCOIN (BTC/USD) has recently been stuck inside a triangle channel pattern and has struggled to break out for a few weeks. However, the price has recently broken a strong resistance level (the white trend line shown on the chart) - The price is currently above the trend line which acted as a strong resistance level and is now very likely to hit the next resistance zone which is labeled as the take profit level. time to buy BITCOIN now!

EURUSD ... Buy now!EURUSD was in a recent downtrend for the last few weeks and struggled to stay bullish, but recently it has just broken a strong resistance trend line which it tested several times and failed to break through. EURUSD is very likely to hit the next major resistance zone which is market as the "TAKE PROFIT" LEVEL. There are many clear signs of new bullish movements. time to Buy EURUSD..

NZDUSD - TIME TO BUYNZDUSD was in a recent downtrend for the last few weeks and was struggling to stay bullish, but recently it has just broken a strong resistance trend line which it tested several times and failed to break through. NZDUSD is very likely to hit the next major resistance zone which is market as the "TAKE PROFIT" LEVEL. There are many clear signs of new bullish movements. TIME TO BUY NZDUSD.

BUY Gold (xauusd) XAUUSD (GOLD) was recently in a short term downtrend for a few weeks but has now shown some clear bullish movements ahead. XAUUSD (Gold) has broken out of a downward trend channel that was acting as strong resistance, The price is very likely to head to the next strong resistance level which is marked as the take profit zone (green line). Time to buy gold XAUUSD.

USDJPY (time to buy)USDJPY has been in a very clear uptrend for the last few weeks and has been for a while! It is currently inside an upward channel and has recently broken the last major resistance zone which means it is extremely likely to keep heading to the upside for much longer (just a very minor resistance level which is causing slight delays for its bullish movements). The next target will be the fibonacci extension zone which is shown on the chart. USDJPY has struggled to break below support but has constantly been breaking through resistance levels. time to BUY USDJPY NOW.

Time to BUY AUDUSD... AUDUSD was in a recent downtrend for the last few weeks and struggled to stay bullish, but recently it has just broken a strong resistance trend line which it tested several times and failed to break through. AUDUSD is very likely to hit the next major resistance zone which is market as the "TAKE PROFIT" LEVEL. There are many clear signs of new bullish movements. BUY AUDUSD now - buy AUDUSD now.

GBPUSD - time to buyGBPUSD was in a recent downtrend for the last few weeks and struggled to stay bullish, but recently it has just broken a strong resistance trend line which it tested several times and failed to break through. GBPUSD is very likely to hit the next major resistance zone which is market as the "TAKE PROFIT" LEVEL. There are many clear signs of new bullish movements. Buy GBPUSD now.

GBPUSD - buy now it's going upGBPUSD was in a recent downtrend for the last few weeks and struggled to stay bullish, but recently it has just broken a strong resistance trend line which it tested several times and failed to break through. GBPUSD is very likely to hit the next major resistance zone which is market as the "TAKE PROFIT" LEVEL. There are many clear signs of new bullish movements. Buy GBPUSD now it's going up

Time to BUY AUDUSD now it's going upAUDUSD was in a recent downtrend for the last few weeks and struggled to stay bullish, but recently it has just broken a strong resistance trend line which it tested several times and failed to break through. AUDUSD is very likely to hit the next major resistance zone which is market as the "TAKE PROFIT" LEVEL. There are many clear signs of new bullish movements. BUY AUDUSD now - buy AUDUSD now it's going up

USDJPY (great buy trade ahead)USDJPY has been in a very clear uptrend for the last few weeks and has been for a while! It is currently inside an upward channel and has recently broken the last major resistance zone which means it is extremely likely to keep heading to the upside for much longer (just a very minor resistance level which is causing slight delays for its bullish movements). The next target will be the fibonacci extension zone which is shown on the chart. USDJPY has struggled to break below support but has constantly been breaking through resistance levels. BUY USDJPY NOW it's going up

BUY Gold (xauusd) - it's going upXAUUSD (GOLD) was recently in a short term downtrend for a few weeks but has now shown some clear bullish movements ahead. XAUUSD (Gold) has broken out of a downward trend channel that was acting as strong resistance, The price is very likely to head to the next strong resistance level which is marked as the take profit zone (green line). buy gold XAUUSD. It's going up

NZDUSD - TIME TO BUY NOW - it's going upNZDUSD was in a recent downtrend for the last few weeks and was struggling to stay bullish, but recently it has just broken a strong resistance trend line which it tested several times and failed to break through. NZDUSD is very likely to hit the next major resistance zone which is market as the "TAKE PROFIT" LEVEL. There are many clear signs of new bullish movements. TIME TO BUY NZDUSD now it's going up
