Gold price analysis on January 5thGold opened the Asian session with very positive momentum, indicating a strong return of demand. On the technical chart, an inverse head-and-shoulders pattern is gradually completing, with the key neckline around 4400. If this level is clearly broken, gold is highly likely to enter a new upward phase, heading towards the 4480 resistance zone and possibly even higher peaks.
Given the prevailing bullish trend, the intraday trading strategy prioritizes buying opportunities and minimizing selling against the trend. Selling pressure will only become significant if the price breaks through and closes below the strong support zone around 4300, thus breaking the upward structure.
📈 Suggested Trading Strategy
BUY around 4390
BUY on a price rejection signal at the support zone of 4352 – 4304
Expected Target: 4480
⚠️ Risk Management
The bullish scenario is invalidated if the closing price falls below the key support zone (confirming a breakout of the structure).
Tradingpatterns

Gold price analysis November 24In the most recent session, gold continued to show signs of weakness when it failed to overcome the key resistance level of 4100. Profit-taking pressure appeared early and pulled the price back to the trendline - where the market is facing the risk of being broken if the selling pressure remains as it is. Once the trendline is broken, the short-term bullish structure will be completely broken and the correction range may extend to the deep support zone of 3935.
In this context, the most favorable strategy is to wait for the trendline breakout signal to trigger a SELL order, then follow the decline to the strong support zone of 3935.
Notable technical zones:
Support: 4040 – 4007 – 3935
Resistance: 4100 – 4145 – 5200
Recommended trading plan:
SELL when the price breaks the trendline around 4040
SELL DCA when the support of 4005 is broken
Target: 3935
Risk management: The bearish trend is invalidated if the candle closes back above 4100

Gold price analysis November 20Gold continues to show a solid reaction at the main trendline, indicating that the bullish structure is still maintained by organized buying. The market's continued respect for this support line is an important signal, keeping the possibility of extending the trend to the 4200 zone high.
However, it is important to note: a H4 candle closing below the trendline will be the first sign confirming the weakening of the bullish momentum. At that time, the balance of forces will tilt towards the sellers and the price may correct deeply to the 3936 zone - the confluence of the next strong support.
Recommended strategy:
Activate BUY when the market shows a price rejection signal at 4041.
Profit target: 4200.
Risk management: H4 closes below 4041 → switch to SELL strategy, aiming at 3936.

Gold price analysis November 19Gold is showing a very positive reaction around the large-frame trendline, where buying pressure is quite strong. The break of the key resistance zone 4080 has opened up a new bullish momentum and sent the market straight towards the psychological level of 4100. The bullish structure is more clearly consolidated and the current momentum is targeting the resistance zone 4145 – the upper range of today's trading session.
The previous BUY setups have worked out well, especially the position from 4075 which has given impressive profits. The overall trend remains in favor of the buyers while the important support zones continue to be well defended.
💡 Reference strategy:
Current BUY around 4090
BUY when price rejection signal at support 4080
BUY DCA when price breaks 4103
Target: 4175 – even extend to 4200
Risk: trend invalidated if price breaks trendline and closes candle below 4050

Gold price analysis November 18XAUUSD continues to be under downward pressure as the sellers have a clear advantage, pulling the price down to the support zone of 3933. The buyers' efforts to hold the price at the trendline are quite weak, indicating that this support structure is at risk of being penetrated and the market may extend its decline to lower areas.
At this point, observing the price reaction at important support levels on the chart is the key factor to find a safe entry point.
Preferred trading scenario:
BUY when the market refuses to fall deeply and there is a clear reversal signal at the zone of 3973 - 3933.
Target: immediate target towards 4104, further extension to 4203.
Risk note: the uptrend will be invalidated if the H4 candle closes below 3933.

Gold price analysis October 11✨ Gold Analysis XAUUSD – 10/11/2025
Gold price has officially broken the Keylevel 4031 zone, confirming a strong bullish wave is forming. This development makes the intraday trading strategy clearer and more favorable when giving full priority to BUY setups following the trend.
Main scenario:
✅ BUY right at the price zone 4045
✅ BUY when the price rejection signal appears around the support zone 4031
🎯 Profit target: 4150
Sub-scenario (low risk):
❌ SELL is only considered if a false break appears and the price closes the candle back below 3985 – however, this possibility is currently very low.
👉 Comment: The break zone 4031 is the perfect confirmation point for the uptrend. Prioritize looking for buying opportunities with the main wave instead of trading against the trend.

Gold price analysis June 11✏️ XAUUSD Analysis — 06/11
Today's gold trading range is being established within 100 prices, limited by the resistance zone of 4031 and the support zone of 3931.
The main trend is still up, so the strategy of prioritizing BUY following the market momentum will be more suitable in this period.
The Keylevel zone of 4031 continues to play an important role — if the buying force is strong enough to break this zone, the next target will be 4150.
On the other hand, it is necessary to observe the price reaction around the trendline and the support zone of yesterday's Asian session to determine whether the buying force is still maintained or not.
📈 Trading Plan
BUY around 3984
BUY when there is a price rejection signal at support 3931
BUY DCA when price breaks 4031
🎯 Target: 4150
⚠️ Risk: when price breaks the trendline and closes the candle below 3930

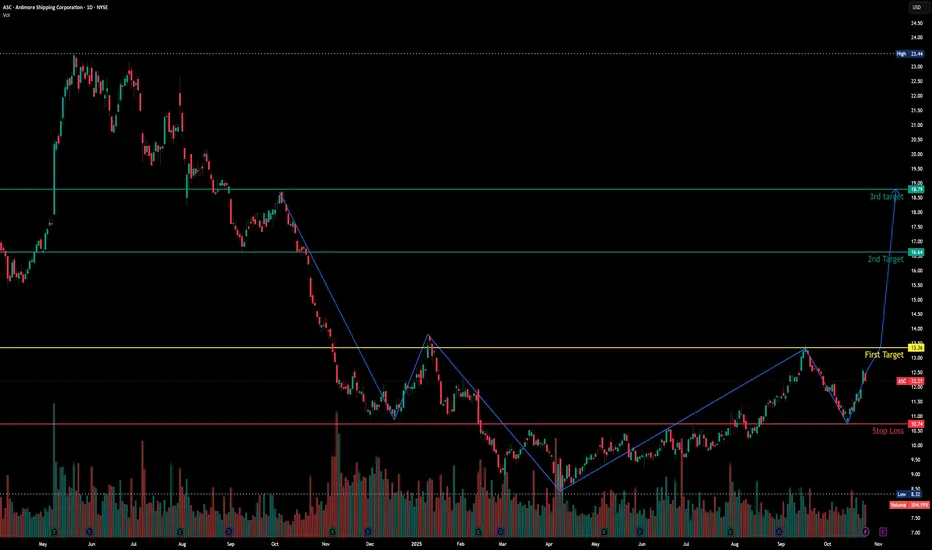
Ardmore Shipping Corp - Exciting Chart Pattern Disclaimer: This post is purely based on technical chart analysis and is not a recommendation to buy or sell. Please do your own research and consult with a financial advisor before making any investment decisions.
Last Year in May 2024, stock price was at nearly $23. from that level it fall to $8.5.
During this fall and rise, stock has made an inverted Head and Shoulder Chart Pattern.
According to my analysis , i have marked some of levels on the chart for reference.
Please share your thoughts.
Best wishes.
Gold price analysis October 21GOLD UPDATE – Buying opportunity is forming after a strong correction
Today's European session recorded a rather deep correction of gold, when the price fell nearly 100 USD before temporarily stabilizing again. However, the main trend is still leaning towards the Buyers, and the support zones below are considered ideal areas to observe BUY signals.
Notable zones include: 4223 – 4193 – 4267, where the market may react and create opportunities to enter orders.
The upcoming US session is still likely to maintain the upward momentum, so the priority strategy at this time is still to wait for BUY when there is a confirmation signal of price rejection at support.
🎯 Trading plan:
BUY NOW: 4367
BUY Trigger: when there is a signal of price rejection at 4223 or 4193
Target: 4500

BUY GOLD Gold will be buying and I’ve set a buy limit to make sure I’ll be able to catch it at the right time join in with me but keep it all professional and not too risky as we are following the trend

BNB/USD – Testing Patience Below the 200-SMA📈 Bias: NEUTRAL (reversal watch)
BNB trades around $1,186, consolidating after last week’s sharp pullback. Price remains capped under the 200-SMA ($1,238), suggesting the trend is still under pressure but flattening.
RSI near 46 shows recovering momentum. If bulls reclaim $1,223–$1,238, a shift to bullish bias is likely; failure to hold $1,178 opens the door to $1,145 support retest.
📊 Key Levels:
Resistance: $1,223 / $1,238
Support: $1,178 / $1,145

Global Market Participants: Players Shaping the World Economy1. Understanding Global Market Participants
A market participant refers to any individual, institution, or entity that engages in buying, selling, or investing in financial instruments such as stocks, bonds, currencies, derivatives, or commodities. Their participation drives market activity, facilitates capital allocation, and ensures continuous price formation through demand and supply.
Global market participants can broadly be divided into institutional participants and non-institutional (retail) participants. Institutional participants dominate the market due to their large capital base and sophisticated strategies, while retail participants add diversity and depth.
2. Categories of Global Market Participants
a) Central Banks
Central banks are the most influential entities in the financial world. They control a nation's monetary policy, manage foreign exchange reserves, and stabilize the currency and financial system. Examples include the U.S. Federal Reserve, European Central Bank (ECB), Bank of Japan (BoJ), and Reserve Bank of India (RBI).
Key functions:
Setting benchmark interest rates.
Controlling money supply to influence inflation and growth.
Managing exchange rate stability.
Acting as a lender of last resort during crises.
Regulating the banking sector.
Central banks’ decisions can cause global ripple effects. For instance, a rate hike by the U.S. Fed can strengthen the U.S. dollar, attract global capital inflows, and pressure emerging market currencies.
b) Commercial Banks
Commercial banks are vital intermediaries between savers and borrowers. They accept deposits, provide loans, and participate actively in money markets, foreign exchange markets, and credit markets.
Their roles include:
Facilitating trade finance and foreign exchange transactions.
Managing corporate treasury operations.
Participating in interbank lending.
Investing in sovereign bonds and other assets.
Commercial banks also engage in proprietary trading and market-making, providing liquidity to the market.
c) Investment Banks
Investment banks specialize in capital market operations, helping companies raise funds through IPOs, bond issuances, or private placements. They also provide advisory services for mergers and acquisitions (M&A), portfolio management, and structured finance.
Major global players like Goldman Sachs, Morgan Stanley, and J.P. Morgan play crucial roles in shaping global capital flows.
Core functions:
Underwriting securities.
Advising on mergers and acquisitions.
Asset securitization.
Providing derivatives and risk management solutions.
Investment banks are considered the "architects" of global finance, linking capital seekers and investors across continents.
d) Institutional Investors
Institutional investors are large organizations that invest on behalf of clients or members. They include mutual funds, pension funds, insurance companies, and sovereign wealth funds.
Examples:
BlackRock and Vanguard (mutual funds)
CalPERS (pension fund)
Norwegian Sovereign Wealth Fund
Allianz and AIA Group (insurance firms)
Importance:
They manage trillions of dollars, often determining global market trends.
They are long-term investors, influencing corporate governance.
Their actions impact asset allocation, market liquidity, and volatility.
Institutional investors’ investment decisions are data-driven, often guided by macroeconomic conditions, risk models, and diversification strategies.
e) Hedge Funds
Hedge funds are privately managed investment vehicles that use sophisticated strategies to generate high returns. They often employ leverage, short selling, arbitrage, and derivatives trading to exploit market inefficiencies.
Examples: Bridgewater Associates, Renaissance Technologies, and Citadel.
Their significance:
Hedge funds enhance market efficiency by arbitraging mispriced assets.
They take contrarian or speculative positions.
Their rapid trading strategies can amplify market volatility, especially in times of stress.
Hedge funds are major players in currency, commodity, and derivatives markets, frequently setting trends that influence other investors.
f) Corporations and Multinational Companies
Large corporations are key participants, especially in foreign exchange and commodity markets. They engage in international trade, requiring them to manage currency exposure and input cost fluctuations.
For example:
A U.S.-based company exporting to Europe may hedge against a weakening euro.
An airline company may hedge fuel costs using futures contracts.
Corporations also issue bonds or equities to raise capital, becoming integral to capital market operations. Their strategic financial management contributes to overall market stability and liquidity.
g) Sovereign Wealth Funds (SWFs)
SWFs are state-owned investment funds that invest surplus revenues (often from oil exports or trade surpluses) into global assets like stocks, bonds, infrastructure, and real estate.
Examples:
Norway’s Government Pension Fund Global
Abu Dhabi Investment Authority
China Investment Corporation
Role in markets:
Provide long-term, stable capital inflows.
Invest counter-cyclically during market downturns.
Promote cross-border investments and global diversification.
SWFs are crucial in stabilizing markets, especially during economic downturns, as their investment horizon spans decades.
h) Retail Investors
Retail investors — individual participants — are the foundation of market democratization. They invest through stock exchanges, mutual funds, ETFs, and online trading platforms.
Characteristics:
Smaller investment size.
Motivated by wealth creation, savings, or speculation.
Increasingly active through mobile trading apps and social trading platforms.
Retail investors have gained immense power in recent years, driven by digitalization and financial literacy. Events like the GameStop short squeeze (2021) demonstrated how retail participation can disrupt institutional dominance.
i) Brokers and Market Makers
Brokers facilitate transactions between buyers and sellers, while market makers continuously quote buy (bid) and sell (ask) prices to provide liquidity.
Roles:
Ensuring price discovery and efficient order execution.
Offering leverage and margin trading to clients.
Acting as intermediaries for foreign exchange and derivatives trading.
With algorithmic trading, many market-making activities are now automated through high-frequency trading (HFT) systems.
j) Regulatory Bodies and Exchanges
Although not direct investors, regulators and exchanges are crucial participants ensuring market integrity, transparency, and stability.
Examples:
U.S. SEC (Securities and Exchange Commission)
FCA (UK)
SEBI (India)
Financial exchanges: NYSE, NASDAQ, LSE, NSE, and CME.
Regulators safeguard investor interests, while exchanges serve as platforms for price discovery, trading, and clearing.
3. The Interconnectedness of Global Market Participants
Modern financial markets are highly interconnected. A decision by one participant — such as the Federal Reserve’s rate change — can ripple through global markets, influencing bond yields, equity valuations, and currency rates worldwide.
For example:
Central banks influence the cost of capital.
Institutional investors allocate funds globally, affecting capital flows.
Corporations react by adjusting hedging or investment strategies.
Retail investors respond through short-term trading or portfolio rebalancing.
This web of interactions defines the global financial ecosystem, where every participant indirectly shapes the behavior of others.
4. Technological Evolution and Market Participation
Technology has dramatically reshaped how participants interact. The rise of algorithmic trading, blockchain, AI analytics, and fintech platforms has made markets more efficient but also more complex.
Key transformations:
Automation: AI-based trading systems execute millions of trades per second.
Accessibility: Retail investors can trade global markets via mobile apps.
Transparency: Blockchain enables auditable and secure transactions.
Data-driven decisions: Big data helps institutions forecast market trends.
These innovations have lowered entry barriers but also increased systemic risk due to automation and cyber vulnerabilities.
5. The Role of Market Participants During Crises
During crises like the 2008 Global Financial Crisis or COVID-19 pandemic, the coordination between participants becomes critical.
Central banks injected liquidity and cut rates.
Governments implemented fiscal stimulus.
Institutional investors rebalanced portfolios toward safer assets.
Retail investors used market dips as buying opportunities.
Such coordinated yet diverse actions reflect how the global market’s resilience depends on its participants’ adaptability.
6. Challenges and Risks for Market Participants
Despite advances, participants face persistent challenges:
Volatility and uncertainty: Driven by geopolitical events and rate changes.
Currency fluctuations: Affect cross-border investments and trade.
Regulatory tightening: Especially after financial crises.
Technological risks: Cyberattacks and algorithmic malfunctions.
Liquidity risks: Especially during sudden market stress.
Participants must balance risk and reward using advanced hedging, diversification, and compliance strategies.
7. The Future of Global Market Participation
The next decade will redefine global participation patterns through:
Sustainable investing (ESG): Institutions prioritizing environmental and social factors.
Decentralized finance (DeFi): Blockchain enabling peer-to-peer trading.
Cross-border digital assets: Cryptocurrencies becoming mainstream.
AI-driven trading ecosystems: Enhancing efficiency but raising ethical concerns.
The blend of traditional and digital participants will create a hybrid global market that is more inclusive, transparent, and data-centric.
8. Conclusion
Global market participants are the lifeblood of the international financial system. Each plays a distinctive yet interconnected role in maintaining liquidity, enabling capital formation, and ensuring efficient price discovery. From central banks that dictate monetary policy to individual traders executing positions on mobile apps, every participant contributes to the constant pulse of global finance.
As globalization deepens and technology evolves, the diversity and complexity of market participants will continue to expand. Understanding their functions, interrelations, and influences is not just essential for traders or economists — it’s vital for anyone seeking to grasp how modern finance truly operates.
In essence, the story of global markets is the story of its participants — dynamic, interdependent, and constantly evolving in pursuit of opportunity, stability, and growth.

BTCUSDT Cut n Reverse Area? what's next??#BTCUSDT - perfect holdings upside as we discussed in our last idear regarding Bitcoin and now market just reached at his ultimate area/region, that is around 107500-700
keep close that region because that is market full n final region for buyers.
dont hold your buying positions below that.
NOTE: we will go for cut n reverse below that that region.
good luck
trade wisely

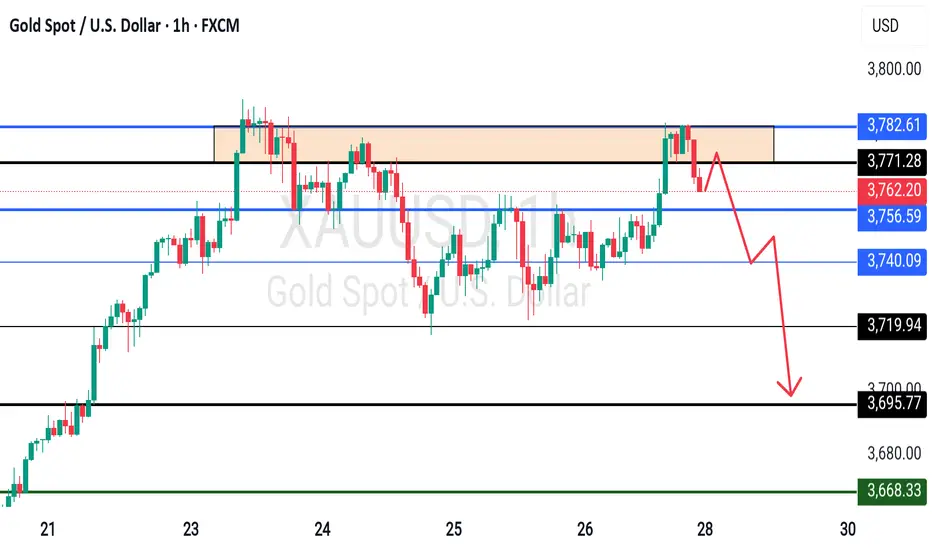
GOLD High placed? What's next??#GOLD.. market placed a very reasonable high so far and now going to break his supporting area.
Kep close upside region that can play major role in next move.
Don't be lazy here.
NOTE: we will go for cut n reverse above region not before that.
Good luck
Trade wisely
Globalization and De-GlobalizationPart I: Understanding Globalization
1. The Concept of Globalization
Globalization is the process through which countries and societies become more connected through trade, technology, investment, culture, and politics. It is not a new phenomenon. Historically, trade routes like the Silk Road or colonial expansions already linked distant societies. However, modern globalization is faster, broader, and more complex because of digital technologies, modern transportation, and global institutions.
2. Historical Phases of Globalization
Pre-modern globalization (before 1500): Exchange of goods, ideas, and culture through ancient trade routes.
Colonial globalization (1500–1800): European expansion, global maritime trade, and the integration of colonies into global markets.
Industrial globalization (1800–1945): Industrial revolution, rise of capitalism, mass migration, and colonial empires.
Post-WWII globalization (1945–1990): Bretton Woods system, establishment of IMF, World Bank, GATT (later WTO), rapid growth of multinational corporations.
Contemporary globalization (1990–present): Driven by digital revolution, liberalization of markets, China’s rise, and global value chains.
3. Drivers of Globalization
Economic factors: Free trade agreements, foreign direct investment, outsourcing, and global supply chains.
Technological factors: Internet, smartphones, containerization in shipping, aviation, artificial intelligence.
Political factors: Collapse of the Soviet Union, liberalization of China and India, neoliberal policies.
Cultural factors: Spread of movies, music, cuisine, tourism, and global media.
Institutional factors: Role of WTO, UN, World Bank, IMF in shaping global rules.
4. Key Features of Globalization
Free movement of goods and services through trade liberalization.
Capital mobility via foreign investments, stock markets, and financial flows.
Labor mobility, including migration and outsourcing.
Knowledge and cultural diffusion through digital platforms and global communication.
Global governance, where international rules and treaties influence domestic policies.
Part II: Benefits and Criticisms of Globalization
1. Benefits of Globalization
Economic growth: Countries like China, South Korea, and India grew rapidly by integrating into global trade.
Poverty reduction: Hundreds of millions lifted out of poverty, particularly in Asia.
Access to technology and knowledge: Rapid spread of innovations like smartphones, vaccines, and renewable energy.
Cultural exchange: Increased exposure to different cuisines, languages, films, and lifestyles.
Global cooperation: Joint efforts in areas like climate change, health, and peacekeeping.
2. Criticisms of Globalization
Economic inequality: Benefits concentrated in urban elites, while rural and working-class populations often feel left behind.
Exploitation of labor: Sweatshops, poor working conditions, and child labor in developing countries.
Cultural homogenization: Local traditions sometimes overshadowed by dominant Western culture.
Environmental damage: Global supply chains contribute to carbon emissions and resource depletion.
Sovereignty concerns: National governments constrained by global corporations and institutions.
Part III: The Rise of De-Globalization
1. Defining De-Globalization
De-globalization refers to a process where countries reduce their interdependence and focus more on domestic or regional economies. It is not necessarily a complete reversal of globalization but a slowing down or selective disengagement.
2. Historical Precedents
The Great Depression (1930s): Countries adopted protectionism and trade barriers.
World Wars: Global connections broke down, leading to regional blocs.
Oil crises (1970s): Triggered energy nationalism and protectionist policies.
3. Contemporary Drivers of De-Globalization
Economic nationalism: Trade wars, tariffs, and policies favoring domestic industries (e.g., U.S.–China tensions).
Pandemics: COVID-19 exposed vulnerabilities in global supply chains, leading to “reshoring” or “nearshoring.”
Geopolitical tensions: Russia-Ukraine war, Taiwan conflict, Middle East instability.
Technological sovereignty: Push for domestic control over critical technologies like semiconductors and AI.
Environmental concerns: Shift toward local production and sustainable supply chains.
4. Examples of De-Globalization
Brexit: UK’s withdrawal from the European Union.
U.S.–China trade war: Tariffs, sanctions, and decoupling in technology.
Supply chain reshoring: Companies like Apple diversifying away from China.
Regionalization: Growth of regional trade agreements like RCEP (Asia) and USMCA (North America).
Part IV: Future of Globalization and De-Globalization
1. Hybrid Future
Most experts argue that globalization will not disappear entirely. Instead, we are entering a hybrid era where:
Supply chains become regional rather than fully global.
Countries balance global trade with domestic resilience.
Digital globalization (data, AI, e-commerce) grows even if physical trade slows.
2. Scenarios for the Future
Re-globalization: If countries overcome geopolitical rivalries and focus on cooperation in climate, health, and technology.
Fragmented globalization: World splits into competing blocs (U.S.-led, China-led, EU-led).
Selective de-globalization: Nations globalize in technology and finance but de-globalize in food, energy, and security.
3. Role of Key Actors
Governments: Balance between economic openness and protecting domestic interests.
Corporations: Redesign supply chains for resilience.
International institutions: Need reforms to stay relevant.
Civil society: Push for fairer, greener globalization.
Part V: Case Studies
1. China – From Globalization to Selective De-Globalization
China was the biggest winner of globalization, lifting millions out of poverty. But now, facing U.S. pressure, it is pursuing “dual circulation” – focusing on both domestic and global markets.
2. United States – Global Leader to Economic Nationalist
Once the champion of free trade, the U.S. has shifted toward reshoring, tariffs, and tech protectionism, especially under Trump and Biden administrations.
3. European Union – Between Integration and Fragmentation
The EU promotes internal integration but faces pressures like Brexit, energy crises, and immigration debates.
4. India – Strategic Balancing
India embraces globalization in IT and services but protects key sectors like agriculture. It seeks to position itself as an alternative manufacturing hub to China.
Part VI: Globalization vs. De-Globalization in Society
In economics: De-globalization raises costs but increases resilience.
In politics: Globalization fosters cooperation, while de-globalization strengthens sovereignty.
In culture: Globalization spreads diversity, but de-globalization protects heritage.
In environment: Globalization increases carbon footprints, but de-globalization can encourage local sustainability.
Conclusion
Globalization has been one of the most transformative forces in human history, reshaping economies, societies, and cultures. It has brought prosperity, connectivity, and innovation, but also inequality, environmental damage, and political tensions. De-globalization is not simply a rejection of globalization but a recalibration. The world is moving toward a more balanced model that emphasizes resilience, regional cooperation, and sustainability.
In the end, neither globalization nor de-globalization is inherently good or bad. Both are responses to changing realities. The challenge for policymakers, businesses, and societies is to shape globalization in a way that is more inclusive, equitable, and sustainable—while learning from the lessons of de-globalization.
Evolution of Currency Derivative Markets1. Introduction
Currency derivatives are financial instruments whose value derives from the underlying exchange rate between two currencies. They provide mechanisms to manage foreign exchange (FX) risk, which arises from fluctuations in currency prices due to factors like interest rate differentials, inflation, political instability, and trade imbalances.
The global rise of currency derivative markets is closely tied to the liberalization of capital markets, the growth of multinational corporations (MNCs), and the expansion of international trade and investment. These markets facilitate hedging, speculation, and arbitrage, helping both businesses and investors navigate currency volatility.
2. Early History of Currency Derivatives
2.1. Pre-Modern Currency Exchange Practices
Before formal derivatives, merchants and traders in the medieval and early modern periods engaged in primitive forms of currency risk management:
Bills of Exchange: Used in the 14th and 15th centuries by European merchants, these were agreements to pay a fixed sum in a specified currency on a future date. Bills of exchange allowed merchants to lock in currency rates, functioning as early hedging tools.
Forward Contracts: Even before organized exchanges, traders entered into informal forward contracts, agreeing to buy or sell currencies at predetermined rates in the future. These contracts were mostly over-the-counter (OTC) and tailored to specific needs.
2.2. Gold Standard Era (1870–1914)
Under the Gold Standard, currencies were pegged to gold, which limited exchange rate fluctuations. However, as international trade grew, currency forwards and options emerged to manage short-term settlement risks. Banks played a pivotal role, offering forward contracts and facilitating international trade settlements.
3. Post-War Era and Bretton Woods System
3.1. Bretton Woods Agreement (1944–1971)
The Bretton Woods system established fixed exchange rates pegged to the U.S. dollar, which was convertible to gold. While this reduced currency volatility, it created imbalances as countries occasionally intervened to maintain their pegged rates.
Emergence of Forward Markets: Despite fixed rates, forward contracts gained importance for hedging delayed settlement risks in international trade.
Limited Speculation: Currency speculation was constrained due to restrictions on capital flows.
3.2. Collapse of Bretton Woods and Floating Currencies
In 1971, the U.S. suspended gold convertibility, leading to the collapse of the Bretton Woods system. Currencies began to float freely, introducing higher volatility:
Need for Hedging: Firms and investors faced increasing exchange rate risks.
Rapid Growth of OTC Markets: Banks and financial institutions created forward, swap, and option contracts tailored to clients’ needs.
The 1970s thus marked the transition from stable currency regimes to highly dynamic currency derivative markets.
4. Development of Currency Derivative Instruments
Currency derivatives evolved into a variety of instruments, each serving different purposes:
4.1. Forwards
A forward contract is an agreement to buy or sell a currency at a specified rate on a future date. Initially OTC, forwards allow companies to hedge predictable foreign exchange exposures.
Advantages: Customizable, flexible terms.
Limitations: Lack of standardization, counterparty risk.
4.2. Futures
Currency futures emerged in organized exchanges during the late 1970s and 1980s:
Chicago Mercantile Exchange (CME): Introduced standardized currency futures in 1972, starting with the Deutsche Mark and the Swiss Franc.
Standardization: Futures have fixed contract sizes, expiration dates, and margin requirements, reducing counterparty risk.
Liquidity: Exchange-traded futures attract speculators and hedgers, creating deep liquidity.
4.3. Options
Currency options give the buyer the right, but not the obligation, to buy or sell a currency at a predetermined price:
Growth in the 1980s: Options gained popularity as firms and investors sought more flexible hedging strategies.
Over-the-Counter (OTC) Options: Early options were customized OTC contracts, later standardized and exchange-traded.
Complex Strategies: Options enabled hedging of non-linear risks and speculative strategies like straddles, strangles, and spreads.
4.4. Swaps
Currency swaps involve exchanging principal and interest payments in different currencies:
Origins in the 1980s: Developed to manage long-term funding and interest rate differentials.
Cross-Border Financing: Multinational corporations used swaps to access cheaper funding in foreign currencies.
Flexibility: OTC swaps allow for tailored terms based on currency and interest rate needs.
5. Growth of Currency Derivative Markets Globally
5.1. Expansion in the 1980s and 1990s
The 1980s and 1990s saw rapid expansion in currency derivative markets:
Financial Liberalization: Deregulation of capital markets increased cross-border investments, creating demand for currency hedging.
Technological Advancements: Electronic trading platforms improved market access, transparency, and execution speed.
Emergence of Major Players: Large commercial banks became central market makers, offering sophisticated hedging solutions.
5.2. Asian Financial Crisis (1997–1998)
The Asian financial crisis highlighted the importance of currency derivatives:
Lessons Learned: Poor risk management and lack of hedging strategies exposed firms to catastrophic losses.
Market Response: Firms and regulators increased the use of forwards, options, and swaps to mitigate currency risks.
Regulatory Focus: Supervisors emphasized transparency, reporting standards, and capital adequacy.
5.3. Eurozone and Globalization (2000s)
Globalization and the introduction of the euro accelerated currency derivative activity:
Euro Futures and Options: Standardized instruments facilitated intra-European hedging.
Emerging Market Currencies: As emerging markets liberalized, demand for derivatives in these currencies grew.
Increased Participation: Hedge funds, corporations, and retail investors became active participants.
6. Key Participants in Currency Derivative Markets
The evolution of these markets has been shaped by a diverse set of participants:
Commercial Banks: Primary market makers providing liquidity and risk management solutions.
Corporations: Hedging transactional and translational currency exposures.
Hedge Funds and Speculators: Engaging in arbitrage, speculation, and volatility trading.
Central Banks: Occasionally intervening to stabilize currencies or influence exchange rates.
Retail Traders: Increasingly participating via online platforms and brokers.
7. Role of Technology
7.1. Electronic Trading Platforms
The adoption of electronic trading platforms in the 1990s and 2000s revolutionized currency derivative markets:
Transparency: Real-time pricing and execution.
Access: Expanded participation from smaller firms and retail traders.
Efficiency: Reduced bid-ask spreads and operational costs.
7.2. Algorithmic and High-Frequency Trading
The rise of algorithms has further transformed markets:
Speed: Execution in milliseconds.
Liquidity Provision: Continuous bid-ask quotations improve market depth.
Risk Management: Advanced analytics optimize hedging strategies.
8. Regulatory Frameworks
Currency derivative markets operate under evolving regulatory oversight:
Basel Accords: Set standards for capital adequacy, particularly for OTC derivative exposures.
Dodd-Frank Act (2010, U.S.): Increased transparency and mandated central clearing for certain OTC derivatives.
European Market Infrastructure Regulation (EMIR): Enhanced reporting, clearing, and risk mitigation.
Emerging Markets Regulation: Countries like India, Brazil, and China established frameworks to regulate futures, options, and swaps while encouraging hedging.
9. Recent Trends
9.1. Increased Global Participation
Cross-border trade and investment have led to higher volumes in emerging market currency derivatives.
9.2. New Products
Exotic Options: Barrier, digital, and range options offer tailored risk management solutions.
Structured Products: Hybrid instruments combining swaps, forwards, and options for corporate clients.
9.3. Integration with Risk Management
Currency derivatives are now embedded in broader treasury and enterprise risk management frameworks, helping firms manage FX, interest rate, and commodity risks simultaneously.
10. Challenges and Future Directions
Despite their growth, currency derivative markets face several challenges:
Counterparty Risk: OTC contracts carry default risk, although central clearing mitigates this.
Market Volatility: Extreme events, like geopolitical tensions or central bank interventions, can disrupt pricing and liquidity.
Regulatory Divergence: Global inconsistencies create arbitrage and compliance complexities.
Future Directions:
Digital Currencies: Central Bank Digital Currencies (CBDCs) may transform FX trading.
AI and Analytics: Predictive modeling for FX volatility and automated hedging.
Sustainable Finance: Currency derivatives linked to ESG compliance and green financing.
11. Conclusion
The evolution of currency derivative markets reflects the interplay of globalization, financial innovation, and risk management needs. From rudimentary bills of exchange to sophisticated swaps and options, these markets have provided tools for hedging, speculation, and capital efficiency. Technological advancements, regulatory reforms, and changing market dynamics continue to shape the structure and functioning of currency derivatives. As global trade and investment grow, these markets are expected to remain central to financial stability and corporate strategy, adapting to innovations like digital currencies and AI-driven trading.
Understanding The OPEC’s Influence on Oil Prices1. Introduction
Oil is one of the most important commodities in the modern world. It powers transportation, fuels industries, and plays a central role in energy generation. Because of this, changes in oil prices can have far-reaching effects on global economies, governments, and households. At the center of the global oil market is the Organization of the Petroleum Exporting Countries (OPEC), an intergovernmental organization formed to coordinate and unify petroleum policies among member nations. This explanation explores the historical context, mechanisms, economic impact, challenges, and future outlook of OPEC’s influence on oil prices.
2. Historical Context and Formation of OPEC
OPEC was established in 1960 by five founding countries: Iran, Iraq, Kuwait, Saudi Arabia, and Venezuela. These countries faced a market dominated by multinational oil companies known as the “Seven Sisters,” which controlled production levels and pricing, often to the detriment of oil-producing nations.
Before OPEC, oil prices were largely dictated by these corporations, and producer nations had minimal influence over their own resources. This led to disparities between the value of the oil sold and the economic benefit received by producing countries. The creation of OPEC was a strategic move to gain collective control, stabilize oil markets, and secure fairer revenues.
Over time, OPEC expanded its membership, including countries from Africa, the Middle East, and South America. This expansion allowed it to consolidate influence over the global oil supply, making it a key player in international energy markets.
3. How OPEC Influences Oil Prices
OPEC primarily influences prices through production quotas. By agreeing on how much oil each member country can produce, OPEC can manage global oil supply and, indirectly, pricing.
Reduction in production: When OPEC cuts production, global oil supply decreases. If demand remains stable or increases, prices rise.
Increase in production: Conversely, raising production can lead to an oversupply in the market, causing prices to fall.
OPEC also influences prices through market signaling. Announcements about production targets, policy changes, or upcoming meetings often lead to immediate reactions in oil futures markets, even before actual production changes occur.
4. OPEC+ and Global Cooperation
In recent years, OPEC has expanded its influence through alliances with non-member countries, forming the OPEC+ group. This includes major producers like Russia. By coordinating production strategies with these countries, OPEC+ strengthens its ability to stabilize markets during periods of volatility.
For example, during the COVID-19 pandemic, global demand for oil dropped sharply. OPEC+ responded with large-scale production cuts, which helped prevent a further collapse in prices and supported oil-dependent economies.
5. OPEC’s Role in the Global Economy
Oil is not just another commodity—it is a strategic economic resource. Changes in oil prices have widespread economic consequences:
Inflation: High oil prices increase transportation and manufacturing costs, driving up prices of goods and services.
Trade balances: Oil-importing countries face higher import bills, affecting their balance of payments, while oil-exporting countries gain higher revenues.
Fiscal stability: Governments of oil-exporting countries rely heavily on oil revenues to fund budgets, infrastructure, and social programs.
OPEC’s decisions, therefore, have direct consequences for millions of people and can even shape economic policies in countries far beyond the Middle East and Africa.
6. Geopolitical Implications
Oil is also a geopolitical tool. OPEC’s decisions can reflect political motives as well as economic ones:
During conflicts or sanctions, OPEC can adjust production to support allies or respond to global pressures.
The 1973 oil embargo demonstrated the power of oil as a political weapon, causing prices to quadruple and triggering economic crises in Western countries.
OPEC’s influence is not just economic; it is also a form of soft power, capable of shaping global politics.
7. Challenges and Criticisms of OPEC
Despite its influence, OPEC faces several challenges:
Internal disagreements: Members have different economic priorities and domestic pressures, which sometimes lead to conflicts over production quotas.
Non-compliance: Some countries may produce more than their agreed quota to meet domestic needs, reducing the effectiveness of collective decisions.
Energy transition: The rise of renewable energy, electric vehicles, and energy efficiency measures reduces global dependence on oil, potentially limiting OPEC’s long-term influence.
Critics also argue that OPEC’s coordinated production decisions can resemble monopolistic behavior, artificially inflating prices to the disadvantage of consumers.
8. Market Perception and Speculation
OPEC’s influence extends beyond physical supply adjustments. Market perception plays a crucial role:
Traders and investors react not just to actual production changes, but to expectations of future actions.
Media statements, public speeches, and even rumors about OPEC decisions can cause significant price fluctuations.
Derivative markets, including futures, options, and swaps, reflect OPEC-related risks, amplifying the impact of both real and perceived actions.
This creates a complex interplay between fundamentals (actual supply and demand) and speculation, making OPEC’s influence both direct and indirect.
9. Case Studies of OPEC’s Impact
1. 1973 Oil Embargo:
Arab members of OPEC imposed an embargo against countries supporting Israel in the Yom Kippur War. Oil prices quadrupled, leading to severe economic disruptions in Western economies, highlighting the organization’s geopolitical and economic power.
2. 1980s Oil Market Adjustments:
OPEC attempted to maintain high prices, but market distortions and non-compliance among members forced production cuts to stabilize prices. This period demonstrated the challenges of maintaining cohesion.
3. COVID-19 Pandemic Response:
OPEC+ coordinated unprecedented production cuts to stabilize global oil markets when demand collapsed due to lockdowns. This helped prevent further price collapse and supported oil-dependent economies.
10. Future Outlook
OPEC’s influence is likely to continue, but the context is changing:
Global energy transition: As renewable energy and electric vehicles grow, oil demand may plateau or decline.
Technological innovation: Advances in energy efficiency and alternative fuels could reduce dependence on OPEC oil.
Geopolitical shifts: OPEC will need to navigate changing alliances and conflicts in global energy politics.
The organization’s ability to adapt to these trends, maintain cohesion among members, and manage expectations will determine its relevance in the coming decades.
11. Conclusion
OPEC remains a central player in global oil markets, capable of influencing prices through production quotas, market signaling, and strategic alliances. Its decisions affect economies worldwide, from inflation rates to national budgets and geopolitical strategies. Understanding OPEC’s influence requires analyzing both actual production decisions and market perceptions, as well as considering historical context and future energy trends.
While challenges exist, OPEC’s coordinated approach ensures that it remains a key driver of global oil prices and a significant actor in international economics and politics.
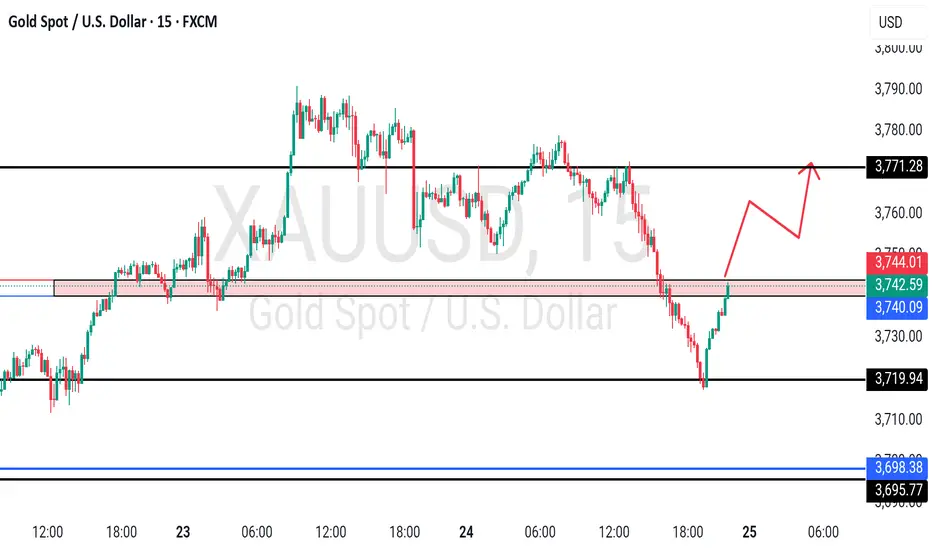
GOLD at breakout region? What's next??#GOLD - after a fantastic move now market again at his breakout area.
3740-45 that will be our current resistance area and above that we can expect again further rise.
Keep close and don't hold your shorts above that.
Good luck
Trade wisley
Global Commodity Supercycle: Myth or Reality?Understanding Commodity Supercycles
What is a Commodity Supercycle?
A commodity supercycle refers to a prolonged period (usually 10–30 years) of above-trend price growth across a wide range of commodities, driven by structural factors such as industrial revolutions, global wars, or the rise of large economies. Unlike short-term volatility caused by weather, political tensions, or monetary policies, supercycles are deeply tied to transformational demand shifts.
Key characteristics:
Duration: Long-lasting, often over a decade.
Breadth: Not limited to one commodity but across energy, metals, and agriculture.
Drivers: Demand-side shocks (e.g., rapid urbanization, population growth) or supply constraints (e.g., limited mining capacity, technological lags).
Historical Evidence of Commodity Supercycles
Economists generally agree on four major commodity supercycles in modern history:
1. The Late 19th Century (Industrial Revolution Expansion)
Fueled by industrialization in Europe and North America.
Demand for coal, steel, copper, and agricultural goods surged as cities grew.
Railroads, shipping, and mechanization created unprecedented commodity needs.
2. Early 20th Century (World Wars & Reconstruction)
World War I and World War II triggered immense demand for energy, metals, and food.
Post-war reconstruction in Europe and Japan kept demand elevated.
Agricultural products and oil saw sharp price surges.
3. Post-War Boom (1950s–1970s)
The U.S. and Europe experienced economic expansion, while Japan industrialized rapidly.
Oil crises of the 1970s pushed energy prices to historic highs.
This period was marked by strong global GDP growth and industrial demand.
4. China-Led Supercycle (2000–2014)
China’s entry into the World Trade Organization (2001) transformed global trade.
Rapid industrialization, urbanization, and infrastructure projects created insatiable demand for iron ore, copper, coal, and oil.
Commodity-exporting nations (Brazil, Australia, Russia, Middle East, Africa) thrived.
Prices peaked around 2011–2014 before collapsing as Chinese growth slowed and shale oil transformed supply dynamics.
Drivers of Commodity Supercycles
To assess whether a new supercycle is real, it’s essential to understand the core drivers:
1. Demographics & Urbanization
Rising populations require food, energy, housing, and infrastructure.
Urbanization in Asia and Africa remains a structural driver.
2. Industrialization & Technology
Industrial revolutions (steam engine, electricity, digital economy) bring new waves of commodity demand.
Current trends: renewable energy, electric vehicles, AI-driven data centers—all require copper, lithium, cobalt, and rare earths.
3. Global Trade & Economic Growth
Commodity supercycles thrive when global trade is open and economies expand.
Globalization in the 2000s amplified the China-led boom.
4. Supply Constraints
Mining, drilling, and farming face natural limits, capital intensity, and environmental regulations.
Infrastructure projects (mines, pipelines, railways) take years to build, making supply inelastic.
5. Geopolitics & Wars
Wars disrupt supply chains and create artificial scarcity.
Recent example: The Russia-Ukraine war drove up oil, gas, and wheat prices.
6. Monetary Policies & Inflation
Loose monetary policy (low interest rates, money printing) can fuel commodity speculation.
Commodities are often used as a hedge against inflation.
Arguments Supporting the “Reality” of a New Supercycle
Proponents of the new supercycle argue that we are at the beginning of another historic wave:
1. Green Energy Transition
Solar, wind, and EVs require massive amounts of copper, lithium, nickel, cobalt, and rare earths.
International Energy Agency (IEA) predicts demand for critical minerals could increase 4–6 times by 2040.
Renewable infrastructure and electrification of transport could drive decades of elevated prices.
2. Deglobalization & Supply Chain Shocks
Post-COVID and geopolitical tensions are shifting supply chains.
“Friend-shoring” and resource nationalism (countries restricting exports) are making commodities scarcer and pricier.
3. Underinvestment in Supply
After the 2014–2016 commodity crash, mining and energy companies cut investments.
Limited new supply means markets could face shortages as demand rises.
4. Global South Growth
Africa and South Asia are entering rapid urbanization and industrialization phases similar to China in the 2000s.
This could drive another long wave of commodity demand.
5. Inflation & Fiscal Policies
Massive fiscal spending (infrastructure projects in the U.S., India, China) will boost raw material demand.
Persistent inflation may keep commodity prices structurally high.
Arguments for the “Myth” of a Supercycle
Skeptics argue that what we are seeing is not a true supercycle, but short-term volatility and sector-specific booms:
1. Slowing Global Growth
China’s economy is maturing, with slower GDP growth.
Europe faces stagnation, while the U.S. economy is service-driven, not commodity-intensive.
2. Technological Efficiency
Efficiency gains (recycling, renewable energy improvements, lightweight materials) reduce commodity intensity.
Example: Cars now use less steel and more composites.
3. Energy Transition Uncertainty
While green energy requires minerals, oil and gas demand may plateau or decline.
Fossil fuel exporters may face reduced long-term demand, offsetting gains in metals.
4. Cyclical, Not Structural
Commodity booms often follow crises (COVID-19 recovery, Ukraine war), but fade once supply adjusts.
For example, oil prices spiked in 2022 but moderated in 2023–2024.
5. Climate Change & Policies
Global push toward decarbonization may accelerate demand for some commodities but cap fossil fuel consumption.
Governments may regulate excessive commodity dependence, limiting supercycle momentum.
Case Studies of Recent Commodity Trends
Oil
Prices surged in 2022 after Russia’s invasion of Ukraine.
However, shale oil production in the U.S. capped long-term upward momentum.
The long-term outlook depends on balancing declining demand (EVs, green energy) with supply constraints.
Copper
Known as “Dr. Copper” for its link to global growth.
Critical for electrification, data centers, and EVs.
Supply shortages from South America and rising demand suggest potential supercycle conditions.
Agriculture
Climate change is disrupting yields of wheat, rice, and corn.
Rising populations in Africa and Asia sustain demand.
However, technological advances in agriculture (vertical farming, GM crops) could limit long-term price booms.
Lithium & Rare Earths
Prices skyrocketed due to EV adoption but are highly volatile.
Supply expansions in Australia, Chile, and Africa could stabilize markets.
Future Outlook: Are We Entering a Supercycle?
Short-Term (2025–2030)
Critical minerals like copper, lithium, and nickel likely face supply shortages, supporting higher prices.
Oil and gas remain volatile due to geopolitics but may not sustain a supercycle-level rise.
Agriculture could see climate-driven price spikes.
Medium-Term (2030–2040)
Green transition will be the dominant force.
Demand for EVs, renewable infrastructure, and digital economy will keep some metals in structural deficit.
Fossil fuels may decline, but not completely vanish.
Long-Term (2040 and Beyond)
Recycling, substitution technologies, and efficiency could limit extreme supercycle effects.
Commodity markets may fragment: metals could experience structural booms, while fossil fuels decline.
Conclusion
The concept of a global commodity supercycle is not a myth—it has occurred multiple times in history. However, whether the present situation qualifies as one depends on perspective:
Yes, it is real if we focus on critical minerals essential for the green energy transition. The supply-demand imbalance, underinvestment, and geopolitical tensions support the thesis.
No, it is a myth if we view commodities broadly, as oil, gas, and agricultural markets face demand plateaus, efficiency improvements, and technological disruption.
Ultimately, the truth may lie somewhere in between. Instead of a broad, all-encompassing commodity supercycle, we may be entering a “selective supercycle”—where specific commodities (like copper, lithium, cobalt, and rare earths) enjoy structural multi-decade booms, while others remain cyclical.

How Blockchain Could Create a Single Global Marketplace1. The Current Global Marketplace: Fragmented and Inefficient
Despite globalization, today’s international trade and commerce remain highly fragmented:
Multiple currencies → Every country has its own currency, requiring foreign exchange conversion, leading to costs, delays, and risks.
Intermediaries → Payment processors, banks, brokers, and logistics middlemen increase costs.
Trust issues → Buyers and sellers often don’t know each other, so they rely on third-party verification.
Inefficient supply chains → Tracking goods across borders is complex, slow, and prone to fraud.
Regulatory fragmentation → Every country enforces its own trade, tax, and compliance rules.
As a result, cross-border trade is expensive, slow, and sometimes inaccessible for small businesses or individuals. The dream of a truly globalized marketplace remains incomplete.
2. Blockchain’s Core Features and Why They Matter
Blockchain brings several unique features that directly solve the inefficiencies of global commerce:
Decentralization → No single authority controls the ledger, allowing peer-to-peer trade without middlemen.
Transparency → Transactions are visible and verifiable, reducing fraud.
Immutability → Once recorded, data cannot be tampered with, ensuring trust.
Smart contracts → Self-executing agreements automate business logic like payments or delivery confirmations.
Tokenization → Physical or digital assets can be represented as tokens, enabling easy trading.
Borderless payments → Cryptocurrencies and stablecoins allow instant cross-border value transfer.
Together, these features create the foundation for a single, borderless, digital-first marketplace.
3. Building Blocks of a Global Blockchain Marketplace
To understand how blockchain could unify the world economy, let’s break down the key pillars:
a) Universal Digital Currency
The first step is borderless payments. Cryptocurrencies like Bitcoin, Ethereum, and especially stablecoins pegged to fiat currencies already allow instant international transfers.
No need for currency exchange.
Settlement in seconds, not days.
Lower fees compared to SWIFT, Visa, or PayPal.
For example, a freelancer in India can receive payment from a U.S. client in USDT (a dollar-pegged stablecoin) instantly, bypassing banks and high remittance costs.
b) Tokenized Assets
Almost anything — from gold and real estate to art and stocks — can be represented as digital tokens on blockchain. Tokenization creates:
Fractional ownership → Anyone can buy a piece of expensive assets.
Liquidity → Assets can be traded globally without geographic restrictions.
Inclusivity → Small investors can access markets previously reserved for the wealthy.
This democratization of assets is crucial for a true global marketplace.
c) Smart Contracts for Automation
Smart contracts remove the need for trust between strangers. For example:
An exporter ships goods → smart contract releases payment automatically once delivery is confirmed.
A digital service provider delivers work → contract triggers instant payment.
This eliminates disputes, delays, and dependency on lawyers or courts.
d) Decentralized Marketplaces
Blockchain enables decentralized platforms where buyers and sellers connect directly. Examples include:
OpenBazaar (past experiment) → A peer-to-peer marketplace.
Uniswap & decentralized exchanges → Peer-to-peer asset trading.
NFT platforms → Direct artist-to-buyer transactions.
Such platforms reduce fees, censorship, and reliance on corporate intermediaries like Amazon or eBay.
4. Potential Benefits of a Single Global Blockchain Marketplace
1. Inclusivity and Financial Access
Currently, 1.4 billion people remain unbanked (World Bank data). Blockchain wallets give anyone with a smartphone access to global trade and finance.
2. Lower Costs
Cutting out intermediaries means cheaper remittances, payments, and trading. Cross-border remittance costs can drop from 7% to less than 1%.
3. Faster Transactions
International settlements that take days (via SWIFT) can be done in seconds.
4. Trust Without Middlemen
Blockchain’s transparency and immutability allow strangers across the globe to transact securely.
5. Global Liquidity and Market Access
Tokenization enables markets to operate 24/7, allowing capital and goods to move freely without geographic barriers.
6. Economic Empowerment
Small businesses, freelancers, and creators in emerging economies can access global customers directly, without dependence on banks or corporate platforms.
5. Real-World Use Cases
1. Cross-Border Payments
Companies like Ripple (XRP) and Stellar (XLM) are already enabling fast, cheap international transfers.
2. Supply Chain Management
IBM’s Food Trust blockchain allows tracking food from farm to supermarket, ensuring authenticity.
3. Decentralized Finance (DeFi)
Platforms like Aave or Compound let users lend/borrow globally without banks.
4. E-Commerce and Retail
Decentralized marketplaces allow direct buyer-seller trade. Imagine an Amazon alternative run on blockchain where sellers keep more profit.
5. NFTs and Creator Economy
Artists, musicians, and game developers can sell directly to global audiences using NFTs, bypassing labels or publishers.
6. Tokenized Real Estate
Platforms like Propy enable property sales on blockchain, making international real estate investments accessible.
6. The Role of Governments and Institutions
For a global blockchain marketplace to succeed, governments and institutions must play a role:
Global regulatory frameworks → To ensure safety while enabling innovation.
Central Bank Digital Currencies (CBDCs) → Countries like China, India, and the EU are developing CBDCs that could integrate with blockchain.
Public-private partnerships → Collaboration between regulators, banks, and blockchain firms to ensure trust.
Eventually, a hybrid system may emerge where CBDCs and decentralized platforms coexist, bridging traditional finance with blockchain.
7. Conclusion
Blockchain holds the potential to transform our fragmented, inefficient global economy into a single, unified marketplace where trade flows freely, securely, and inclusively. By combining borderless payments, tokenized assets, smart contracts, and decentralized platforms, blockchain eliminates the barriers of trust, geography, and cost.
Challenges remain — regulation, scalability, and adoption — but with growing institutional interest, technological improvements, and grassroots adoption, the path to a global blockchain-powered economy is clearer than ever.
The question is no longer “if”, but “when” blockchain will reshape the world economy. When that happens, trade will not just be global — it will be truly universal.
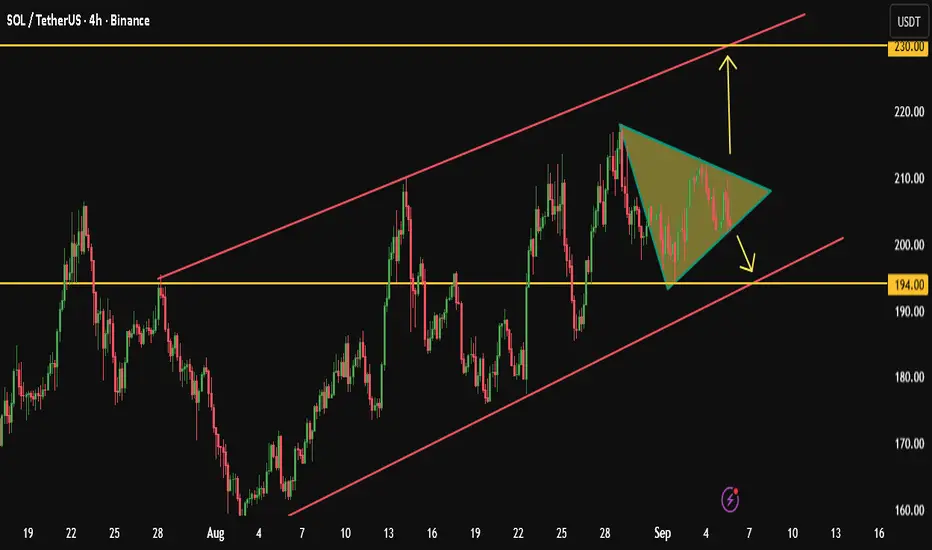
SOL inside ascending triangle,breakout will define the next moveCurrently, SOL price is consolidating within a symmetrical triangle pattern inside an ascending channel.
A breakout in either direction will determine the next move, towards 230 if it breaks upward, or towards 194 if it breaks downward.
As shown on the chart, Solana has been moving within an ascending channel since late July.
At the moment, a Symmetrical Triangle is forming, and volatility is tightening inside the pattern.
This suggests that a breakout move is imminent, most likely within the coming days (up to a week).
If price breaks to the upside:
potential move towards the upper boundary of the channel around 230.
If price breaks to the downside:
potential decline towards the lower boundary of the channel around 194.
Let’s watch closely for the breakout confirmation.
Best regards 🌹
please note :
this is not financial advice — it reflects only my personal opinion.
PLEASE always do your own research before trading .. Good luck with your trades.
Gold 1H Outlook | Key Levels to Watch – 3595 | 3625 | 3470OANDA:XAUUSD Gold is trading near 3594 after a strong bullish move. On the 1-hour chart, price has been following a rising trendline which shows that buyers are still active.
Here’s what matters for traders today:
🔹 Key Support Levels:
3560 → intraday support where buyers are stepping in.
3525 → major structural support + trendline confluence.
🔹 Resistance Zones:
3595 → first resistance, market is already reacting here.
3625 → next upside objective if buyers stay in control.
📌 Bias:
As long as price holds above 3525, gold remains bullish. Upside path: 3595 → 3625.
A confirmed break below 3525 would mean a shift in structure. In that case, sellers may push price towards 3470.

Strong base + steady trend = Buy City Union BankCity Union Bank (CUB) – 4H Chart Analysis
Polarity Zone: Stock holding well near 185–190 levels.
Pattern: Moving inside a short-term falling channel.
Support: Strong boundary support near 190.
Outlook: If this support zone sustains, we may see higher prices ahead in CUB.
Thank you.
