12 Laws of RSI: BTC Edition What if everything you’ve been told about “oversold” and “overbought” was statistically backwards? CRYPTO:BTCUSD
Most traders learn RSI as a simple reversal tool: buy when it’s oversold, sell when it’s overbought. But when you actually test RSI behavior across market structure, volatility conditions, volume environments, and forward‑return distributions, a very different picture emerges. The 12 Laws of RSI (BTC Edition) were created to correct the most common misunderstandings traders have about the Relative Strength Index. These laws rely on statistical findings (Due to be released soon) that summarizes the truth about the behavioral characteristics of how this indicator performs on bitcoin daily chart with a 10-day horizon. Instead of treating RSI as a simple “overbought/oversold” reversal tool, these laws reveal how RSI actually behaves in bull markets, bear markets, momentum phases, and periods of weakness. If you want to use RSI intelligently, these 12 laws are the foundation:
Law 1: RSI Is a Continuation Indicator in Bull Markets, not a Reversal Indicator.
• In bullish market structure (price > MA50 > MA200), treat RSI > 70 as a momentum confirmation, not a sell signal.
• When the market is going up, and RSI is high, do not bet against it, it means that the move is strong and its going to keep going for at least 5 days.
• If the market is strongly moving upward, and RSI is in a strong overbought position, that is an indication of double strength, not a warning sign.
Law 2: RSI < 30 is not a buy signal in bear markets.
• Do not aim for long setups with an RSI under 30 in downtrends, treat the oversold condition if the market is bearish as a sign of continuation in the negative direction.
Law 3: RSI > 70 Outperforms RSI < 30 Over 10 day horizons.
• RSI>70 can be used as a trend-strength filter for continuation setups
• This is the first place where RSI behavior produces a real, measurable statistically significant edge.
Law 4: RSI Behavior is Asymmetric, meaning Overbought does NOT equal oversold conditional wise.
• RSI > 70 has stronger, more consistent continuation in bull markets
• RSI < 30 has weaker, inconsistent bounces in bear markets
• This breaks the concept of the “buy when oversold” and “sell when overbought”
Law 5: Oversold means sellers are in control, not that a immediate reversal is incoming.
• Sellers have been beating up price for days
• This is NOT a buy signal
• RSI < 30 means the price is weak, not a discount alert.
Law 6: Oversold moves are very fast and hard, and are not statistically random.
• Bearish moves are very sharp and aggressive, and usually steep negative movements fall with force
• Sharp drops are going to often keep going rather before they stop
• Expect volatility and instability, not a clean bounce
Law 7: Oversold does not prove that positive returns are within a 10 day horizon.
This is because of how violent price can move in an oversold territory.
Law 8: Oversold price reversals are weak, inconsistent and mostly random.
• RSI values below 30 do not indicate a “bottom is in”
Law 9: Buying the “dip” just because the RSI indicator indicates a bottom is statistically a bad idea.
• Never assume that oversold means “Safe to buy”, you should like always, treat values below 30 as a signal to expect more moves to the downside.
Law 10: It’s not smart to pair volatility indicators to see if you can get a statistical edge with even the best oversold setups with the RSI.
• High volatility oversold, and low volatility oversold produce statistically indistinguishable forward returns, and volatility does not make RSI < 30 better or worse in any reliable way.
Law 11: Trend Indicators with low RSI filters do not offer a “fix”.
• Strong downtrends do not make RSI < 30 reversals any stronger
• All the “Oversold works best after a big dump” narratives fail statistically.
• Avoid rules like “buy RSI<30 after a 10 day crash”
Law 12: Prior uptrends do not offer an extra edge
• High RSI + Prior uptrends do not equal major bull runs are about to occur at all, that’s why you should use good risk management and position sizing, and only sacrifice what you can afford to lose
The 12 Laws of RSI make one thing clear: RSI is not a reversal tool, it is a context‑dependent continuation tool.
High RSI in bull markets signals strength, not danger.
Low RSI in bear markets signals weakness, not opportunity.
Oversold reversals are unreliable, inconsistent, and cannot be repaired with volatility indicators, trend indicators, or deep‑decline indicators.
The only meaningful edge comes from understanding RSI’s asymmetry: RSI > 70 has more continuation power than RSI < 30 has reversal power.
If you want to use RSI effectively, you must stop treating it as a bottom‑finder and start treating it as a market structure aware momentum gauge.
Legal Disclaimer
These laws summarize historical behavior and are provided for educational purposes only.
They do not constitute financial advice, trading recommendations, or predictions of future performance. Cryptocurrency markets are volatile and unpredictable; always use proper risk management and consult a qualified financial professional before making investment decisions.
Trading Plan

The Simplest Trading Strategy Nobody Talks AboutOpen charts. Open six timeframes. Start “analyzing.” and end up more confused than when you started. Daily, 4H, 1H, 15M, 5M, even M1… and somehow you still missed the real move?
Its because, you are looking everywhere and nowhere at the same time.
Problem is not having a simple repeatable plan, so you keep searching for certainty. And the more you search, the more anxious you get. Then you start trading feelings instead of data.
Here is a clean and simple framework which allows you check the charts once per day at 9:30 Same process. Same trigger. Same execution.And most importantly: if the market doesn’t do what we waiting for, you don’t trade. Period. No more stress guess work and wasted time on computer.
🧪 Daily Sweep (manipulation)
Levels to Watch - Daily highs / Lows
Execution Timeframe - M15 / M5 / M3
Confirmation: CIOD - M15 / M5
SL Placement: Above / Below manipulated H/L
Target: fixed 2R - No overthinking 2R and get out.
Instruments: NAS100, US500, US30, GER40
Trading time : 9 - 11 CET 💢 This structure removes all the subjective decisions we traders love to make:
No more “maybe it’ll reverse here.”
No more “I think it looks strong.”
No more hunting entries for hours.
🧪 The whole concept is built around three steps:
1. Direction (Daily Bias)
2. Manipulation (Liquidity)
3. Execution (Rule based + fixed target)
🧩 Step 1: Daily Bias
It's not just random buying and selling daily highs and lows. It has to go with the daily / weekly bias based on the liquidity. It's not dificult. Just look how Daily Candles are closing and follow it. I will explain it below.
⁉️Where is the liquidity ? Always follow the Daily / Weekly candle close.
📈 Continuation
If todays daily candle closed above previous days high and its still not reaching the key level, then liquidity is above todays high. Why ? Because people have intentions to sell highs to early, so and price will most likely go there. So we are bullish. Bullish Close 📈 Reversal
If todays candle wicked above previous day high, but closed below , then we can expect liquidity is below Previous days low. Why? Because mostl likely traders entered fake high break out they put SL below days low. It's signs of reversal. 📌Reversal Setup
first lets have a look to the reversal. We want see a candle high being taken and closed below. In that case draw on liquidity is below the daily low. Sign of reversal. So we can position ourselves in a trade as described on the picture, wick above and close inside is not enough for the signifcant HTF reversal. But its enough for our continuation setup,
📌Continuation setup
We want to see bullish candle close above previous days high and not liquidity taken above that wick. Then we can assume that liquidity is still resting above and we want to position ourselves during the LTF reversal in the direction of the HTF liquidity. 📌 Continuation LTF reversal timing
same case now you must already see it bullish close above PDH and that high was not swept so liquidity is still above , next day is inside candle once price dips below inside candle low we cans spot reversal setup on LTF and by creation of order block we enter the position during the NY session manipulation ‼️ Remember : You’re not predicting the future.
You’re following what the market already printed.
🧩 Step 2: Wait for the manipulation of Daily H/L and rejection(
This is where most traders mess up. No manipulation - No trade. We are focusing solely to the US session it comes usually at 9:30 US time. This is only time you are looking for the setups. This prevents you form sitting by charts whole day and give you a momentum to your trades during active hours of NY session.
In other words you want see manipulation of daily Highs. / Lows around 9:30 US time. Thats your strategy. ‼️ Important detail - CIOD: you wait for the close, If it hasn’t closed back inside the range and bellow consecutive up candles that created manipulation then it’s not confirmed.A wick alone is not enough.
I don’t care how “perfect” it looks mid-candle. I want the close.
❌ No sweep, no trade
This is the rule that saves you from overtrading. If price doesn’t raid the swing level and fail, you don’t have your setup. So you stay out.
🧩 Step 3: Drop to lower timeframe only AFTER confirmation
This part changed my execution.Before, I’d bounce between timeframes all day with no reason. I’d see something on 5M, panic, jump to 1M, enter like a maniac, get stopped, then watch it run.
🧪 CIOD - Change in Order flow - Order block
A down-close candle (before an impulsive move up) that acts as the “last sell” before
Or the opposite for shorts. 🛡️ Risk Management - This is key To keep it going long therm.
🧪 Max 2 attempts.
If trade 1 loses, trade 2 uses half risk.
🧪 Your max daily loss is -1.5R
Trade 1: -1R
Trade 2: -0.5R
🧪 Time is important
If you take these setups during dead hours, you’ll convince yourself the model “doesn’t work.” Time filters are part of the strategy, not an optional add-on. 🧪 Daily Processes
1. Mark swing highs and swing lows.
2. Decide your bias for tomorrow: mainly buys or mainly sells.
3. Wait for price to sweep a prior swing level.
4. Require the close back inside the range.
5. Only then go to 5M and execute using your entry model.
6. Fixed RR. Max 2 attempts. Done.
📒 You have a checklist.
And the market either gives it to you or it doesn’t. That’s the point.
Most traders fail because they treat trading like a constant activity.
This turns it into a conditional activity. 📉 Backtesting advice (so you actually trust it)
If you want this to become real for you, don’t just read it and feel motivated.
Go chart by chart and log:
- Market bias (based on swing points)
- Was there a sweep?
- Did it close back inside the range?
- What entry model did you use?
- RR result
- Time of day
💊 After 20–30 examples you’ll start seeing it everywhere.
💊After 100 examples you’ll stop hesitating.
🎯 When you stop hesitating, you stop improvising.
🎯 When you stop improvising, you stop donating money to the market.
I promised myself I’d become the person I once needed the most as a beginner. Below are links to a powerful lessons I shared on Tradingview. Hope it can help you avoid years of trial and error I went thru.
📊 Sharpen your trading Strategy
⚙️ 100% Mechanical System - Complete Strategy
🔁 Daily Bias – Continuation
🔄 Daily Bias – Reversal
🧱 Key Level – Order Block
📉 How to Buy Lows and Sell Highs
🎯 Dealing Range – Enter on pullbacks
💧 Liquidity – Basics to understand
🕒 Timeframe Alignments
🚫 Market Narratives – Avoid traps
🐢 Turtle Soup Master – High reward method
🧘 How to stop overcomplicating trading
🕰️ Day Trading Cheat Code – Sessions
🇬🇧 London Session Trading
🔍 SMT Divergence – Secret Smart Money signal
📐 Standard Deviations – Predict future targets
🎣 Stop Hunt Trading
💧 Liquidity Sweep Mastery
🔪 Asia Session Setups
📀 Gold Strategy
🧠 Level Up & Mindset
🛕 Monk Mode – Transition from 9–5 to full-time trading
⚠️ Trading Enemies – Habits that destroy success
🔄 Trader’s Routine – Build discipline daily
💪 Get Funded - $20 000 Monthly Plan
🧪 Winning Trading Plan
⭕ Backtesting vs Reality
🛡️ Risk Management
🏦 Risk Management for Prop Trading
📏 Risk in % or Fixed Position Size
🔐 Risk Per Trade – Keep consistency
🧪 Risk Reward vs Win Ratio
💎 Catch High Risk Reward Setups
☯️ Smart Money - Who control Markets
Adapt useful, Reject useless and add what is specifically yours.
David Perk 5.png

Why You Keep Losing Money in the Financial MarketsWhy You Keep Losing Money in the Financial Markets 💸
━━━━━━━━━━━━━━━━━━━━━━━━━━━━━━━━━━━━━━━━━━━━
One of the main reasons you keep losing money in the financial markets is that this activity is directly associated with turning money into more money.
This blurs the understanding of the value of skill. In any field, the most important thing is skill, while money is merely the reward for the level of that skill.
A simple example.
A person makes chairs. At the beginning of their journey, the chairs are rough and not very attractive — because they are still developing. But as their mastery grows, the quality of the chairs improves, and with it, their price.
The better they do their job, the more they earn.
When people come to the financial markets, they see someone turning $1,000 into $100,000, or someone else turning $50,000 into $250,000 in a single day. This creates the illusion that this is how it will work for everyone.
It’s important to understand:
Financial markets are not a wish-granting machine. They are a zero-sum game.
If someone makes money, someone else must lose. There is no winner without a loser. That’s how the system works.
━━━━━━━━━━━━━━━━━━━━━━
The Path of a Beginner Trader 🧠
Let’s return to the person who has just entered the market and started their journey.
All experienced traders have gone through the stage where, at first, something seems to work — but eventually the entire deposit (or most of it) gets wiped out.
And at that moment, a choice appears:
Either I quit,
or I continue.
Those who choose to continue are strong people.
But it’s crucial not to fall into madness. You cannot keep doing the same things that already led you to losing your deposit. You must change — both internally and in your strategy.
━━━━━━━━━━━━━━━━━━━━━━━━━━━━━━━━━━━━━━━━━━━━
The Main Reasons for Losses ⚠️
1. Chaos
Chaos in trades.
Chaos in thoughts.
Chaos in the market.
First of all, you need to:
calm down,
take a breath,
structure what you already know,
write it down,
start testing your strategy.
Only this way can you remove chaos from your mind and move away from random, impulsive trades.
━━━━━━━━━━━━━━━━━━━━━━━━━━━━━━━━━━━━━━━━━━━━
2. Emotions and Impulsivity
Impulsive decisions look like this:
A person sees the last candle going up and enters a long.
The price then reverses and goes down.
And on the higher timeframe, the market is actually in a downtrend.
A person opens a new instrument they have never traded before.
They see a setup similar to another asset and enter without understanding the instrument’s specifics.
After losing part of the deposit, instead of taking a pause, the trader tries to “win back” the loss.
All decisions become emotional — and as a result, even more money is lost.
The most important tool against impulsivity is a pause.
Step away from the chart.
Stop talking about the market.
Switch to something that calms you down.
For me, for example, it’s feeding stray animals — it genuinely brings me back into balance. 🐾
━━━━━━━━━━━━━━━━━━━━━━━━━━━━━━━━━━━━━━━━━━━━
3. Opening the Chart Not to Analyze, but to Trade
A very common problem:
A trader opens the chart not to analyze, but with an already (subconsciously) made decision to enter a trade.
They convince themselves:
“I’ll just look at the market, analyze the phase, find a setup…”
But in reality, the decision to trade has already been made, and the analysis is only used as justification.
Here it’s important to learn to observe your own thoughts and honestly answer yourself:
Am I analyzing the market right now — or am I looking for an excuse to enter?
━━━━━━━━━━━━━━━━━━━━━━━━━━━━━━━━━━━━━━━━━━━━
4. Trading as Emotional Compensation
For a beginner trader, an open trade becomes an emotional game:
Price goes against them → anxiety, fear, stress
Price goes in their favor → euphoria, joy, excitement
Over time, this can turn into a way of escaping reality:
a person experiences negative emotions in life and, instead of solving the problem, goes to the market to get emotions through trading.
This is where signs of gambling addiction begin to appear.
And it’s extremely important not to let yourself reach that state.
━━━━━━━━━━━━━━━━━━━━━━━━━━━━━━━━━━━━━━━━━━━━
5. Lack of Self-Trust
This shows up when people:
subscribe to signal groups,
copy other people’s trades,
fully rely on opinions from chats.
Here you need to ask yourself an honest question:
Why do you think you are worse?
Why have you decided that you won’t succeed?
This is work with fear and self-esteem.
You can only learn to trust yourself when:
you have structured your approach
tested it through backtesting,
seen consistency,
and only then brought it into live trading.
These are the main reasons that prevent traders from becoming profitable.
━━━━━━━━━━━━━━━━━━━━━━━━━━━━━━━━━━━━━━━━━━━━
Write in the comments 💬
What exactly held you back when you were a beginner trader?
Perhaps your experience will help a newcomer find the answer in your words.
Also, if you’re facing any issues that are holding you back from trading, don’t hesitate to share them in the comments — we’ll help you.
Enjoy!

Why Most Traders Spiral After a Loss And How Professionals Don'tRevenge trading is one of the fastest ways to erase progress and it rarely has anything to do with strategy. This three part series breaks down the discipline systems profitable traders use after a loss to protect capital focus and emotional control.
We walk through how to pre define losses so they do not trigger impulsive behavior why time based resets matter more than jumping back into the market and how focusing on a single pair like GBPUSD reduces emotional noise and prevents overtrading.
These lessons are practical repeatable and built for traders who already understand the basics but want to trade with consistency under pressure. This is about controlling decisions after the loss not avoiding losses altogether.
If you are serious about eliminating revenge trading and building long term discipline this series will change how you respond when trades do not work.
For educational purposes only not financial advice

Stop Revenge Trading The Discipline Strategy Profitable Traders Revenge trading is one of the fastest ways to erase progress and it rarely has anything to do with strategy. This three part series breaks down the discipline systems profitable traders use after a loss to protect capital focus and emotional control.
We walk through how to pre define losses so they do not trigger impulsive behavior why time based resets matter more than jumping back into the market and how focusing on a single pair like GBPUSD reduces emotional noise and prevents overtrading.
These lessons are practical repeatable and built for traders who already understand the basics but want to trade with consistency under pressure. This is about controlling decisions after the loss not avoiding losses altogether.
If you are serious about eliminating revenge trading and building long term discipline this series will change how you respond when trades do not work.
For educational purposes only not financial advice

What a Trading Day Actually Looks Like (No Clickbait)This idea breaks down a real trading day from start to finish without highlights or hype. No constant chart watching and no overtrading just structure and intention.
We walk through how the day is organized including when the charts are reviewed how planning is done before price moves and why most of the day is intentionally quiet. This includes non trading routines like meditation gym time and stepping away from the screen so decisions are not made from fatigue or impulse.
The focus is on building consistency through rhythm not intensity. Trading is treated like a professional practice not an all day reaction to every candle.
Key takeaway
If your day has no structure your trading will not either. Discipline outside the charts creates clarity on the charts.
For educational purposes only not financial advice

How to build a resilient mindset and stop losing moneyHow to Build a Resilient Mindset and Stop Losing Money Because of Yourself
Trading is commonly described through strategies, indicators, market models, and macroeconomics. In practice, however, the decisive factor is not analysis, but a person’s ability to act consistently under conditions of uncertainty.
The market does not follow the logic of an individual trader. It is not required to be fair, consistent, or understandable. The only things truly under a trader’s control are their decisions, reactions, and behavior. This is why psychology in trading is not an “additional skill.” It is the foundation.
Why Trading Breaks the Psyche More Than Other Professions
Trading combines several factors that rarely occur together in ordinary work:
1. Direct Connection Between Decisions and Money
Every action is immediately converted into profit or loss. For the brain, money is equivalent to safety, which is why any fluctuation in the account balance is perceived as a threat.
2. Lack of Predictable Outcomes
Even a perfect decision can result in a loss. This destroys the familiar mental model: “If I did everything right, I should be rewarded.”
3. Absence of External Structure
There is no boss, no fixed working hours, no external performance evaluation. The trader is their own regulator.
4. Random Reinforcement
Sometimes rule-breaking leads to profit, while discipline leads to losses. This creates dangerous behavioral distortions.
As a result, trading becomes an environment where the following are activated:
anxiety
impulsivity
perfectionism
the desire for control
fear of missing out
Without conscious psychological work, these factors gradually destroy even a good strategy.
Key Thinking – Error of Most Traders
The most common psychological error in trading is not fear, greed, or lack of discipline.
It is a false cognitive expectation:
“If I analyze well and follow the rules, I should be right.”
This expectation is deeply rooted in how people are conditioned outside of markets. In school, work, and most professions, correct actions are consistently rewarded. Trading violates this model entirely.
The market operates as a probabilistic system, not a deterministic one.
This means that:
Correct decisions can produce negative outcomes
Incorrect decisions can be rewarded
Individual outcomes contain no reliable information about skill
Most traders intellectually understand this, but psychologically they still evaluate themselves trade by trade. This creates constant internal conflict.
The Correct Mental Shift
A trader does not make money on an individual trade.
A trader makes money on a series of trades executed according to the same process.
When a trader becomes emotionally attached to a single trade, that trade stops being a probabilistic event and turns into a psychological one. The outcome begins to matter more than the quality of execution, and decisions are no longer guided by rules, but by emotional reactions to uncertainty.
As price approaches a stop loss, emotional discomfort increases. To avoid the feeling of being wrong, the trader moves the stop, transforming a defined risk into an undefined one. When a position shows a small profit, fear of losing it leads to premature exits, reducing the average win and damaging expectancy.
After losses, emotional pressure builds. The trader may average into losing positions or increase risk in an attempt to restore emotional balance and regain a sense of control. In other cases, losses create hesitation, causing valid signals to be skipped. As a result, losses are fully realized while winners are partially or completely missed.
Only when individual trades lose emotional significance can probability work as intended. Profit and loss become properties of the series, not of a single decision. At this point, the trader stops trying to be right and starts executing a process consistently.
Accepting Losses as the Foundation of Psychological Stability
Accepting losses is not an intellectual concept but an emotional agreement with the inevitability of loss. Many traders believe they have accepted losses because they understand that losses are part of trading. However, their behavior reveals the opposite. After a stop-out they feel anger, attempt to recover the loss immediately, change strategies after a small series of losing trades, or experience a sharp drop in self-confidence. These reactions indicate that losses are still perceived as personal failure rather than as a normal component of a probabilistic process
Practice: Pre-Agreement With Losses
Before the trading week begins, write down:
acceptable weekly drawdown
maximum number of consecutive losing trades
conditions under which trading must stop
If a loss produces a strong emotional reaction, it is a clear signal that the risk was psychologically excessive, even if it was technically correct according to the rules. Psychological stability is not achieved by avoiding losses, but by ensuring that losses remain within limits the trader can emotionally tolerate without altering behavior.
Trading Plan as a Tool for Psychological Stabilization
A trading plan is often perceived as a technical document focused on entries and exits. In reality, its primary function is to reduce cognitive and emotional load. By limiting the number of decisions that must be made in real time, a plan removes the need for constant judgment and interpretation under pressure.
A well-constructed plan minimizes improvisation, lowers anxiety, and protects the trader from impulsive entries driven by emotion rather than logic. It creates a stable framework in which decisions are made in advance, when emotional arousal is low.
From a psychological perspective, a trading plan must clearly define when trading is prohibited, set maximum risk limits per day and per week, enforce mandatory pauses after losing streaks as well as after unusually large profits, and limit the number of trades that can be taken. These constraints are not restrictions on performance, but safeguards for mental stability.
If a plan cannot be followed during periods of emotional stress, it is not a functional plan. A valid trading plan must be designed to operate not only in optimal mental conditions, but also when discipline is most vulnerable.
Trading Journal as a Mirror of Behavior
Without a journal, a trader’s memory becomes selective. Dramatic losses, random successes, and emotionally intense moments dominate recollection, while the majority of trades fade from awareness. This creates a distorted perception of performance and reinforces false conclusions about skill and strategy.
An effective trading journal does not primarily track the market; it tracks the trader. After each trade, recording the emotional state before entry, the level of confidence, the presence of doubt, any urge to break rules, and the emotional state after exit reveals information that price data alone cannot provide.
After twenty to thirty trades, recurring behavioral patterns begin to emerge. Trades taken out of boredom, increased risk following profits, hesitation or avoidance after losses, and premature exits become visible as consistent tendencies rather than isolated mistakes. At this stage, the journal stops being a record of trades and becomes a diagnostic tool.
Working with a journal is not about refining the strategy. It is about understanding and correcting the trader’s own behavior.
Fear of Missing Out (FOMO)
FOMO is one of the most destructive psychological forces in trading. It does not arise from greed, but from the fear of being excluded from a move, the perception that others are profiting while one is not, and the constant pressure created by social media and shared results. These factors distort judgment and create urgency where none objectively exists.
Effective protection against FOMO must be structural, not emotional. The trading plan should strictly limit entries to pre-defined scenarios and explicitly prohibit participation in impulsive moves that lack proper pullbacks or confirmation. These rules remove discretion at moments of emotional vulnerability.
Most importantly, the trader must accept a fundamental reality of markets: they are not designed to allow participation in every move. Their purpose is to offer choices. Sustainable performance comes not from chasing activity, but from disciplined selection.
Emotional Neutrality: Reality and Myths
Complete emotional neutrality is impossible. Emotions are a natural response to uncertainty and risk. The objective of a professional trader is not to eliminate emotions, but to prevent emotions from influencing decisions.
This requires continuous awareness of one’s internal state, the ability to step away at the right moment, and the discipline to avoid decision-making during emotional extremes. Trades taken under heightened emotional arousal are rarely aligned with a structured process.
For this reason, planned pauses are a critical component of psychological stability.
Pause Practice
After a significant profit, a series of losses, or a strong emotional reaction, trading must stop for a predefined period of time. This practice is not a sign of weakness. It is a form of capital protection that preserves both financial and psychological resources.
Fatigue, Burnout, and Hidden Forms of Self-Sabotage
Burnout in trading rarely presents itself as apathy or disengagement. More often, it manifests as increased trading frequency, irritation toward the market, rising position sizes, declining discipline, and a persistent sense of internal pressure. These behaviors are commonly mistaken for motivation or determination, when in fact they signal nervous system overload.
Trading demands sustained concentration and emotional regulation. Continuous exposure to the market without structured recovery gradually exhausts cognitive resources, making disciplined execution increasingly difficult.
Structuring Practice
To prevent this form of self-sabotage, trading must be deliberately structured. Trading must be divided into:
trading days
analysis days
days completely away from the market
Rest is not a reward for profitability; it is an essential component of a sustainable trading process.
The Most Difficult Skill for a Trader
The most difficult skill in trading is the ability to do nothing when conditions are not met. The absence of a trade is not a missed opportunity, but an expression of discipline and adherence to the plan.
To reinforce this behavior, days without trades should be recorded as completed work. Performance must be evaluated by the quality of process execution rather than by short-term profit and loss. This reframes inactivity as a valid and productive outcome.
Sustainable trading is not built on finding perfect entries. It is built on accepting uncertainty, limiting risk, executing a repeatable process with consistency, maintaining discipline, and working continuously with one’s own psychology.
Trading is not a fight with the market. It is a systematic practice of managing how an individual responds to uncertainty, risk, and expectations.
Enjoy!

GBPUSD: Fighting the Urge to Interfere with Good TradesLet’s talk about something nobody warns you about when you start trading seriously: trade fatigue.
Right now, GBPUSD hasn’t closed above our stop loss. Technically, the trade is still valid. But price has reversed back into what I call the red zone—that area where nothing productive happens, but everything emotional does.
This is where most traders lose—not on the chart, but in their head.
You start staring at every candle. You refresh the chart like it owes you an explanation. You feel tired, impatient, and strangely irritated. That’s trade fatigue. And it’s dangerous because it makes you want to do something just to feel relief.
Here’s the practical shift:
If price hasn’t invalidated your plan, your job is not to manage the trade—it’s to manage yourself.
This is where alerts save traders. Set an alert at your stop. Set one at your next decision level. Then walk away. Fatigue comes from overexposure, not from drawdown itself.
GBPUSD sitting in the red zone isn’t a problem. You being glued to it is.
CTA: If you’ve ever closed a good trade early just because you were tired of watching it, drop “fatigue” in the comments. I want you to see how common this really is.

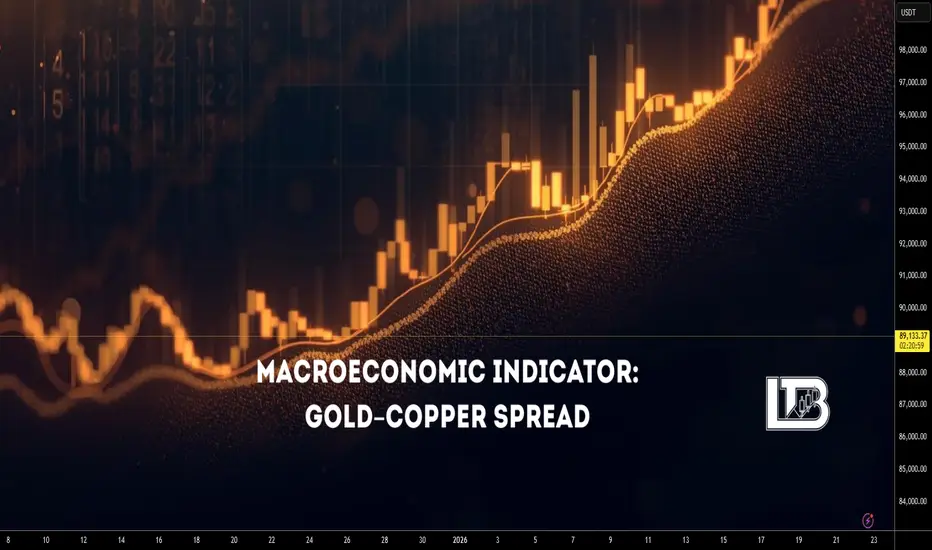
Macroeconomic Indicator: Gold-Copper SpreadMacroeconomic Indicator: Gold-to-Copper Spread
The Gold-to-Copper Spread (Gold-to-Copper Ratio) is the ratio between the price of gold and the price of copper, expressed by the formula:
Gold–Copper Ratio = Price of Gold / Price of Copper
This indicator shows how much the price of gold exceeds or lags behind the price of copper at a given point in time. It is often used to analyze market sentiment, assess economic stability, and identify investor preferences.
Gold
Gold is traditionally considered a safe-haven asset. Its price generally rises during periods of economic and financial uncertainty, when investors seek to preserve capital and reduce risk.
Additionally, gold may receive support in the following conditions:
weakening of the US dollar
rising inflation expectations
declining real interest rates
increasing geopolitical risks
growing demand from central banks
Copper
Copper is often called “the doctor of the economy” due to its high sensitivity to industrial production and economic growth. The price of copper typically rises during phases of economic expansion, when demand for commodities and risk assets increases.
The spread reflects only the relationship between the two assets and does not account for other factors such as exchange rates, geopolitics, or changes in monetary policy.
Copper may also rise under the following conditions:
supply deficits (strikes, logistical disruptions, declining production)
structural growth in demand (electric vehicles, energy transition, data centers)
monetary stimulus and growth in global liquidity
weakening of the US dollar
speculative phases in commodity markets
stimulus measures from China
Rising Gold/Copper Ratio
Typically signals:
increase in risk-off sentiment
deterioration in economic expectations
growing demand for safe-haven assets
expectations of recession or slowdown
intensification of geopolitical risks
decline in real interest rates
This is usually accompanied by weakness in equity markets, cyclical sectors, and industrial commodities.
Falling Gold/Copper Ratio
Typically indicates:
strengthening of risk-on sentiment
improving expectations for economic growth
growth in industrial activity
capital inflows into risk assets
the beginning or middle of an economic expansion
It often correlates with rising equity indices, industrial metals (in a “healthy” risk-on regime, copper should rise not alone but together with aluminum, nickel, and zinc), oil, industrial ETFs (XLI), equity indices, PMI, macro data, and bond yields.
The Spread Cannot Be Analyzed in Isolation
Key indicators without which this indicator should not be interpreted:
Real rates
DXY (US dollar)
S&P 500, Russell 2000, Industrial ETF (XLI), oil (WTI, Brent), aluminum, zinc, nickel, CRB Index / GSCI
China: real demand or illusion — declining or growing
Geopolitics
All these metrics can be found on TradingView. It is recommended to create a separate watchlist and monitor them there.
The Spread Is Falling
This means copper is stronger than gold. The base hypothesis is that the market is shifting into risk-on mode. We then verify this using other indicators.
1. Real Rates
Real rates are rising - gold is under pressure, the spread falls for a “healthy” reason.
This confirms that the market truly expects economic growth.
Real rates are falling, but the spread is still falling - copper is rising too aggressively.
This is not a macro growth signal, but rather a sign of copper supply deficit or speculative acceleration.
Conclusion:
If the spread falls while real yields are rising, this is a strong, clean risk-on signal.
If it falls while real yields are declining, distortions are already present.
2. DXY (US Dollar)
DXY is falling - supportive for commodities, copper’s strength looks logical.
This confirms a risk-on environment.
DXY is rising, but the spread is still falling - copper is rising despite currency pressure.
This is often a sign of a local copper deficit or an artificial squeeze.
Conclusion:
A falling spread with a weak dollar is a normal macro scenario.
A falling spread with a strong dollar is a reason to be cautious.
3. What Should Happen in Other Markets
If the decline in the spread reflects true risk-on, typically:
S&P 500 is rising
Russell 2000 is rising faster than S&P (increased risk appetite)
Industrial ETF (XLI) is in an uptrend
Oil (WTI, Brent) is strengthening
Aluminum, zinc, and nickel are rising together with copper
CRB / GSCI commodity indices are moving higher
Key point:
Copper should not rise alone. If you see copper rising, equities flat, oil weak, metals not confirming then this is almost always mean that not macro growth, but a local copper story (supply shock, squeeze, speculation).
4. China: Real Demand or Illusion
Copper is almost impossible to interpret without China.
China PMI rising + credit impulse rising + yuan strengthening
copper growth is fundamentally confirmed
a falling spread = healthy risk-on
China PMI falling + weak economy, but copper rising
this is not macro demand
it is either a supply deficit or speculative flows
Conclusion:
If China does not confirm copper’s move, the decline in the spread loses its macro meaning.
The Spread Is Rising
This means gold is stronger than copper. The base hypothesis is that the market is moving into defense (risk-off). But confirmation is still required.
1. Real Rates
Real rates are falling - gold rising is logical.
If equities and commodities weaken at the same time, this is true risk-off.
Real rates are rising, but gold is still rising - the driver is not monetary.
This is usually geopolitics or fear of systemic risks.
Conclusion:
Rising spread with falling real yields = classic macro risk-off.
Rising spread with rising real yields = the market is genuinely afraid.
2. DXY (US Dollar)
DXY is rising - pressure on commodities, support for gold - the rising spread looks logical.
DXY is falling, but the spread is still rising - gold is rising too strongly.
This is most often a sign of fear, geopolitics, or systemic hedging.
Conclusion:
Rising spread with a strong dollar = standard risk-off.
Rising spread with a weak dollar = a warning signal.
3. What Should Happen in Other Markets
If the rise in the spread reflects true risk-off, typically:
S&P 500 weakens or moves into correction
Russell 2000 falls faster than S&P
XLI (industrial sector) is under pressure
Oil weakens
Industrial metals fall
CRB / GSCI move lower
If instead gold is rising, equities are rising, oil is holding, commodities are not falling, then this is not classic risk-off. It means gold is rising for its own reasons (rates, geopolitics, hedging).
4. China (PMI)
Chinese data weakening + copper falling
the rise in the spread is fundamentally confirmed
the market truly expects a slowdown
Chinese data strong, but copper still weak
the issue is not demand, but other markets
the spread signal is distorted
Geopolitics in the Interpretation of the Gold/Copper Ratio and Markets
Geopolitics is a factor that breaks the normal macro logic of markets.
It is not directly linked to the economic cycle, but it sharply changes capital behavior.
If macro indicators reflect “slow” processes (rates, growth, inflation),
then geopolitics represents shock events that trigger fear, defensive positioning, risk aversion, increased demand for liquidity
That is why it is always considered separately from macroeconomics.
How Geopolitics Affects the Gold/Copper Spread
In most cases, geopolitics, strengthens demand for gold, weakly supports copper, therefore pushes the spread higher
But the key point is:
this is not because the economy is deteriorating,
but because investors are hedging against event risk.
That is why a geopolitically driven rise in the spread often is not confirmed by falling equities, is not accompanied by worsening PMI, does not coincide with changes in interest rates
Enjoy!
“I Was Right” in Trading Has Two Parts, Ego Only Understands OneI’ve written before about the ego trap in trading — how many traders care more about being right than being profitable.
But today, let’s be brutally honest.
Most traders don’t lose money because they lack knowledge.
They lose because they’re addicted to one sentence: “I was right.”
Not “I executed well.”
Not “I managed risk.”
Not “I took profit like a professional.”
Just: “I was right.”
And the most dangerous part is this:
They can lose money…
and still feel successful…
because the chart eventually moved in the direction they predicted.
But trading is not a debate.
Trading is not a prediction contest.
Trading is not an ego competition.
Trading is a performance business.
And if you want brutal clarity, here it is:
✅ “I was right” has TWO components.
And if you only have one of them… you were not right.
The “I Was Right” addiction (and why it destroys traders)
- Being “right” feels good.
- It feeds the ego.
- It gives you the illusion of control.
- It makes you feel smarter than the market.
That’s why traders love saying things like:
- “I called it!”
- “I told you!”
- “Look at price now!”
- “My target got hit!”
But markets don’t reward ego.
Markets reward survival + execution.
So let’s define what “I was right” actually means.
Component #1: The market must move the way you said it would (in the correct order)
This is the part most traders misunderstand.
Because they think being right means: “My target was hit.”
But that’s not what being right means in trading.
Real example (Gold Monday)
Let’s say your Monday analysis looked like this:
“Gold will fill the weekend gap first, and then it will rally to 4850.”
Clean plan.
Clean logic.
Two-step scenario.
Now imagine what actually happens:
- The gap never gets filled
- Price rallies directly
- Gold reaches 4850
And suddenly, people say:
✅ “See? I was right!”
No! You weren’t!
If the entry never happened, you weren’t right
Let’s be brutally clear:
If your plan was gap fill first, and the gap was never filled… then your analysis was wrong.
Even if gold went up.
Even if it went to your target.
Because trading is not about what eventually happens.
Trading is about the path you traded.
Your scenario had a sequence:
- Gap fill
- Rally to 4850
If step 1 fails, the trade idea fails.
The market didn’t follow your plan.
It only coincidentally touched your number.
And coincidence is not skill.
Why this matters (the arguments ego traders hate)
1) A target being hit is meaningless if no trade was triggered
A trade is not a prediction.
A trade is a sequence:
s etup → trigger → entry → execution → exit
If your entry condition never happened, your trade never existed in real life.
So price reaching 4850 doesn’t prove you were right.
It proves only one thing:
Price can hit levels without respecting your logic.
2) You can’t claim correctness without the entry
This is where ego starts cheating.
Instead of saying: “My entry condition failed.”
Ego traders say: “The target was hit, so I was right.”
That’s not analysis.
That’s self-defense.
A forecast without an executable entry is not a trade plan.
It’s a story.
3) If the order of events is wrong, the thesis is wrong
When you say “gap fill first,” you’re implying structure:
- price must retrace
- liquidity must be taken
- imbalance must be resolved
- the market should behave in a specific way
If that doesn’t happen… your read was incorrect.
Price hitting your final level doesn’t fix your thesis.
It only hides the mistake.
4 ) The worst part: it creates fake confidence
And fake confidence is lethal.
Because next time, the trader starts thinking:
“Even if my entry doesn’t happen, my targets are still correct.”
So they begin to:
- chase price
- force entries
- ignore invalidation
- move stops
- overleverage
And that’s how the “I was right” mindset quietly becomes account suicide.
Component #2: Your trade must survive the move (otherwise you were never right)
Now we reach the part that destroys accounts.
Because trading is not forecasting.
- It’s not “October target ideas.”
- It’s not being a chart prophet.
Trading is execution under risk.
And here’s the truth:
✅ The market can move in your direction
❌ and you can still be completely wrong
How?
Because if you didn’t manage risk properly… the market can wipe you out before it proves your target “right.”
Real example: “Gold will reach 4850 said on October” (and you still weren’t right)
Let’s use a real situation.
Imagine it’s October.
Gold is trading around 4300.
And you post confidently:
“Gold will go to 4850.”
Eventually, gold does reach 4850.
And you instantly say:
✅ “I was right!”
But here’s what you ignore — the part that matters:
Before reaching 4850, gold dropped nearly 5000 pips in 6 days
Now let’s speak like adults.
If price moved against you almost 5000 pips in a week… and you were trading margin (not holding physical gold long-term)… then you did “experience volatility.”
Also you experienced something far worse:
✅ you got margin called
✅ you got liquidated
✅ you lost the account
So no — you were not right.
Even if the chart later touched your magical number.
Because trading is not a screenshot.
It’s survival.
The question professionals ask (and ego traders avoid)
When someone says: “Gold will reach 4850”
A professional doesn’t say: “Wow, what a target!”
A professional asks:
- Where is the entry?
- Where is the invalidation?
- Where is the stop loss?
- What’s the position size?
- What’s the maximum tolerated drawdown?
- Can the account survive the path?
Because if you didn’t define the risk… you didn’t make a trading plan.
You made a wish.
And wishes don’t protect accounts.
The difference between analysts and traders
This is where many people get confused.
Analysts want to be correct.
Traders want to get paid.
And you can’t get paid if you treat risk as an optional detail.
That’s why so many people win debates and lose money.
They keep saying:
- “I called it”
- “I was right”
- “check the chart now”
But their account is dead.
And the market does not pay for predictions.
It pays for execution.
The ego trap: “being right” becomes more important than making money
This is the psychological disease behind most retail trading failure.
The ego loves being right because it protects identity.
It allows you to lose money while still feeling smart.
It turns trading into an emotional game where the goal is not profit…
The goal is not being wrong.
But the market doesn’t care about your ego.
There are no grades for “good idea.”
There is no prize for “almost correct.”
There is no trophy for “eventually it happened.”
Only one thing matters:
✅ Did you make money with controlled risk?
If not…
you weren’t right.
The ONLY rule: Right means right in execution, not right in theory
Here’s the rule that destroys the “I was right” addiction:
A prediction is not correctness.
Correctness is profitability with survival.
So yes — “I was right” has two parts:
1) The market moved exactly as expected (including the sequence)
and…
2) Your execution survived the path
Miss either one?
You weren’t right.
You were lucky.
Or reckless.
Or both.
Final message: Stop trying to be right — start trying to be profitable
You don’t need to win against the market or arguments with others.
You need to work with the market.
You don’t need perfect forecasts.
You need:
- clear invalidation levels
- realistic timing
- risk control
- the ability to survive
Because a trader who survives can always come back.
But a trader who blows up while being “right”… will never trade the next opportunity.
And that is the most expensive form of correctness.
The market doesn’t reward conviction and hypothetical targets reached
It rewards execution.
Best Regards!
Mihai Iacob

Psychology: Mindfulness in Trading: Your Mind = Your AllyUnlock the secrets to mastering GBPUSD in this three-part series designed for traders ready to level up. Learn how to fight impulsive trading urges, embrace mindfulness to stay calm under pressure, and gain full control by focusing on a single pair. Each video is packed with practical insights, real examples, and actionable strategies you can apply immediately to your TradingView charts.
Discover how to:
Recognize and control trading impulses for better decision-making.
Use mindfulness and alerts to manage drawdowns and avoid stress.
Track GBPUSD like a pro, from lot sizes to price behavior, and build confidence in every trade.
Whether you’re coming back to trading or leveling up your consistency, this series gives you the tools to trade smarter, not harder.
CTA: Watch all three videos, apply the strategies to your charts, and comment below with your biggest takeaway—I’ll respond with tips to help you master your trades even faster.

EDUCATION: Mastering One Pair – Why Less Is More in ForexUnlock the secrets to mastering GBPUSD in this three-part series designed for traders ready to level up. Learn how to fight impulsive trading urges, embrace mindfulness to stay calm under pressure, and gain full control by focusing on a single pair. Each video is packed with practical insights, real examples, and actionable strategies you can apply immediately to your TradingView charts.
Discover how to:
Recognize and control trading impulses for better decision-making.
Use mindfulness and alerts to manage drawdowns and avoid stress.
Track GBPUSD like a pro, from lot sizes to price behavior, and build confidence in every trade.
Whether you’re coming back to trading or leveling up your consistency, this series gives you the tools to trade smarter, not harder.
CTA: Watch all three videos, apply the strategies to your charts, and comment below with your biggest takeaway—I’ll respond with tips to help you master your trades even faster.

PCE — What the market will see on Thursday (22 January 2026)Introduction
On Thursday, January 22, the Core Personal Consumption Expenditures (PCE) Price Index will be released in the United States. Ahead of the release, we decided to take a deeper dive into macroeconomic theory and revisit what PCE is and how its data influence financial markets.
The PCE (Personal Consumption Expenditures) Price Index is a comprehensive measure of inflation that tracks changes in prices for all goods and services consumed by households within the country, regardless of the source of funding. Its conceptual depth lies in the fact that it reflects the actual cost of consumption across the economy, not merely the out-of-pocket expenses of individual consumers.
The Federal Reserve views PCE as its primary gauge of inflationary pressure due to its deeper analytical structure and methodology, which is largely free from certain statistical distortions and explicitly accounts for behavioral aspects of consumer choice.
CPI vs. PCE
While CPI answers the question:
How much more expensive has life become for the average urban consumer?
PCE addresses a broader one:
How much more expensive has total final consumption in the economy become?
This makes PCE more macroeconomically representative. It includes not only household spending, but also expenditures by non-profit institutions serving households.
The core methodological difference between the two indices lies in how they treat consumer behavior.
CPI assumes relative rigidity in consumption habits:
its basket is updated with a lag
its calculation implies that households continue purchasing the same goods even as prices rise, simply paying the higher cost
PCE, by contrast, incorporates rational behavioral flexibility. The Fisher chain-weighted index used in its calculation reweights components on a quarterly basis, reflecting the natural shift in demand toward relatively more affordable substitutes. This substitution effect not only reduces the indicator’s volatility, but also aligns it more closely with real-world consumer spending dynamics, where price changes are a key driver of budget reallocation.
An important clarification regarding the relationship between CPI and PCE:
the two indicators are highly correlated
PCE typically prints slightly lower readings than CPI
this persistent gap is a structural result of methodological differences in how the indices are constructed
What to Focus on in the Release
When CPI data are released, the most reliable way to assess underlying inflation pressure is to focus on Core CPI.
The same logic applies to PCE.
The headline figure (Headline PCE) carries a significant risk of misinterpretation due to its elevated volatility, which can distort the perception of the underlying price trend. Core PCE, stripped of these destabilizing components, serves as a far more reliable compass, pointing to the deeper inflationary forces in the economy — precisely the forces that shape the long-term path of monetary policy.
With this framework in mind, we can move on to a more precise interpretation of the data.
When the report is released, greater emphasis should be placed on the monthly (m/m) Core PCE reading, as it is more sensitive to short-term changes in inflation. Even if inflation accelerates in the current month (a high MoM print), the year-over-year figure may continue to decline for several months due to base effects — comparisons against elevated readings from the prior year.
It is also important to pay close attention to revisions of the previous month’s data.
The market evaluates releases through the lens of trend, which is often just as important — if not more so — than a single data point.
For example, imagine that the current month’s Core PCE comes in exactly in line with consensus at 0.2%. At first glance, this looks benign. However, if the previous month’s figure is revised upward from 0.3% to 0.5%, the picture changes entirely. Such a revision would be inconsistent with the Fed’s 2% inflation target and would undermine the narrative of a smooth and sustained disinflationary trend.
Market Reaction
Market reaction to inflation data is fundamentally driven by expectations of future Federal Reserve actions. A sustained rise in inflation reinforces a hawkish scenario: the Fed is forced to maintain or tighten monetary policy, which leads to higher interest rates, a stronger dollar, rising Treasury yields, and downward pressure on equities.
Conversely, a consistent decline in inflation signals that the Fed’s measures are working and opens a dovish window for potential easing in the future. This implies the prospect of rate cuts, which typically acts as a catalyst for equity markets, while pushing Treasury yields lower and weakening the domestic currency.
However, accurate analysis is impossible without considering the broader macroeconomic context. For instance, if a prevailing trend has already been established by weak labor market data and a soft CPI report, even a neutral PCE release that comes in line with consensus is often interpreted as a confirmation of that trend. In such an environment, the absence of a negative surprise becomes a positive signal in itself, providing additional support for equities.
That said, the key element of analysis remains the probability of a fundamental surprise capable of breaking the existing trend built on earlier releases. Labor market data and CPI set the preliminary direction of expectations, but they do not carry finality. The PCE report, acting as a strategic “closing argument,” carries sufficient weight in the eyes of both the Fed and market participants to trigger a full reassessment of the priced-in scenario. A material deviation from consensus can do more than merely adjust expectations — it can invert the prevailing market logic altogether, leading to a regime shift across currency, bond, and equity markets.
Conclusion
Ultimately, market dynamics are a complex fusion of countless factors whose interactions often defy linear logic. This is precisely why outcomes so frequently diverge from even the most well-reasoned forecasts.
The only way—if not to tame, then at least to comprehend this force—is to develop your own analytical judgment. Critical thinking and the ability to construct an independent view of reality are the most valuable tools in a world with no guarantees and no ready-made solutions. Neither the forecasts of research desks nor the opinions of popular commentators can replace your personal ability to interpret data, weigh risks, and connect fragmented facts into a coherent hypothesis. This is the path from following noise to understanding signal.
Enjoy!

Indices Futures or Forex? The Practical Truth Nobody MentionsToday is not gonna be technical. There is a lot of debate online about whether Indices futures or forex is better, but most of the time this discussion is completely disconnected from real trading life. Im not saying one is better than the other here is just my recent observations.
The real differences are not hidden in some advanced strategy. They are very practical. Spreads, fees, Trading hours, chart quality, and how all of this fits into your daily routine.
From a cost perspective, Indices futures are very transparent. You know exactly what you pay per contract and the spread is usually tight and stable. What you see is what you get.
Forex works differently. Costs are mostly built into the spread and swaps that spread can widen. This does not make forex worse, but it does change how clean your execution feels, especially if you trade intraday.
💊 Trading form US Timezone
I spent the last two weeks in the US, and for the first time I fully felt what it means to miss the London session. Opening the charts straight into New York felt completely different, almost like stepping into the market mid-story. As I perform better in reversal and market manipulations joining continuation setups was not comfortable for me. Why?
Because, during London session is where most of the manipulation and real positioning happens for Forex. That is where liquidity is built, swept this is where Im usually entering for past few years. No saying that New York also cannot make a manipulations and good setups, but trading just New York session felt like having just a half time to trade.
That experience helped me understand why so many US traders focus almost exclusively on the US Indices Futures Day-trading like NQ, ES and YM.
📌 Trading time
US Futures traders getting ready around 9 am. Real move usually starts at after 9:30 manipulation. I believe that we are focusing best in the morning hours, so US day traders can be basically done before the lunch. Then the platform is closed and life continues. That is the point of trading and I can imagine doing that if living in the US.
In Europe, the reality is flipped. Trading US Indices futures means coming to the charts in the afternoon around 3pm, which for me and many people is when focus and energy are already lower. However it can fit to someone who has some job or school and don't have other option.
🧩 Forex Traders
Forex traders usually watch many pairs at the same time on timeframes like W1, D1, H4, M15. for swing trades or intra week trades. If you scalping in and out in the CFD broker you should consider Futures E6 etc... contracts for better fees which can make difference in the your final profitability.
🧩 Futures day traders
Usually specialize to One market. And watches other highly correlated as NASDAQ, S&P, Dow,, which allows traders to use relative strength and SMT between NQ, ES, and YM instead of scanning dozens of charts. Timeframes M1, M3, M5, and levels.H1, H4, D1
📉 Chart quality Futures
Futures Contracts are centralized. One market, one price feed. A NQ chart looks the same on every platform and with every broker. Highs, lows, wicks, and closes are identical. Your analysis is based on the market itself, not on which broker you use.
📉 Chart quality Forex
FX is decentralized. Every broker uses slightly different liquidity sources, and that creates differences in candles. Sometimes small, sometimes big enough to completely change your analysis. One broker shows a clean sweep of a level, another one does not. One candle taps a key level, another misses it by a few pips. If you trade price action or liquidity concepts, this can create hesitation and second-guessing.
So if you ask me whether futures or forex is better, my answer is simple.
Trading let you express yourself like nothing else and you really need to find yourself comfortable in your approach. Trading should adapt to your life and your energy, not force you to adapt your life to the charts. I would say it can depends on:
🧪 1. What kind of trader you are
- Day trader - Entering and Closing multiple trades in a day - Go Futures
- Swing Trader - Watching also cross pairs and holding for days / weeks - CFD is good
🧪 2. Where you are based
- United States - Indices Futures day trading is usually option for most traders, because waking up at 2am for London session is not suitable for everyone. Also at 5PM US time spreads are already widen.
- Europe - You can take advantage of London session which is where mostl of the Forex Market movements starts. If scalper - go with Indices Futures as FDAX, if scalping FX got with futures contracts E6 - EURO etc...
⭕ Summary:
I can not say one is better than the other, go with the one that fits your lifestyle, timezone and your mainly your trading style.
Let me know your experience and what I missed
I promised myself I’d become the person I once needed the most as a beginner. Below are links to a powerful lessons I shared on Tradingview. Hope it can help you avoid years of trial and error I went thru.
📊 Sharpen your trading Strategy
⚙️ 100% Mechanical System - Complete Strategy
🔁 Daily Bias – Continuation
🔄 Daily Bias – Reversal
🧱 Key Level – Order Block
📉 How to Buy Lows and Sell Highs
🎯 Dealing Range – Enter on pullbacks
💧 Liquidity – Basics to understand
🕒 Timeframe Alignments
🚫 Market Narratives – Avoid traps
🐢 Turtle Soup Master – High reward method
🧘 How to stop overcomplicating trading
🕰️ Day Trading Cheat Code – Sessions
🇬🇧 London Session Trading
🔍 SMT Divergence – Secret Smart Money signal
📐 Standard Deviations – Predict future targets
🎣 Stop Hunt Trading
💧 Liquidity Sweep Mastery
🔪 Asia Session Setups
📀 Gold Strategy
🧠 Level Up & Mindset
🛕 Monk Mode – Transition from 9–5 to full-time trading
⚠️ Trading Enemies – Habits that destroy success
🔄 Trader’s Routine – Build discipline daily
💪 Get Funded - $20 000 Monthly Plan
🧪 Winning Trading Plan
⭕ Backtesting vs Reality
🛡️ Risk Management
🏦 Risk Management for Prop Trading
📏 Risk in % or Fixed Position Size
🔐 Risk Per Trade – Keep consistency
🧪 Risk Reward vs Win Ratio
💎 Catch High Risk Reward Setups
☯️ Smart Money - Who control Markets
Adapt useful, Reject useless and add what is specifically yours.
David Perk
TRADING DISCIPLINE — READ BEFORE YOU TRADE!!Every trade must have a reason.
Not a feeling. Not FOMO.
Entry & Exit
You only enter when there is clear confirmation or a specific price level that fits the plan.
Your stop loss is placed at the invalidation level if price reaches it, the idea is wrong.
Take profit is set based on realistic market conditions, not greed.
Once the stop loss is set, it is final. Never widen your stop loss.
What you decide before entering is your responsibility as a disciplined trader.
Risk Management
Risk per trade is 1%. Maximum 2.5% only when using a high win-rate strategy.
You must have daily and weekly loss limits.
When the limit is hit, stop trading! your mindset is no longer objective.
The market will always be here tomorrow, but your capital might not be.
Limit the number of trades per day, because more trades do NOT mean more profit.
Never trade during high-impact news. Trade after the news, when direction is clearer.
Market & Timeframe
Define bias on the higher timeframe.
Execute on the lower timeframe.
Never trade against the higher timeframe context.
Market Conditions
Always understand the environment: bull or bear market.
Identify market structure / trending or ranging.
Avoid unstable or chaotic volatility.
Trade only during your chosen market session: Asian, London, or New York not all sessions.
Psychology
Losses are business expenses.
Wins don’t justify breaking rules.
If you’re tired or emotional, don’t trade.
Discipline over emotion.
Always.

GBPUSD PSYCHOLOGY: Profitability is a Decision, Not a StrategyMost traders don’t fail because they lack strategy.
They fail because they never slow down long enough to master one market.
In this video, I’m starting the only series I’m running in 2026: Mastering GBPUSD.
This is not about indicators or hype. It’s about rebuilding consistency by focusing on one pair, learning its rhythm, managing drawdown, and developing the discipline most traders avoid.
We cover
• Why mastering GBPUSD starts with a decision, not a strategy
• How to build trust in a market before increasing position size
• How to sit through normal drawdown without sabotaging your plan
• Practical ways to observe price, mark levels, and reduce overtrading
• Why alerts and walking away matter more than staring at charts
If you’ve traded before, had success, lost momentum, and you’re looking to get back into rhythm, this video is for you.
This series is about focus, patience, and self-mastery through one market.
Watch. Apply. Repeat.
Comment “GBPUSD only” if you’re committing to this journey, and subscribe so you don’t miss the next deep dive in the series.

How To Make Macroeconomics Work For YouIntroduction
Trading around news releases is a powerful tool in financial markets.
The ability to identify the direction of the economy and understand market behavior is a skill that requires patience and extensive practice. In this post, we break down the theory behind trading macroeconomic releases and systematically explain how to form a structured view of the market.
Actual vs. Consensus
In almost any economic calendar, you will see a consensus / forecast column. To properly understand released macroeconomic data, it is not enough to simply look at the headline number. The key to interpretation lies in comparing the actual result with the consensus forecast.
This deviation — often referred to as a “surprise” — is the primary driver of volatility in financial markets.
The reason is that the market is a forward-discounting machine. By the time a report is released, asset prices already reflect the prevailing consensus expectations. The market has priced in a specific scenario. When the actual data comes in above or below those expectations, an immediate repricing occurs — the market reassesses future growth, inflation, and central bank policy paths, adjusting prices to reflect the new information.
Therefore, at the moment of the release, the market is not reacting to the number itself, but rather correcting a previously held — and potentially incorrect — expectation. It is this collective and instantaneous adjustment that creates the surge in volatility we observe around economic data releases.
Trend
Trend is the alpha and omega of analysis — the foundation upon which most trading systems are built. This principle fully applies to macroeconomics as well: to correctly interpret a single data release, one must clearly understand the trend in which the economy, or a specific sector, currently operates.
Yes, a trend on its own rarely generates the same explosive volatility as an unexpected deviation from consensus. However, its role is far more fundamental: the trend is what shapes the consensus itself. The dynamics of previous months define the baseline for analysts’ forecasts and market expectations.
Without accounting for the trend, an individual macro indicator becomes just a number in a vacuum. It may point to completely opposite scenarios depending on interpretation. Data must be evaluated in context and over time. A sector may be performing below its long-term averages, but consistent improvement over recent quarters can be a clear signal that central bank policy is having a positive effect. Conversely, a peak reading within a broader downtrend is far more likely to be a statistical anomaly than a genuine turning point.
Historical data serves as a compass for central banks. By understanding what is “normal” for a given sector, policymakers can interpret readings that break away from the trend not as noise, but as structural shifts — a “slowdown in growth” or a “fundamental change in trend.” This is the power of trend analysis: it separates signal from noise, transforming raw data into a coherent picture of the economic cycle.
Context
Accurately understanding the macroeconomic landscape and anticipating market reactions is only possible when data is viewed collectively, not in isolation. Financial markets are complex, interconnected systems, where developments in one sector inevitably ripple through others.
Labor market data directly shape inflation expectations. Central bank decisions and forward guidance impose structural constraints, defining not only the current phase of the cycle but also future conditions across the entire spectrum of assets.
Equally important is the global political and geo-economic backdrop. These forces either introduce a risk premium, increasing volatility, or reduce uncertainty, making outcomes more predictable.
Together, all of this forms the context — the interpretive framework in which numbers exist. Without it, even the most significant deviation from forecast is nothing more than a statistical outlier. Context turns fragmented data into a coherent narrative, allowing us to understand what is truly happening in the economy and where capital is flowing.
The ability to identify this context is the core skill that translates the language of macroeconomic statistics into the language of real market movements.
Federal Reserve Policy
We have reached the key element that determines the development of both individual sectors and the financial market as a whole. Central bank policy is the primary force that sets the rhythm of market movements. Most forecasts and trading strategies ultimately boil down to an attempt to anticipate the regulator’s next steps.
When analyzing a new set of data, the first question we ask is:
what does this mean for the Federal Reserve? What actions will the regulator take to stabilize conditions or support positive momentum?
To do this, the central bank has a set of fine-tuning tools at its disposal. By understanding how each of them works, one can form well-reasoned assumptions about the future direction of financial markets. The central bank’s toolkit includes:
• the policy interest rate
• the interest rate on reserves
• forward guidance
• balance sheet operations
• open market operations
• direct lending facilities
All of these are important, but the central role belongs to the policy rate — the Federal Funds Rate (FFR).
The policy rate is the central bank’s main interest rate. It defines the base cost of money in the financial system and serves as the primary benchmark for all other interest rates in the economy. By adjusting it, the central bank directly influences inflation and economic activity.
Accommodative stance (rate cuts):
The central bank lowers borrowing costs for businesses and households. This expands the money supply and stimulates demand, supporting economic growth, but it also creates inflation risks and may put downward pressure on the national currency.
Restrictive stance (rate hikes):
The central bank makes borrowing more expensive. This cools demand, slows economic activity, and restrains inflationary pressure. In such an environment, the cost of money in the economy rises, often leading to a strengthening of the national currency.
Thus, by monitoring the Fed’s rate decisions, we gain insight not only into the current diagnosis of the economy, but also a clear signal of the environment — accommodative or restrictive — in which all markets will operate in the near future.
Which Data Actually Move the Market?
Having mastered the basic principles of macro analysis, we move on to practice. Now, when looking at an economic calendar, we no longer see just a list of events — we understand their meaning and can anticipate market reactions. To do this, indicators must be grouped by the type of information they provide about the state of the economy.
1. Inflation Indicators
CPI (Consumer Price Index) and especially Core CPI are the primary measures of consumer inflation and directly influence central bank decisions.
2. Labor Market Data
• NFP (Nonfarm Payrolls) and the Unemployment Rate (UR) are key indicators of labor market health.
• AHE (Average Hourly Earnings) reflects wage-driven inflationary pressure.
• JOLTS (Job Openings, Quits) are leading indicators of labor demand and worker confidence.
• Jobless Claims provide a weekly “pulse check” of the labor market.
3. Consumer Demand Indicator
Retail Sales are the main barometer of consumers’ willingness to spend and a key component of GDP.
4. Leading Indicators
PMI (Purchasing Managers’ Index) from ISM and S&P Global is the most important monthly leading indicator, capturing sentiment and the pace of change in the real economy (manufacturing and services).
Beyond these indicators, there are many other important metrics (industrial production, consumer confidence, housing data). However, we focus on the primary market movers — the releases that generate the most volatility and most often reshape the market narrative. Understanding these four categories provides the key to decoding the majority of price movements driven by macroeconomic news.
Inflation Indicators (CPI and Core CPI)
These indices track changes in the cost of living. Imagine a basket that contains everything a typical household buys: food, gasoline, housing costs, clothing, and medical services.
The headline Consumer Price Index looks at this entire basket. However, prices for certain items — such as gasoline or vegetables — can swing sharply due to weather conditions or political decisions. These swings create a lot of noise and make it harder to see the underlying trend.
That is why analysts and central banks focus primarily on core inflation. It is the same index, but with the most volatile components — food and energy — removed. What remains are prices that move more slowly but persistently: rent, childcare, repair services, and healthcare.
If core inflation is rising, it means the foundation of everyday life is becoming more expensive. The cause is usually an overheated economy — when consumers have ample money and are willing to pay more, while businesses face rising costs, often driven by higher wages. This type of inflation is sticky and difficult to contain. That is precisely why central banks react to core inflation when deciding whether to raise interest rates.
If, on the other hand, only headline CPI rises due to a temporary spike in gasoline prices while core inflation remains stable, the central bank is unlikely to tighten policy — such moves are usually seen as transitory.
Labor Market Data (NFP, AHE, JOLTS, Jobless Claims)
The labor market is not a collection of isolated numbers, but a living system where some indicators lay the groundwork for others. To understand it, one must see the sequence and the cause-and-effect relationships.
The first warning signal usually comes from weekly jobless claims. When the number of people filing for unemployment benefits begins to rise consistently, it is a direct signal that companies are laying off workers more frequently. This is the earliest indication that, a few weeks later, the main monthly report may deliver unpleasant surprises: weak job growth or even outright job losses, followed by a rise in the unemployment rate.
However, the strength of the labor market is determined not only by the number of jobs, but also by their quality and the balance of power between employers and workers. This is where the JOLTS report on job openings and labor turnover becomes critical. When job openings are abundant and workers are quitting voluntarily in large numbers, it points to a unique situation: employees are confident enough to switch jobs in search of higher pay. This scenario almost inevitably leads to accelerated wage growth, which later shows up in the Average Hourly Earnings (AHE) data.
Wages are where the strongest link to central bank policy lies. Persistent wage growth acts as a powerful engine for inflation in the services sector. Therefore, when the Fed sees low unemployment combined with steadily rising wages, it has little choice but to keep interest rates high in order to cool the economy. Conversely, when job creation slows and wage growth begins to decelerate, it sends the regulator a long-awaited signal that labor-driven inflationary pressure is easing — opening the door to discussions about policy easing.
By closely monitoring weekly jobless claims and vacancy data, one can anticipate the likely outcome of the key monthly labor report and, with a high degree of confidence, predict how the central bank will react.
Consumer Demand Indicator (Retail Sales)
This is the most direct snapshot of household wallets. The index shows how much money consumers spent during the month on goods — in physical stores, online, at car dealerships, and at gas stations.
Its strength lies in its simplicity. It does not attempt to predict the future or measure sentiment — it simply records whether people are actually spending their money. And since household consumption is the main engine of the U.S. economy, this number is closely watched by everyone.
Retail Sales are highly sensitive to two factors: labor market conditions and Federal Reserve policy.
When jobs are plentiful and wages are rising (strong NFP and AHE), consumers spend with confidence — sales increase.
When the Fed raises rates, borrowing costs (including credit cards) rise, large purchases are postponed, and sales slow or decline.
As a result, Retail Sales often serve as the final confirmation — or refutation — of trends suggested by other data. Persistent growth in sales despite high interest rates tells the Fed that the economy remains too hot and that policy is not restrictive enough. A sudden drop, especially against the backdrop of an already weakening labor market, becomes a powerful argument for a pivot toward policy easing.
What to focus on in the data:
• The month-over-month change, with particular attention to the Control Group, which excludes the most volatile components (autos, gasoline, and building materials) and provides a cleaner view of core consumer activity.
Leading Indicator (PMI)
PMI is a leading indicator that captures turning points in the economic cycle.
It does not measure production volumes or revenues. Its purpose is to identify the moment when business activity is accelerating or beginning to contract. The index is based on surveys of executives who make daily decisions about purchasing, hiring, and investment. Their collective assessment of changes is one of the most sensitive barometers of demand dynamics.
The key is not the absolute level of the index, but its direction and internal components. A decline from 55 to 52 still signals expansion, but indicates a loss of momentum. A rise from 48 to 49 still reflects contraction, but points to a slowdown in the pace of decline.
For central banks, two PMI components are particularly critical:
• New Orders — the purest indicator of future demand. A decline here typically precedes reductions in production and investment.
• Prices Paid — a direct signal of inflationary pressure in supply chains and the services sector. Sustained increases in this component can prevent monetary policy easing, even if the headline index is slowing.
PMI functions as an early warning system. A sustained deterioration over several months often precedes slower GDP growth and weakening labor market data. Conversely, resilience at elevated levels — especially when price components are rising — serves as evidence for central banks that the economy is overheating and that a restrictive stance must be maintained.
Conclusion
You now have a solid theoretical foundation for interpreting news releases and the signals they send to the market. To truly understand this framework and apply it effectively in trading, consistent practice is essential. From my own experience, keeping a macro trading journal can be extremely helpful. Record how the market reacts under different conditions and gradually develop your own independent view of each situation.
Be especially cautious of market rumors — more often than not, such opinions are simply attempts to attract attention with sensational headlines rather than provide meaningful insight.
Enjoy!

Institutional Levels: Whole, Half, Quarter Numbers - StrategyHi guys, today let's look to the level which can give your levels higher probability or can be just used by its own.
Under an “institutional” lens, those whole/half/quarter prices are not “psychology.” They are liquidity engineering points: standardized, widely-watched round-number grids where large participants can execute size with less slippage and better control of average fill.
📌 1) What “institutional levels” are in plain terms
Institutions (banks, macro funds, CTAs, options desks, corporates, systematic execution algos) care about one thing that retail rarely feels: How to transact large volume without moving price too much.
🧩The easiest places to do that are prices where orders naturally cluster:
• Whole numbers (…00)
• Half numbers (…50)
• Quarter numbers (…25 / …75)
🧩 Example (EURUSD):
• Whole: 1.2000, 1.2100
• Half: 1.2050, 1.2150
• Quarter: 1.2025 / 1.2075, etc.
Look how every significant price turn has happened around these levels 🧩 These are “institutional levels” because they attract:
• Resting liquidity (limits, stops, take-profits)
• Execution algos slicing orders around obvious references
• Options-related flows that often gravitate around strikes (frequently round numbers)
• Risk management anchoring (rebalance around clean reference points)
📌 2) Why “psychological levels” is a misleading story
Retail typically hears: “People feel 1.2000 is important.” But people doesn't move the market. Institutions does. The level is important because that’s where the liquidity is, and liquidity is where big money can do business.
🧠 I n the end if you call it psychological level or institutional really doesnt matter. Important is to know what to do around such levels.
📌 3) What banks and large desks are “doing” around these levels
Think in terms of inventory and filling, not prediction. Traders treats the level like a line that “should hold. ”Institutions treat the level like a zone of business:
• price may pierce it,
• hover around it,
• and only later reveal direction once the liquidity is processed. 🧩 A) Building a position requires liquidity
If a big players needs to accumulate longs, they need sellers. Where are sellers concentrated?
• Above obvious levels (breakout buyers, stops, momentum)
• Below obvious levels (stop-loss clusters, breakdown sellers)
🧩 B) The “run the level” behavior is usually about fills
Common institutional sequence:
1. Price approaches a round level.
2. Price briefly trades through it (to access the liquidity on the other side).
3. You see fast movement and a burst of participation.
4. Price either rotates back (if liquidity was used to fill) or continues (if genuine continuation demand remains).
‼️ TIp - These levels are where you can expect big players trade, but if you connect it with another market context it will make even more sense. For example if you have supply / Demand Level / Order block with confluence with these levels = Strong Zone.
💊 Here is the institutional playbook you can apply immediately:
It's always better if you have complete strategy which you trade. Level is just a level it's a part of the strategy. I you are looking to day trade this concept works well with these levels.
Click the picture below to learn more 🧪 Step 1: Mark the Key Levels
• Whole + half levels always
• Quarter levels near current price (optional) 🧪 Step 2: Trade Manipulation around key Level/b]
Is price being accepted above the level or rejected?
• Preferably during the London Session or NY session Opens
• In Confluence with Asia Session Liquidity it makes sense
• Rejection: price pops above, fails quickly, and returns below with urgency. 🧪 Step 3: Look for the liquidity event
Two high-probability events at institutional levels:
• Sweep: quick push through the level and immediate return
• Absorption: repeated tests into the level where progress stalls (someone is filling size). 🧪 Step 4: Only enter after change in order flow Close above the manipulation candles. Structure break with close / Engulfing I promised myself I’d become the person I once needed the most as a beginner. Below are links to a powerful lessons I shared on Tradingview. Hope it can help you avoid years of trial and error I went thru.
📊 Sharpen your trading Strategy
⚙️ 100% Mechanical System - Complete Strategy
🔁 Daily Bias – Continuation
🔄 Daily Bias – Reversal
🧱 Key Level – Order Block
📉 How to Buy Lows and Sell Highs
🎯 Dealing Range – Enter on pullbacks
💧 Liquidity – Basics to understand
🕒 Timeframe Alignments
🚫 Market Narratives – Avoid traps
🐢 Turtle Soup Master – High reward method
🧘 How to stop overcomplicating trading
🕰️ Day Trading Cheat Code – Sessions
🇬🇧 London Session Trading
🔍 SMT Divergence – Secret Smart Money signal
📐 Standard Deviations – Predict future targets
🎣 Stop Hunt Trading
💧 Liquidity Sweep Mastery
🔪 Asia Session Setups
📀 Gold Strategy
🧠 Level Up & Mindset
🛕 Monk Mode – Transition from 9–5 to full-time trading
⚠️ Trading Enemies – Habits that destroy success
🔄 Trader’s Routine – Build discipline daily
💪 Get Funded - $20 000 Monthly Plan
🧪 Winning Trading Plan
⭕ Backtesting vs Reality
🛡️ Risk Management
🏦 Risk Management for Prop Trading
📏 Risk in % or Fixed Position Size
🔐 Risk Per Trade – Keep consistency
🧪 Risk Reward vs Win Ratio
💎 Catch High Risk Reward Setups
☯️ Smart Money - Who control Markets
Adapt useful, Reject useless and add what is specifically yours.
David Perk

Why Small Accounts Blow Up (It’s Not the Market)A question I see everywhere in trading is:
“Can I start trading with a small account?”
Like $100… $200… $300…
And the honest answer is:
✅ Yes, you can start.
But the real problem is not the account size.
The real problem is the expectation behind it.
Because most traders don’t ask this question from curiosity.
They ask it from pressure.
The small account is not the danger — the mindset is
A small account becomes dangerous when you treat it like:
- a rescue plan
- a shortcut
- a “last chance”
- a quick flip into financial freedom
That mindset quietly forces urgency into your decisions.
And once urgency enters trading, you get the classic spiral:
❌ bigger lot sizes
❌ no stop loss discipline
❌ revenge trades
❌ chasing volatility
❌ “I just need one good trade…”
That’s not trading.
That’s emotional survival mode.
What most people really mean by “small account”
Let’s decode the real question:
When someone says “Can I start with $200?” they usually mean:
“Can I turn this into a big amount quickly?”
And that’s where trading goes wrong.
Because the market doesn’t reward hope.
It rewards execution.
The market doesn’t pay you faster because you need it
Trading doesn’t care if you’re struggling.
It doesn’t care if you’re a good person.
It doesn’t care if you “deserve” a win.
It only responds to:
✅ discipline
✅ risk management
✅ consistency
✅ probabilities
This is why many traders get emotionally exhausted.
They are not fighting the market…
They are fighting reality.
A small account should be a training account
If you start small, the healthiest approach is to treat it like:
📌 a skill-building account
not an income-producing machine.
Your job is not to “make money fast.”
Your job is to build:
- stable execution
- controlled risk
- emotional patience
- repeatable decisions
Because that’s what scales later.
The harsh truth: “one month to change everything” is a fantasy
One of the most common mental traps in retail trading is:
“I just need one month… then I’ll be set.”
But if your plan depends on a short deadline…
- you are not trading probabilities.
- You are betting on a miracle.
- And miracles don’t build careers.
So yes, you can start small — but only with realistic rules
Here’s what a small account needs:
✅ small position sizing
✅ strict risk per trade
✅ patience with slow growth
✅ acceptance of losses
✅ focus on process > outcome
Most traders don’t fail because the account is too small.
They fail because their expectations are too big.
Final thought
If you’re starting with a small account, respect it.
Because it’s not “small money.”
It’s your tuition fee into a profession.
Trading isn’t hard because charts are complex.
It’s hard because your emotions don’t want to be realistic. 🚀

TOP 5 TRADINGVIEW TOOLS 2026 (NOT INDICATORS)Most traders don’t need more indicators — they need better tools and better habits.
In this video, I break down my top 5 TradingView tools that I actually use to stay focused, reduce overtrading, and trade with clarity. These aren’t indicators or complicated systems. These are practical tools that help you read price, manage risk, and step away from the charts without missing opportunity.
If you’ve ever felt burned out, distracted, or stuck staring at charts all day, this video will help you simplify your approach and trade with intention.
Watch to learn:
• How to use alerts to protect your focus
• Why rectangles beat lines for real market structure
• How replay mode builds consistency like target practice
• The risk tool most traders ignore (but shouldn’t)
• How slowing down improves your price reading
CTA
If this video helped you, like and subscribe for more practical trading breakdowns. Drop a comment and tell me which TradingView tool you’re committing to use better starting today.

Complete Guide To Backtesting In TradingBacktesting — The Cure for Losses
Backtesting is the process of testing a trading idea on historical data before you risk real money. It’s like going back in time and asking: “If I had traded these rules before, would I have made money or not?”
Why Backtesting Matters
Separate Ideas from Illusions
Many strategies look promising at first glance. Visually — they seem solid. Emotionally — “it’s obvious this should work.” Backtesting quickly sobers you up:
Either the idea has a statistical edge,
Or it’s pure self-deception.
Understand the Math Behind the Strategy
Backtesting answers questions you can’t solve intuitively:
What’s the average profit per trade?
How many losing trades in a row are normal?
What’s the actual drawdown?
How many trades per month/year?
After a solid backtest, you stop fearing normal drawdowns — because you know the stats.
Save Money and Nerves
The market is an expensive teacher. Backtesting is free.
Every strategy untested on history is an experiment at your own expense.
Build Confidence in the System
When you have hard numbers:
You stop overreacting.
You break rules less often.
You avoid “jumping in because it felt right.”
You’re trading a process, not hope.
What You Must Understand Up Front
Backtesting does not guarantee future profits. Markets evolve — and that’s normal.
But backtesting does show:
Whether the idea had an edge.
What risks are involved.
Why trading blind is reckless.
It’s like checking your car before a trip. It doesn’t guarantee no accidents, but driving without it is just foolish.
What Exactly Do We Backtest?
We don’t test a single entry model or one indicator. We test a trading system defined by clear rules. That’s crucial — until an idea becomes a system, it can’t be objectively verified.
1. The Logic of Decision-Making
The test object is the logic behind your trades. Primarily — market context:
Why do you use this entry model here?
What in price action or market behavior gives you reason to expect movement in your favor?
Not just “RSI below 30” as a fact, but what it represents — imbalance, momentum, reaction to a level, or dislocation. If entry logic isn’t meaningful, backtesting degenerates into signal-hunting.
2. Trade Exit
This is where most of the results are shaped. We test:
Where losses are cut.
Where and how profits are taken.
Whether exits use fixed targets, logical levels, partial closes, or trailing stops.
Often the same entry, with different exit rules, produces radically different equity curves — from a robust system to a total blow-up.
3. Risk Management
Risk per trade, risk/reward ratio, the impact of losing streaks on equity — all are part of the hypothesis. A strategy may be sound, but with poor risk management it becomes unsustainable. In backtesting, we look not only at profits, but at how the system survives drawdowns.
4. Filters
When does the strategy perform best?
During certain times of day?
Under specific volatility conditions?
In trends or ranges?
Often, adding a simple filter eliminates most losing trades and dramatically improves stability.
5. Repeatability
Does the hypothesis work across different historical periods, market phases, and instruments? If it only shows results in one year — that’s not a trading system, it’s curve-fitting.
What We Do Not Test
We don’t test feelings like “this looks logical.” We don’t test pretty trades. We don’t chase a perfect equity curve without drawdowns.
Backtesting is not about confirming expectations — it’s about stress-testing them.
Key Metrics to Track
1. Win Rate (Percentage of Profitable Trades)
Win Rate is the proportion of profitable trades relative to the total number of trades over a selected period.
Formula:
Win Rate (%) = (Number of Profitable Trades / Total Number of Trades) × 100
Example:
Total trades: 120
Profitable trades: 42
Losing trades: 78
Calculation:
Win Rate = 42 / 120 × 100 = 35%
Strategy Win Rate = 35%.
What counts as a profitable trade:
A trade is considered profitable only if the final result is positive after accounting for commissions and slippage.
Trades closed at breakeven or with a small loss due to fees are not considered profitable.
A high Win Rate does not guarantee a reliable or profitable strategy.
2. Risk / Reward Ratio (R:R)
Risk / Reward (R:R) reflects the ratio between the average risk and the average potential profit per trade. It shows how much profit the strategy generates per unit of risk.
For beginners, acceptable R:R values are typically 1:2 or 1:3.
Strategy profitability is driven by asymmetry between losses and gains, not by the frequency of winning trades.
3. Expectancy
Expectancy is the average financial outcome of one trade over the long term.
It answers the key backtesting question:
Does the strategy make money on average per trade?
Basic Formula:
Expectancy = (WinRate × AvgWin) − (LossRate × AvgLoss)
Where:
WinRate — proportion of profitable trades (not in %)
LossRate = 1 − WinRate
AvgWin — average profit of winning trades
AvgLoss — average loss of losing trades (absolute value)
A positive expectancy is a mandatory condition for a viable strategy.
4. Trade Distribution by Sessions (Asia / Europe / US or Specific Hours)
Analyze trades by time to understand where performance is actually coming from.
Key questions to analyze:
Where is the majority of profit generated?
Which sessions drag overall performance down?
Where volatility is high but results are poor?
Common scenario:
Asia — negative
London — neutral
New York — generates almost all the profit
5. Time-Based Expectancy
Expectancy should be analyzed not only overall, but also:
By session
By individual hour
This is one of the strongest performance filters.
Number of Trades by Time
A time slot may appear profitable, but if it has only a few trades per year, the result is statistically insignificant.
Drawdown by Session
Sometimes a session is profitable overall, but its drawdowns during specific hours are psychologically unacceptable
6. Expectancy: Long vs Short
Very often:
Long trades produce stable and smooth results
Short trades produce sharp gains but with deep drawdowns
Or vice versa.
Win Rate by Direction
Win Rate may be similar, but:
Longs may have smaller stop losses
Shorts may experience frequent stop-outs
If expectancy in one direction is below zero, it should be:
Removed entirely, or
Strongly restricted.
Common Backtesting Mistakes
1. Look-Ahead Bias (Future Leak)
This occurs when the principle of sequential analysis is violated.
Trading decisions are made using information that would not have been available in real time.
Examples:
Analyzing fully formed highs or lows;
Using closed candles that did not exist at the moment of entry;
Adjusting entries or stop losses after seeing future price movement.
Consequences:
Significant overestimation of strategy performance;
Distorted and misleading statistics.
Correct Approach:
Move strictly from left to right on the chart;
Hide the right side of the chart;
Make decisions only based on information available at that moment.
2. Curve Fitting (Over-Optimization)
This mistake occurs when a strategy is excessively optimized for historical data by adding too many conditions and parameters.
As a result:
The strategy perfectly explains the past;
But loses its ability to work in the future.
Rule of thumb:
If a strategy cannot be explained in simple words without a chart, it is most likely over-optimized.
3. Ignoring Commissions and Slippage
In many backtests:
Entries and exits occur at “ideal” prices;
Orders are assumed to be executed instantly;
Commissions are ignored or underestimated.
Why the impact is often underestimated:
Fees seem small (0.05–0.2%);
Each individual trade appears barely affected;
The cumulative effect becomes visible only over time.
Particularly vulnerable strategies:
Scalping;
High-frequency trading;
Systems with low Risk/Reward ratios.
Such conditions do not exist in real trading.
Correct Approach:
Always include commissions on both entry and exit;
Apply conservative slippage assumptions;
Test closer to the worst-case scenario, not the best;
Use real exchange and instrument parameters.
If a strategy becomes unprofitable after accounting for commissions and slippage, it never had a real edge
4. Testing Only “Favorable” Market Conditions
This methodological error occurs when a strategy is tested only during market phases where it naturally performs best.
This creates an illusion of robustness that is not confirmed across real market cycles.
A strategy must be tested under:
Trending markets;
Ranging (sideways) markets;
Periods of high volatility;
Periods of low volatility.
It is acceptable that a strategy:
Performs well in some regimes;
Loses money or stagnates in others.
The key is understanding where and why this happens.
A strategy that works only in favorable conditions is not a trading system.
Proper backtesting must account for market variability and evaluate performance across all market regimes.
Evaluating Strategy Fit for the Trader
1. Psychological Compatibility
Assess your tolerance for:
Losing streaks;
Waiting for valid trade setups;
Holding positions over time.
2. Lifestyle Compatibility
The strategy should align with:
Available time;
Required level of concentration;
Daily work rhythm.
3. Risk Profile
A comfortable strategy:
Does not induce panic;
Does not trigger impulsive decisions;
Provides a sense of control.
4. Final Check
If you break the rules on a demo account,
you will break them even more often on a live account.
A good strategy looks:
Boring;
Clear;
Predictable
Backtesting Features and Pitfalls in TradingView
Before starting backtesting, it is important to understand certain specifics of how TradingView displays data.
If these nuances are ignored, you will almost inevitably introduce look-ahead bias and distort your test results.
Choosing a Backtest Starting Point in TradingView:
When selecting the starting point for a backtest in TradingView, there are four main tools:
Select bar — you manually choose a specific bar on the chart from which you want to start the analysis.
Select date — you set a date from which the chart will be displayed.
Select the first available date — the backtest starts from the earliest available bar (relevant if your subscription has historical data limits).
Random bar — TradingView moves you to a random location on the chart.
Personally, for the sake of experimental integrity, I most often use Random bar.
This approach helps minimize look-ahead bias and makes the backtest closer to real trading conditions.
You do not know in advance what will happen next and are forced to make decisions under uncertainty — exactly as in live markets.
A Critically Important TradingView Behavior:
There is a TradingView behavior that many traders are unaware of, yet it can severely distort backtesting results.
When switching to a higher timeframe, TradingView always shows a fully closed candle, even if in real time that candle would still be forming.
Example 1
You are on a 5-minute chart in the middle of the trading day and decide to check the daily timeframe.
TradingView will show you the final daily candle, meaning you effectively see how the day will close.
As a result, you already know the outcome of the price movement and may subconsciously adjust your decisions based on future information.
Example 2
You are analyzing order flow on a 1-hour chart and decide to look at the weekly timeframe to identify key reaction zones.
If you simply switch to the weekly chart, TradingView will display a fully formed weekly candle, including its high, low, and close.
In practice, this means you already know how the week opens and closes while still analyzing trades within that same week.
This is direct look-ahead bias, which makes the backtest invalid.
How to Avoid Look-Ahead Bias in TradingView
To ensure an honest backtest, you must scroll the chart back before switching to a higher timeframe.
This is where the Select bar tool becomes essential.
The logic is simple:
If you want to view the daily timeframe — scroll back at least one full day.
If you are analyzing the hourly timeframe — scroll back at least one full hour.
If you want to view the weekly timeframe — scroll back at least one full week.
Only after that should you switch to the higher timeframe.
In this case, you will see only the information that was actually available to the market at that moment — without spoilers and without distorted data.
Enjoy!

GBPUSD: Mastering One Pair Is Like Getting Back in ShapeGBPUSD isn’t difficult because you lack skill. It’s difficult because it demands patience, structure, and trust.
In this three part series, I break down the art of mastering GBPUSD not through flashy setups or overcomplicated strategies, but through understanding how this pair actually moves and why it tests traders psychologically before it rewards them.
We’ll talk about structure, timing, execution, and the subtle mindset shifts that turn frustration into clarity. If you’ve ever felt like GBPUSD almost works for you—but not consistently—this series is designed to help you see what you’ve been missing.
This isn’t about trading more. It’s about trading with intention.
If this resonates, leave a comment, save the video, and let me know which part of GBPUSD you struggle with most. And if you want more breakdowns like this, follow the profile and turn on notifications so you don’t miss the next one.

The Fractality of Financial MarketsMarkets, much like nature, are fractal.
A fractal is a structure that repeats itself across different scales. Whether you zoom in or zoom out, the underlying pattern remains the same. Coastlines, trees, lungs, rivers, snowflakes, each displays complexity born from repetition, not randomness.
Financial markets behave in exactly the same way.
This single truth explains why markets are complex, why precision is elusive, and why rigid certainty is dangerous.
Fractality in Nature: A Useful Analogy
Consider a few natural examples:
The coastline paradox: The closer you zoom into a coastline, the longer and more irregular it becomes. There is no “true” length, only scale-dependent structure.
Trees and branches: A tree trunk splits into large branches, which split into smaller branches, which split into twigs, each level resembling the whole.
The human diaphragm and lungs: Expansion and contraction occur rhythmically. Zoom into the lungs and you’ll find the same branching patterns repeating down to the alveoli.
Nature does not move in straight lines.
It expands, contracts, corrects, and continues.
Markets do the same.
Markets as a Living, Breathing System
Let’s say your highest timeframe (Daily) is in an uptrend.
That trend will not move vertically upward. It will:
Expand (impulse)
Collapse (correction)
Expand again
This expansion and contraction is the market’s “breathing”, very much like a diaphragm.
Now comes the crucial insight:
Every higher timeframe trend is built from lower timeframe counter-trends.
This is fractality in action.
The First Anomaly: Lower Timeframes Move First
If the Daily chart is trending up:
The 4H chart will be the first to show weakness when a Daily correction is approaching.
The 1H chart will show even clearer counter-trend structure.
The 15m chart will exaggerate that move entirely.
To the untrained eye, this looks like:
“The trend is broken.”
In reality, it’s simply:
The next breath out.
The lower timeframe always becomes the first anomaly, moving counter to the higher timeframe, before the higher timeframe corrects.
This is not failure.
This is structure.
Multi-Timeframe Alignment: Where Traders Get Trapped
Let’s assume a common approach:
Daily → Trend bias
4H → Structure (continuation vs correction)
1H → Entries
15m → Refinement
On paper, this is logical.
In practice, it comes with a hard truth:
You are going to be wrong, sometimes very wrong.
Why?
Because fractal markets cannot align perfectly across all timeframes at all times.
At some point:
The Daily is still bullish
The 4H is correcting
The 1H looks bearish
The 15m is aggressively selling
If you expect harmony, you will:
Overtrade
Cut winners early
Hold losers too long
Lose emotional control
Eventually lose capital
The Key Insight: Stop Trying to Eliminate Uncertainty
Markets are not designed to reward certainty.
They reward:
Context
Risk management
Patience
Acceptance of being wrong
If your fundamentals are aligned, the market will tell you when it’s ready:
Through slowing momentum
Through failed continuations
Through structure shifts on lower timeframes
Your job is not to predict the breath;
Your job is to survive the breathing.
Why This Realization Saves Capital
The moment a trader truly understands fractality:
They stop forcing precision
They stop seeking perfect entries
They stop believing one timeframe is “lying”
They stop risking everything on being right
They realize that:
Losses are not mistakes, they are structural costs of participation.
Just like waves erode a coastline, drawdowns erode weak strategies.
Strong ones adapt.
Markets are not machines.
They are organic systems, shaped by human behavior, fear, greed, and time.
Like nature:
They expand
They contract
They repeat themselves endlessly
They punish rigidity
They reward adaptability
Make peace with being wrong.
Because in a fractal market, survival is the only edge that compounds.
