Solana ~ TRADE The CHOP: 3 Ways to Make ATLEAST +15%Choppy markets are identified by low volume and sideways trading / range trading. It seems uninteresting in most cases, but you don't have to sit around and wait for the next big impulse wave!
Here are three plays YOU can take during choppy markets:
1) 4H : Short Resistance
Chop trading can be a blessing - the price often touches the same support zone and the same resistance zone 2 - 3 times, before breaking out either way. This means that if you spot your zone early, you could take a short timeframe swing trade. Another way to find a trade is to look for gaps in the candles, for example:
2) 4H : Long Support
South Africa is in a time of turbulence, and the Rand is unpredictable as the effects of G20 settle in. During these times, and this counts for all markets, placing a low risk leveraged long on support is a way to trade the chop:
3) Daily : SPOT Hold to TP Zone
Nothing like a classic low risk trade - but you may need some patience with it! If you're not willing to look at charts all day, or have alarms wake you up at 2:30am to take a trade then this is your style., for example:
What do you do during choppy markets?
Tradingrange

3 Types of Trades – HPT – MPT and NTTrading isn’t just about luck.
Trading isn’t just about strategy.
Trading is about stats and probabilities and know how to execute with the right money management.
Also, here is a surprise.
Not all setups are created equal.
There are three types of trades with trading.
Whether you’re trading Dow Futures, EUR/USD or Gold – the setups can come in one of three ways.
HIGH Probability Trade (HPT)
This type of trade is your bread and butter.It’s when the market conditions match your system’s criteria perfectly.
It’s where you get a full on 5/5 check markets all around.
And everything screams (J.T..TT – Just Take The Trade!)
For me a HIGH PROBABILITY TRADE is when I see the following with a long (buy).
Previous trend is up.
Breakout pattern has formed
Price has broken above the pattern and opened above
The price is above BOTH the 20MA and the 200MA.
There is a strong uptrend to follow
Damn!
That’s perfect and that’s where I risk 1% to 2% of my portfolio.
But why is it high probability?
Because your trading system, which you’ve backtested and trusted, shows a high success rate in these conditions.
HIGH PROBABILITY MEANS – You know the chances of success and winning are high.Moving on…
MEDIUM Probability Trade (MPT)
The market almost lines up with your system.
It’s close but not perfect.
This is where the likelihood is still HIGH but not as high as a HPT.
This is where your indicators could be mixed or some of your criteria aren’t fully met.
Yet, you still see potential and you will still risk (less) with your trade.
This is where a bit of trader’s intuition and experience come into play.
You decide to take the trade but with a twist.You risk a little less.
For me a MEDIUM PROBABILITY TRADE is when I see the following with a long (buy).
Previous trend is sideways .
Breakout pattern has formed
Price has broken above the pattern and opened above
The price is above 20MA but below the 200MA.
There is a strong uptrend to follow.
Not great but willing to risk 0.5%.
LOW Probability Trade (NO Trade) NT
You want the perfect or almost perfect line up when you trade.
And if the criteria do not line up – it should be a NO show.
The best decision?
Stay out.No trade means no risk.
No trade means – stay neutral.
For me a LOW PROBABILITY TRADE is when I see the following with a long (buy).
Previous trend is sideways .
Breakout pattern has sizzled
Price remains in the pattern and hasn’t crossed yet.
The price is above 20MA but below the 200MA.
There is a strong uptrend to follow.
FINAL WORDS:
You need to identify when a trade looks GREAT, GOOD and BAD.
You need to know when to take a trade and what to risk during the times.
HIGH probability trade (Just Take The Trade!)
– Market lined up perfectly according to the system and can risk 1% – 2%.
MEDIUM probability trade (Trade but with less risk)
– Market almost lined up perfectly but I will still take the trade and risk 0.5%.
LOW probability trade (NO trade)
– Market did NOT line up and therefore I’m not taking a trade.

XAU/USD 4HTechnical Analysis Rising Channel with strong bullish The price action shows:
A parabolic uptrend inside a rising channel (or pitchfork structure).
Recent breakout attempt toward the upper band.
Fibonacci retracements drawn for pullback projections.
This looks like a rising channel / ascending channel with parabolic acceleration.
---
🔹 Targets
From your chart:
Immediate target shown is around 3700 USD (upper channel resistance).
If bullish momentum continues, extension targets are 3750 – 3800 USD.
---
🔹 Stop Loss
A good protective stop is below the mid-channel line, around 3400 – 3450 USD.
A tighter stop could be just under the last breakout zone: 3550 – 3580 USD (aggressive).
---
🔹 Support Levels
1. 3550 – 3580 USD → short-term support.
2. 3450 – 3480 USD → mid support (channel median + Fib zone).
3. 3300 – 3350 USD → strong support (Fib + previous base).
---
🔹 Resistance Levels
1. 3700 – 3720 USD (current key resistance).
2. 3800 USD (upper channel / Fib extension).
3. 4000 USD psychological level (long-term projection).
---
✅ Suggested Trading Plan (swing perspective):
Entry: On dips near 3550–3600 USD or breakout above 3700 USD.
Target: 3720 → 3800 USD.
Stop Loss: Below 3450 USD (swing safe) or 3580 USD (tight).

XAUUSD Target is 3580Gold has formed a wide trading range and 3580 was the end of the second leg and there is a trap that Mr. Albrooks calls the second leg trap.

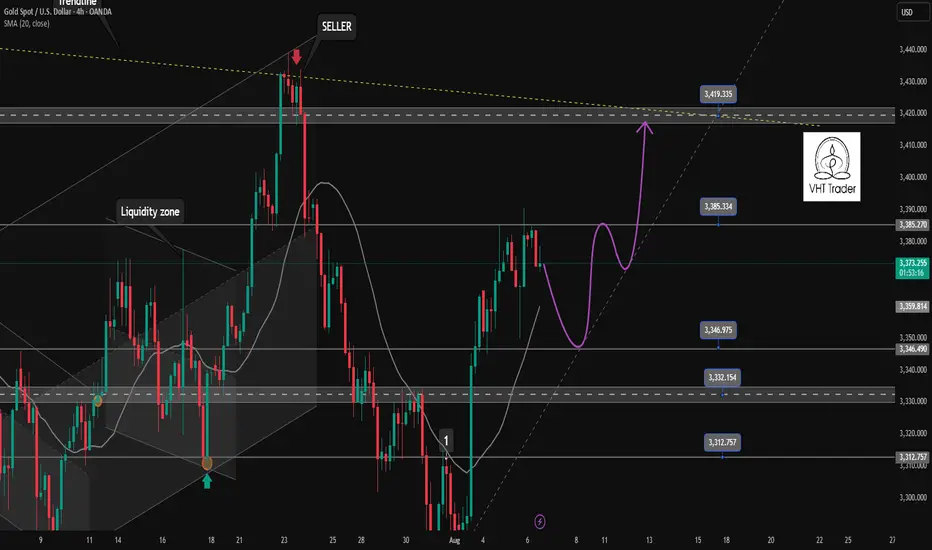
Correction in Tokyo, London session. And return go up in NewYork✏️Gold prices saw some selling pressure in the Tokyo session. Yesterday's US session saw strong buying pressure, leading to a psychological profit-taking session early today. The possibility of a correction in the Asian and European sessions today and the buying pressure will return in the London session. The SELL signal is triggered at the moment and the Target is aimed at the reaction of buyers at the support areas for the BUY strategy.
📉 Key Levels
SELL now 3375 (Scalping)
BUY trigger: Price rejection at the support areas 3346-3333-3315
Target 3420
Leave your comments on the idea. I am happy to read your views.
HH HL intact.FLYNG Closed at 50.80 (25-05-2025)
HH HL intact.
No Bearish Divergence yet on bigger tf.
54- 56 is the resistance for now.
If this level is crossed with Good Volumes,
we may witness further New Highs around 60+
On the flip side, 49 - 49.50 & then 47 - 47.50
may act as Good Support Levels.
However, breaking 45 will bring more Selling Pressure
towards 42 - 44

GOLD WEEKLY CHART MID/LONG TERM ROUTE MAPHey Everyone,
Here’s our latest weekly chart update. Once again, the Goldturn Channel continues to prove its reliability, with price action unfolding just as anticipated.
Last week, we noted multiple failed attempts to break above the channel top, each confirmed by the EMA5 being unable to close through resistance. This led to a pullback as low as 3189, nearly touching the 3094 level right near the channel's half line, a key support zone we've been closely monitoring.
We caught an early bounce off that half line, supported by confluence on our 1H and 4H setups, and that momentum has carried through into this week.
This week, we saw that bounce continue firmly off the half line, pushing price back up toward the channel top. Price has now closed above both the 3281 axis and the channel top, confirming a strong breakout and leaving an open gap toward 3387. This move not only validates our strategy but also reinforces the strength of the Goldturn system in capturing high probability swings.
As long as price remains above the channel half-line and especially now above 3281, we will continue looking for dip buying opportunities on retracements, using our intraday levels for targeted 20–40 pip moves. If the price pulls back below these key levels, we’ll reassess for potential downside toward the lower boundary of the channel.
This is exactly why we stick with our Goldturn Channel methodology our proprietary system based on weighted averages. It cuts through the market noise, distinguishes real breakouts from fake outs, and empowers us to trade with confidence and clarity.
Thanks again for your continued support, your likes, comments, and follows mean a lot.
MR GOLD
GOLDVIEWFX

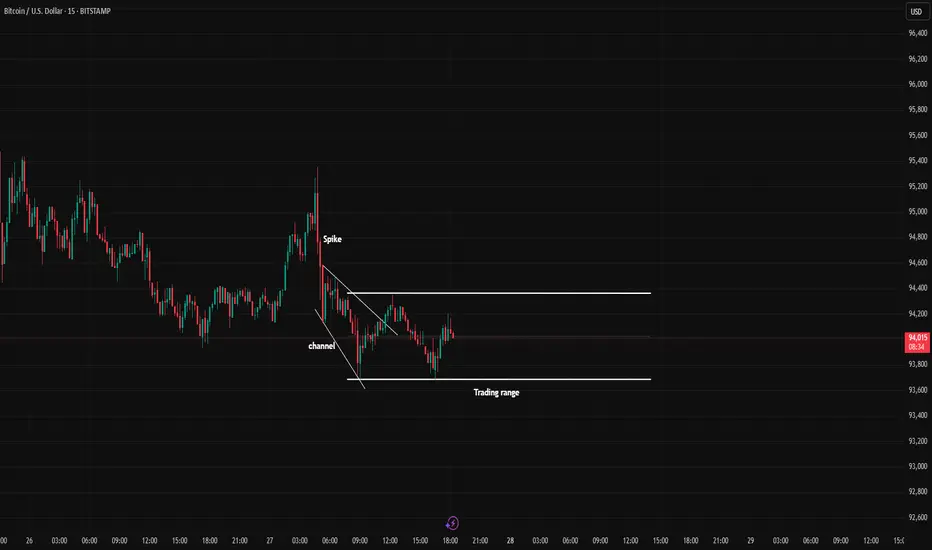
BTC cycleIn the 5-minute timeframe, you can sell at the top of the trading range and buy at the bottom of the trading range (by observing reversal candles and patterns).
Alternatively, you can wait for a breakout and enter in the direction of the breakout.
Be mindful of fake breakouts
Us30 Upward or downward?In the 5-minute timeframe, you can sell at the top of the trading range and buy at the bottom of the trading range (by observing reversal candles and patterns).
Alternatively, you can wait for a breakout and enter in the direction of the breakout.
Be mindful of fake breakouts

INTC 20 Mar 2025 Analysis
INTC remains in a 158-day trading range (yellow box).
Attempt to breakout above the trading range on 18-Feb lacked follow-through buying and failed.
The recent strong move up to the March 18 high looks like a Buy Vacuum and bull leg within a trading range.
To see the definition of a Buy Vacuum, see the comment section on the tagged related post on the 20 Mar SPX analysis.
For now, because the market remains in a trading range, traders will BLSH (Buy Low, Sell High).
That means buying from around the lower third and selling in the upper third of the trading range.
Traders will continue to do this until there is a breakout from either direction with follow-through buying/selling.

AUD/USD Forex Analysis – Trading Update for March 2025The AUD/USD pair has been exhibiting interesting price action over the past week. Following a strong bullish movement that took place on March 4th, 2025, the pair has entered a wedge formation. This bullish push was triggered by the announcement of tariffs, effective starting on March 3rd, 2025.
Key Price Action:
The high of the bullish move was marked at 0.63640, after which the price retraced to test a previous key support level at 0.62730. This level proved to be significant, as it was tested five separate times.
During the retest, the market formed lower lows and lower highs, indicating a shift in market structure. To visualize this, a bearish trendline was drawn, capturing the declining momentum.
Break and Retest:
The move we were anticipating was a break of the bearish trendline, followed by a retest of this trendline. This occurred on March 13-14, 2025, confirming the bearish structure.
After this retest, the weekly close showed a bullish push back to the 1-hour previous high at 0.63286, indicating some bullish interest around this price level.
Current Market Structure:
The pair is now trading within a defined range:
Low: 0.62582
High: 0.63288
We are monitoring the 0.63000 level closely, as it is a critical point of interest. A breakout above or below one of the boundaries of this range will provide further confirmation on the pair's next move.
Next Steps:
If the market respects the 0.63000 level and remains within the range, we will continue to observe price action for any further setups. A break above 0.63288 or below 0.62582 will offer more clarity on the pair’s next directional move.

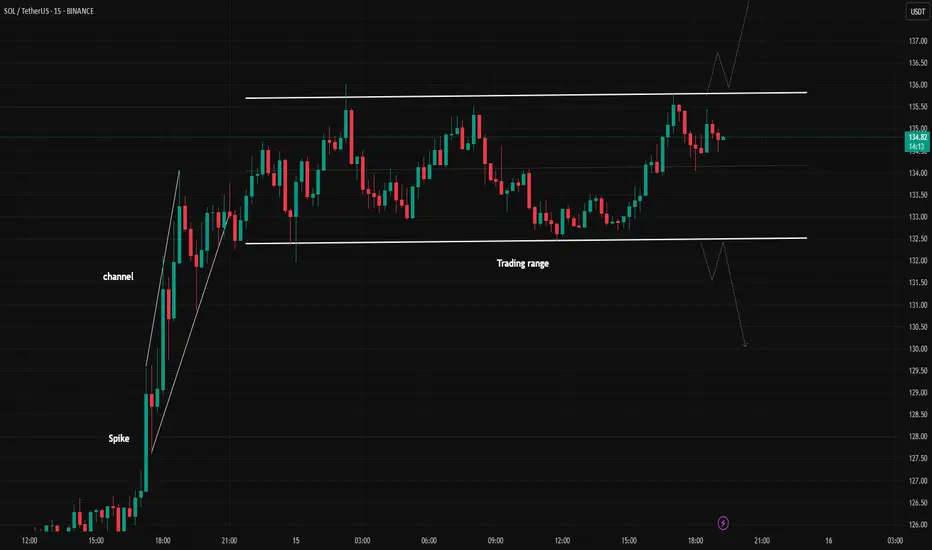
SOLUSDT Upward or downward?Hello,
In the 5-minute timeframe, you can sell at the top of the trading range and buy at the bottom of the trading range (by observing reversal candles and patterns).
Alternatively, you can wait for a breakout and enter in the direction of the breakout.
Be mindful of fake breakouts.
May your trades be profitable!
Gold in a tradingranget seems that gold has entered a tradingrange and is not breaking out for now.
Switch to the 5-minute timeframe; you can enter a trade when you spot reversal candles at the top and bottom of the trading range.
There is a high probability of the channel extending.
Good luck!

A dirty rangetrading!!!A dirty tradingrange!!!
Lower highs are visible on the chart.
There is a possibility that the tradingrange may break downward with a strong candle.
Or will the price rise to the top of the tradingrange?
Share your thoughts in the comments.

gold still is in trading range and we should BLSHI mean buy at low of trading range and sell at high of trading range

When you're Dancing on the ceiling; Short then LongWe recently broke-out of a trading range, to the Upside. Short now for Temporary Profits, or, Wait for the price to follow the grey line I drew in illustrating the likely Anticipated move. Buy long, at-or-near the Pullback (top Dashed line).
Should go (up) Down Upppp!
For your added Confidence, i recommend Waiting for a Bullish Candle After the retest to Pullback Level; you Want to See a Green candle after touching that Dashed line.

SPX SPY Trading Range or BO? Daily Chart Analysis - 5 Mar 2025
• The market traded lower earlier in the day. The market then reversed higher for most of the day around noon time. The SPX then pulled back off its high in the final 30 minutes of the day.
• The bulls see the market trading in a broad bull channel and want the move to continue for months. They want an endless pullback bull trend.
• They want a retest of the all-time high (Dec 6) followed by a breakout and trend resumption. They see the current move as a bull leg within the trading range.
• They want a reversal from a double bottom bull flag (Jan 13 and Mar 4) and a wedge (Feb 25, Feb 28, and Mar 4).
• They hope the bottom of the 22-week trading range will act as support. They want a failed breakout below the January 13 low.
• At the least, they want a retest of the middle of the trading range (around the 20-day EMA).
• If the market trades lower, they want the November 4 or October 3 low to act as support.
• The bears got a reversal from a higher high major trend reversal, a wedge top (Dec 6, Jan 24, and Feb 19), and a smaller double top (Jan 24 and Feb 19).
• They see the market as being in a 22-week trading range.
• They hope to get a bear leg to retest the January 13 low followed by a breakout below. They got it yesterday (Mar 4).
• Next, the bears want a breakout below the January 13 low, followed by a measured move based on the height of the 22-week trading range.
• If the market trades higher, they want the bear trend line or the 20-day EMA to act as resistance.
• They want at least a small second leg sideways to down to retest the March 4 low.
• So far, the market is trading in a 22-week trading range.
• The SPX broke below the January 13 low yesterday (Mar 4) and traders want to see if there are any follow-through selling.
• Or will the market form a pullback, followed by a second leg sideways to down to retest the March 4 low after that?
• Traders may BLSH (Buy Low, Sell High) within the trading range until there is a breakout from either direction with follow-through buying/selling.
• The bears must create a strong breakout below the January 13 low with follow-through selling to convince traders a breakout could be underway.

Bullish Breakout for Sonic – Ideal Entry Levels to Watch!SET:SONIC (previously FTM) has broken above $0.733, confirming bullish momentum. However, a short-term pullback toward $0.645 - $0.618 could offer a better entry before the next move higher.
If support holds, the price may target $0.85 - $1.00, while a drop below $0.55 could weaken the bullish outlook. Patience is key for an optimal risk-reward setup.


ALPHAOFSOL/USDT NEW INCREASE VOLUMEALPHAOFSOLUSDT can show na ew volume increase in the coming time frames.

bch range"🌟 Welcome to Golden Candle! 🌟
We're a team of 📈 passionate traders 📉 who love sharing our 🔍 technical analysis insights 🔎 with the TradingView community. 🌎
Our goal is to provide 💡 valuable perspectives 💡 on market trends and patterns, but 🚫 please note that our analyses are not intended as buy or sell recommendations. 🚫
Instead, they reflect our own 💭 personal attitudes and thoughts. 💭
Follow along and 📚 learn 📚 from our analyses! 📊💡"

GOLD WEEKLY CHART MID/LONG TERM ROUTE MAPHey Everyone,
Please see update on the weekly chart idea we have been tracking for over a month now and still playing out, as analysed.
Previously we stated that the channel top was continuing to provide support like we stated for the past few weeks and. as long as we see no ema5 cross and lock below into the channel, we can safely continue with our plans to buy dips in this range.
- This is continuing to play out perfectly. You can see although we had many breaks into the channel with candle over the last few weeks, ema5 failed to break inside, confirming the rejection and providing support above the channel like we stated.
Last week we stated that the bounce from the channel was playing out, as analysed and now heading towards our 2729 AXIS gap target above.
- This was hit perfectly completing this target. We now have a candle body close above 2729 opening long range/term gap at 2856 and will need ema5 lock to further confirm this.
This is the beauty of our channels, which we draw in our unique way, using averages rather than price. This enables us to identify fake-outs and breakouts clearly, as minimal noise in the way our channels are drawn.
Thank you all for your likes, comments and follows, we really appreciate it!
Mr Gold
GoldViewFX

eth midterm range"🌟 Welcome to Golden Candle! 🌟
We're a team of 📈 passionate traders 📉 who love sharing our 🔍 technical analysis insights 🔎 with the TradingView community. 🌎
Our goal is to provide 💡 valuable perspectives 💡 on market trends and patterns, but 🚫 please note that our analyses are not intended as buy or sell recommendations. 🚫
Instead, they reflect our own 💭 personal attitudes and thoughts. 💭
Follow along and 📚 learn 📚 from our analyses! 📊💡"
