This Is Not a Breakout Yet — Gold Is Quietly Loading the MoveOANDA:XAUUSD 1H Technical Analysis
Market Structure
Gold is no longer trending impulsively. Price has transitioned into a clear accumulation → sideways expansion phase right below the old ATH.
What matters here is behavior, not direction.
- Strong impulsive leg already completed
- Price failed to immediately break higher
- Market shifted into range compression instead of reversal
This confirms buyers are still in control, but they are absorbing supply rather than chasing price.
Key Zones on the Chart
Upper Range / Pre-ATH Supply: ~4,350 – 4,380
- Sideway Zone (Value Area): Mid-range where price is rotating
- Accumulation Base: ~4,260 – 4,280 (range low / demand pocket)
Price continues to respect the range boundaries:
- Highs are capped → liquidity building above
- Lows are defended → no breakdown structure
This is balanced price action, not weakness.
Price Action Logic
Inside the box:
- Overlapping candles
- Repeated up/down rotations
- No follow-through selling
This is time-based correction, not price-based correction.
Markets often do this before expanding through major highs.
Scenarios Ahead
Primary (Higher Probability):
- Continued oscillation inside the range
- Liquidity builds on both sides
- Expansion → break above old ATH
Alternate:
- Sweep lower range once more
- Immediate reclaim
- Same upside continuation
A clean break below the accumulation base would be the only structure failure — and that has not happened.
Bottom Line
Gold is not stalling.
It is compressing energy inside value.
When this range resolves, it will not be subtle.
Tradingsetup

Bitcoin Is Setting a Trap Before the Next ExplosionBitcoin 1H Market Analysis — Liquidity Trap & Expansion Setup
1. Current Market Structure
- Bitcoin is currently trading inside a corrective bearish structure following the previous impulsive move up.
- Price formed a sequence of lower highs, capped by a descending trendline, confirming short-term selling pressure.
However, the most recent drop failed to continue lower and instead produced a strong bullish reaction from the demand zone, signaling potential exhaustion of sellers.
This indicates the market is transitioning from distribution → accumulation on the 1H timeframe.
2. Key Liquidity & Zones
Major Resistance Zone: 90,500 – 90,700
→ Previous supply + trendline confluence
Demand Zone: 87,700 – 88,000
→ Strong buying reaction, liquidity sweep completed
Liquidity Sweep:
The sharp sell-off into demand flushed late longs and trapped breakout sellers, allowing smart money to accumulate at discounted prices.
This is a classic liquidity grab below structure before reversal.
3. Market Scenario (Primary Outlook)
🔼 Bullish Scenario – Preferred
Based on current price behavior:
- Price is likely to retest the descending trendline
- A successful reclaim above 89,300 – 89,600 would confirm a bullish structure shift
- After a shallow pullback, BTC can expand toward:
TP1: 90,500
TP2: 92,000+
Extended Target: 93,500 (range high)
This matches the projected path drawn on your chart.
4. Market Psychology
- Retail traders are reacting emotionally to the sharp drop, assuming continuation lower.
- Smart money used the sell-off to absorb liquidity inside demand.
- The strong bounce shows buyers are in control below 88K.
- This environment favors patience and confirmation, not chasing breakouts blindly.
The market is setting a trap for late sellers before expansion.
5. Trading Guidance
❌ Avoid selling inside the demand zone
✅ Focus on:
- Buy setups after trendline reclaim
- Pullbacks holding above 88,500
- Break-and-retest confirmations
- Risk management is critical — volatility expansion is likely once price leaves this compression.
Summary
Bitcoin has completed a liquidity sweep into demand and is showing early signs of a trend reversal on the 1H timeframe.
As long as price holds above the demand zone, the bias remains bullish toward higher liquidity and resistance targets.
This is not a random bounce it is structured price behavior driven by liquidity and positioning.

GOLD UPDATE📈 GOLD UPDATE — Levels on Watch!
Gold is reacting around a key price zone, and this move could get interesting from here 👀✨
🔓 Entry Level: 4,291
❌ Stop Loss: 4,248
🎯 Target: 4,320
Market momentum is being closely watched at this level. A sustained move could open the way toward the target zone.
What’s your view on Gold from here?
Bullish or bearish?
Share your thoughts below — let’s get a discussion going! ⬇️💬
Your support helps this reach more traders 👍
Disclaimer: This is not financial advice; it reflects only my personal market analysis. Please do your own research before trading.

Building Bias and Narrative in Trading (HTF-LTF)Bias is built top-down. The visuals make this clear. Higher timeframes define the environment. Lower timeframes refine execution. Mixing the two leads to impatience and overtrading.
Start with the high timeframe. Weekly and daily charts carry the highest impact on decision-making. They move slowly, but they define direction, value, and market regime. This is where patience matters most. If the higher timeframe is trending, your bias follows that direction. If it is ranging or transitioning, expectations on lower timeframes must be adjusted accordingly.
The first chart illustrates this trade-off clearly. As timeframes get lower, the impact of patience decreases while the risk of overtrading increases. This is why bias must be anchored higher. Lower timeframes react faster, but they lack authority without higher-timeframe alignment.
Once the environment is defined, map key levels on the higher timeframe. Major highs and lows, clear support and resistance, and obvious liquidity zones form the backbone of your narrative. These levels explain where market participants are positioned and where reactions are most likely to occur. Without them, lower-timeframe signals lose meaning.
Next, use momentum and structure to validate the story. Strong impulsive moves on higher timeframes confirm control. Weak follow-through or overlapping candles signal uncertainty. Momentum should support the directional bias defined earlier. If it does not, the narrative weakens.
Only then does the lower timeframe come into play. The second visual shows how the same market prints very different candles depending on timeframe. Weekly and daily charts compress noise into structure. Fifteen-minute and five-minute charts expand that structure into execution detail. Entries belong here, but only in the direction already defined.
The final table ties this together by trader type.
Long-term traders define trend on weekly charts and execute on daily.
Swing traders frame direction on daily and refine entries on four-hour.
Short-term traders align with four-hour structure and execute on hourly.
Scalpers still require hourly context before acting on fifteen-minute charts.
Bias is not prediction. It is alignment. The narrative flows from high timeframe context to low timeframe execution. When you respect this sequence, trades become selective, risk becomes clearer, and execution becomes calmer. The chart stops feeling random because you are reading it as a story, not reacting to each line.

USOIL UPDATE📊 USOIL UPDATE — Key Levels in Focus! 🔥
Price is testing an important zone, and traders are closely watching for the next move. Momentum around these levels could indicate short-term strength or weakness in the market.
🔓 Entry Level: 57.48
❌ Stop Loss: 56.91
🎯 Target: 58.03
Keep an eye on how price reacts here — structured levels like these help spot potential opportunities while managing risk effectively.
💬 What’s your outlook on USOIL?
Bullish or bearish? Share your thoughts below and join the discussion! ⬇️
Your engagement helps this post reach more traders and boosts visibility on feeds 👍
Disclaimer: This post is for educational and informational purposes only. It reflects personal chart observation and is not financial advice. Please do your own research before trading.

US30 UPDATE📈 US30 UPDATE — Levels on Watch!
Price is reacting around an important zone, and this setup could get interesting from here 👀🔥
🔓 Entry Level: 48,467
❌ Stop Loss: 48,174
🎯 Target: 48,727
Market reaction at this level will be key. If momentum builds, price may extend toward the target zone, while risk remains defined below the stop.
What’s your take on US30 from here?
Bullish or bearish?
Share your thoughts below — let’s get a discussion going! ⬇️💬🔥
Your like/support helps this reach more traders 👍
Disclaimer: This is not financial advice; it reflects only my personal market analysis. Please do your own research before trading.

XAU/USD Technical Analysis: Breakout & Bullish Target Senario📈 XAU/USD (Gold) 30M Technical Analysis: Breakout & Two Key Scenarios
📌 Summary of Current Setup
The XAU/USD pair has recently shown a clear break to the upside out of a well-defined short-term consolidation pattern, suggesting a bullish shift in immediate momentum. The price is currently resting right at the top of a crucial short-term resistance level, which is being tested by a high-momentum candlestick.
📝 Detailed Analysis
1. Consolidation Breakout
Previous Pattern: The chart highlights a period of sideways movement within a downward-sloping channel (or bullish flag/pennant in a larger context, though locally defined as a channel). This channel, visible from the late hours of the previous day into the current day's trading, represented a period of accumulation/distribution.
The Break: Price has successfully broken above the upper boundary of this consolidation channel/zone around the 4,275 - 4,280 area. This breakout is a significant bullish signal, indicating that buyers have overpowered sellers at this stage.
2. Key Price Levels & Zones
Current Price Action: The price is trading right around 4,288.49 (Ask), positioned above the previous structure.
Mixed IFC Candle: The chart points to a "Mixed IFC Candle" (likely referring to an Institutional Flow Candle or a candle indicating indecision after a move). This candle, placed near 4,290.00, suggests a momentary pause or a minor struggle at the immediate resistance before the potential move higher.
Central Zone (Resistance/Target 1): The first major resistance area, marked as the "Central Zone," is identified roughly between 4,303.00 and 4,308.00. This zone is crucial as a near-term target for buyers and a potential turning point for a bearish reversal if the rally loses steam.
Target (Target 2): The ultimate bullish target for this specific setup is clearly marked around 4,335.00.
🔭 Two Potential Scenarios (Conditions)
The analysis correctly outlines two primary paths based on how the price interacts with the immediate resistance near 4,290.00 and the Central Zone.
Scenario 1: Bullish Continuation (Condition 1 - Preferred Path)
Trigger: Price manages to close decisively above the Central Zone (4,308.00) or successfully tests the immediate support/retest zone and pushes through the Central Zone without a deep pullback.
Action: This confirms strong bullish momentum and targets the ultimate price objective.
Target: 4,335.00 (Potential extension towards 4,340.00)
Invalidation: A decisive break and close below the recent breakout level (around 4,275.00).
Scenario 2: Short-Term Pullback/Retracement (Condition 2)
Trigger: The price rejects the immediate resistance near 4,290.00 or, more likely, rejects the Central Zone (4,303.00 - 4,308.00).
Action: A pullback towards the recently broken consolidation channel's upper boundary for a retest of support (the breakout level) is expected.
Retest Zone: A likely retest area would be near 4,275.00 - 4,280.00. A successful defense of this retest zone would re-establish Scenario 1.
Risk: If the retest fails and price drops back into the consolidation channel, the bullish bias is temporarily negated, and the pair may revisit the lower end of the previous range.
💡 Trader's Mindset & Strategy
Entry Strategy: Look for entries on a successful breakout above the Central Zone (4,308.00) or, more conservatively, look for a confirmation of support holding during the anticipated retest (Scenario 2) near 4,275.00.
Risk Management: A stop-loss should be placed logically below the established breakout level (e.g., below 4,270.00) to protect against a false breakout.
Profit Taking: Partial profits can be taken at the Central Zone (4,303.00 - 4,308.00), with the remainder targeting 4,335.00.

GOLD 1H CHART ROUTE MAP UPDATE & TRADING PLAN FOR THE WEEKHey Everyone,
Please see our 1h chart levels and targets for the coming week, which is still active and in play.
We are seeing price play between two weighted levels with a gap above at 4221 and a gap below at 4169, as support. We will need to see ema5 cross and lock on either weighted level to determine the next range.
We will see levels tested side by side until one of the weighted levels break and lock to confirm direction for the next range.
We will keep the above in mind when taking buys from dips. Our updated levels and weighted levels will allow us to track the movement down and then catch bounces up.
We will continue to buy dips using our support levels taking 20 to 40 pips. As stated before each of our level structures give 20 to 40 pip bounces, which is enough for a nice entry and exit. If you back test the levels we shared every week for the past 24 months, you can see how effectively they were used to trade with or against short/mid term swings and trends.
The swing range give bigger bounces then our weighted levels that's the difference between weighted levels and swing ranges.
BULLISH TARGET
4221
EMA5 CROSS AND LOCK ABOVE 4221 WILL OPEN THE FOLLOWING BULLISH TARGETS
4250
EMA5 CROSS AND LOCK ABOVE 4250 WILL OPEN THE FOLLOWING BULLISH TARGETS
4284
EMA5 CROSS AND LOCK ABOVE 4284 WILL OPEN THE FOLLOWING BULLISH TARGETS
4320
EMA5 CROSS AND LOCK ABOVE 4320 WILL OPEN THE FOLLOWING BULLISH TARGETS
4361
BEARISH TARGETS
4169
EMA5 CROSS AND LOCK BELOW 4169 WILL OPEN THE SWING RANGE
4130
4093
EMA5 CROSS AND LOCK BELOW 4093 WILL OPEN THE SECONDARY SWING RANGE
4049
4015
As always, we will keep you all updated with regular updates throughout the week and how we manage the active ideas and setups. Thank you all for your likes, comments and follows, we really appreciate it!
Mr Gold
GoldViewFX

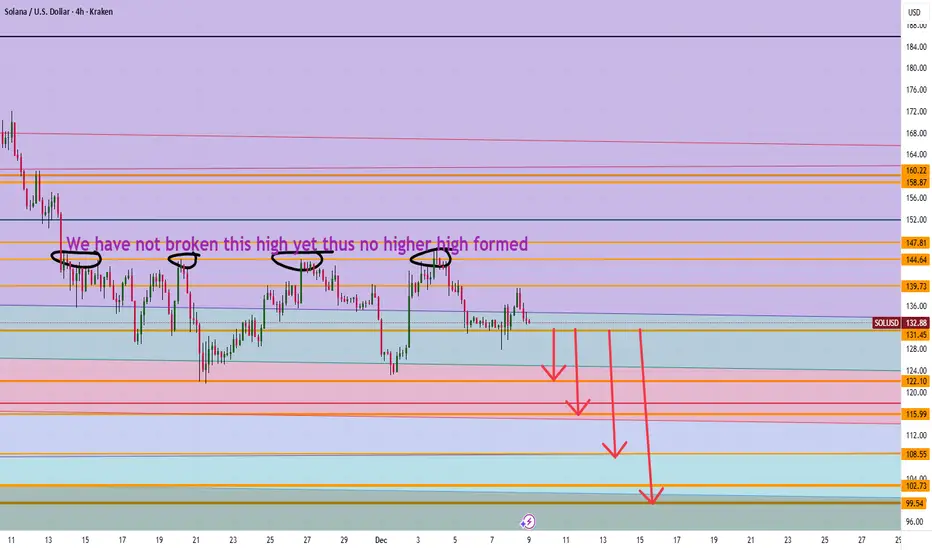
Is Solana heading to $100 It appears we have not made new higher highs in price action on the 4 hour and thus a possible movement down to $108 then 100 levels make sense. However if we can break 139 level then 147 can make sense going up.
Trade Smarter Live Better
Kris
THE KOG REPORTTHE KOG REPORT:
In last week’s KOG Report we said we would look for the price to tap into the lower level where we wanted a bounce to then target the red box above. We managed to get that long into the defence level for it to give us a nice tap and bounce again giving the short and following the path into the lower defence box. It’s here that we faced the range but as you can see we failed to breach the box, hence giving us that opportunity to target that long into the active defence above again.
We then mentioned we would protect and manage and see if there is another reaction or breach at that box, leading to price rejecting again following the range and completing all our targets as well as the hot spots for the week.
A successful week in Camelot not only on Gold but also the other pairs we trade and analyse.
So, what can we expect in the week ahead?
For the start of the trading week we have two key levels to keep an eye on, 4175 support and 4210 resistance. These are the levels that need to be broken either side in order to make the next move, and could be the range we play for Monday as there is no economical catalyst to bring the extra volume into the market.
For that reason, we’ll stick with the plan from last week, apart from looking for price to create that higher high before attempting the lower defence level.
There is strong support here on the close so if we can get an undercut low here we can bounce into that 4210 level and above that 4220 which is the level that will need to hold! As long as we can stay below, we should see price attempt the lower levels initially starting with our target level 4180 and below that 4155.
As you can see on our chart, our ideal long opportunity comes from the lower level which is also our potential target and a region we would like to see a RIP!
The levels are on the chart as our the red boxes which have proven to be effective for swing and intra-day trading.
RED BOXES:
Break above 4210 for 4220, 4230, 4235 and 4240 in extension of the move
Break below 4190 for 4180, 4173, 4165, 4155 and 4147 in extension of the move
Please do support us by hitting the like button, leaving a comment, and giving us a follow. We’ve been doing this for a long time now providing traders with in-depth free analysis on Gold, so your likes and comments are very much appreciated.
As always, trade safe.
KOG

I don't own enough!I don't own enough of NYSE:ZETA even with my massive 15-20% holding across my investment portfolios and leaps galore.
The fundamentals scream buy anything under $25-$30, while the stock sits at sub-$20.
P/S less than 3, DCF model spitting out massive Margin of Safety based on conservative projections, and they are about to report their first GAAP profitable quarter.
Never mind the chart that looks ready to have a blow-off top moment, friends absolutely.
Cup and Handle is ready to send us to new ATHs in 2026, from the looks of it.
This is a top-2 position for me, and I've personally met and interviewed the CEO, but I have no ties to the business beyond being a retail shareholder.
So take what I say as you may, and always DYOR, friends.
Not Financial Advice.
God bless!

XAUUSD Bullish Reversal Setup – Breakout Target AheadGold (XAUUSD) is currently reacting from a major intraday support zone after a sharp correction. Price has tapped into the lower liquidity area and is showing early signs of potential bullish reversal.
🔶 Key Levels & Structure
Strong Support Zone: Price is testing a major demand area where previous bullish moves originated.
Breakout Zone: A minor breakout is expected once price breaks above the short-term resistance structure.
Strong Resistance: A bigger bearish liquidity block sits below, but the market is currently respecting the upper demand.
Breakout Target: If bulls gain momentum, price could push toward the 4165–4175 supply area.
📈 Bullish Scenario
If price holds above the current support and breaks the short-term structural high, we may see a clean bullish continuation toward the upper breakout target zone.
📉 Bearish Scenario
Failing to hold current support could drag price back down into the lower liquidity pools before any strong reversal attempt.
📝 Overall Outlook
Market structure favors a bullish recovery, but confirmation is required through a clear breakout of short-term resistance. Traders should wait for strong candle closures to avoid false moves.
🔥 Title Suggestions
Gold Ready for a Bullish Breakout from Key Support
XAUUSD Reversal Setup – Watching the Breakout Levels
Gold Analysis: Strong Support Holding, Breakout Target Ahead
XAUUSD Bulls Preparing for Next Rally

BTCUSD | short ideaLooking for bitcoin to get into this zone and make a move downwards. I don't think this downtrend is over just yet.
Let me know what you think!
Stay safe out there and do your own due diligence, this is not investment advise!

GBPAUD | Long ideaGBPAUD tested this support level at 2.026. Looking for a retest here and a move to the upside.
GBPAUD has been climbing up the past month which is part of my bullish bias.
Let me know what you think!
Stay safe out there and do your own due diligence, this is not investment advise!

GBP/USD — Bearish Outlook Toward 1.26867GBP/USD remains under sustained bearish pressure after failing to hold above the key structural levels at 1.34825 and 1.33906. These two resistance zones now define the upper boundary of the broader downtrend, confirming that sellers remain in control.
Price is currently moving within a corrective phase, and any recovery attempt below these key levels is expected to face renewed selling interest. The bearish continuation scenario remains valid as long as the pair stays capped below 1.33906.
The next major objective for bears is the downside target at 1.26867, corresponding to the 1.0 Fibonacci extension and the final completion zone of the current corrective wave.
A break below intermediate supports—1.31642, 1.30846, and 1.29907—will accelerate momentum toward the target.
Key Levels
Major Resistance: 1.34825
Secondary Resistance: 1.33906
Intermediate Supports: 1.31642 • 1.30846 (50%) • 1.29907 (0.618)
Final Downside Target: 1.26867


ES (SPX, SPY) Analysis, Levels, Setups, for Fri (Nov 14th)
Today’s session revealed a marked risk-off sentiment as the market began to discipline leading sectors, notably large-cap tech, AI, semiconductors, and high-beta growth stocks. This correction coincided with a reassessment of expectations for near-term Federal Reserve easing and an environment defined by unequal economic data in the wake of the record shutdown.
Despite the abrupt decline, the E-mini S&P 500 (ES) remains in a pullback phase within a broader uptrend, still functioning within a weekly premium and supply zone. This movement exhibits characteristics typical of a sharp correction and repositioning rather than the definitive onset of a bear market. Importantly, prices have yet to break below the last significant daily higher-low region, weekly market structure continues to show constructive signs, and the “stress indicators” monitored by institutional investors are elevated but not yet at levels indicative of a crisis.
Dashboard Context
Volatility: Implied volatility surged today, with equity volatility pushing above previously complacent levels, albeit the term structure remains predominantly upward-sloping rather than inverted. This nuance is critical; while funds are investing more for protection and short-term hedges, the volatility landscape does not yet suggest a disorderly liquidation phase.
Options Positioning: The index and overall put/call ratios have transitioned from a state of complacency to caution, reflecting increased demand for hedging. However, levels are not yet extreme enough to signal panic. Skew is elevated, indicating that investors are bidding for downside protection, although it remains within the upper bounds of a normal range. This suggests that while major institutions are leaning into protective strategies and tactical downside plays, the broader market is not universally positioned for a crash.
Breadth: The internal damage today was notable, with decliners outpacing advancers significantly across major exchanges. This shift in breadth oscillators from positive to negative in a single session points to a broad-based distribution rather than a narrow selloff concentrated in a few prominent names. Historically, such internal damage requires several sessions for a market to recover.
Credit and Funding: High-yield spreads have widened modestly from recent lows, and high-yield ETFs have pulled back from their peaks. Nevertheless, there are no current signs of a credit crisis. Spreads remain well within ranges that do not indicate severe stress, and funding markets continue to operate smoothly. Provided that credit conditions stay stable, current equity weakness is likely more reflective of a valuation and positioning reset than systemic risk.
Cross-Asset Risk: The crypto market experienced a sharp selloff, while global equity indices broadly fell. This behavior confirms a classic cross-asset risk-off scenario, as investors reduced exposure to the highest-beta, most speculative areas while simultaneously de-leveraging from U.S. equity leaders. Conversely, traditional defensive stocks and segments of quality value showed relative resilience, a behavior consistent with a managed de-risking rather than an all-encompassing liquidation.
In summary, the dashboard indicates a shift from “overbought complacency” to a higher-volatility, risk-off environment. However, we have yet to enter a full-scale, credit-driven bear market. This context is essential for interpreting today’s decline in the E-mini S&P 500.
Multi-Timeframe Technical Structure (Weekly → Daily → 4H → 1H)
Weekly: The E-mini remains in an upward trajectory, printing higher highs and higher lows. Prices have retreated from a premium zone established at recent highs. The current weekly bar suggests rejection, yet critically, price levels remain comfortably above the last key weekly higher low near the 6,000 mark. Weekly momentum, previously overstretched to the upside, is rolling over, signaling a potential cooling phase – likely a period of consolidation or corrective drift rather than immediate trend failure.
Daily: On the daily chart, the ES has formed a distinct upper range beneath a weak high. Today’s trading produced a significant red candle, indicating a drop from the upper range back toward its center. The prior swing low around 6,620–6,580 remains intact, but the daily oscillator shows mild bearish divergence relative to the last high – a common occurrence in maturing upswings. This situation conveys the message of “bullish but extended, now in corrective mode,” rather than a definitive shift to a pattern of lower highs and lower lows.
4-Hour: The 4-hour structure has entered a short-term downtrend. A lower high was established in the 6,900–6,920 range, leading to an impulsive sell-off toward demand around 6,730–6,700. This selloff exhibited characteristics of liquidation: substantial red candles, minimal counter-rotation, and strong volume. The 4-hour oscillator shows bearish pressure but is beginning to flatten near support, consistent with an early basing attempt after a sharp sell-off, though additional downside remains possible if negative overnight flows persist.
1-Hour: The 1-hour chart portrays today’s price movement as a decisive liquidation wave.
Today's market decline was driven by three converging factors.
First, we saw a mix of valuation adjustments and crowded positioning. Sectors such as AI, semiconductors, and large-cap growth stocks had experienced significant upward momentum. As a result, profit-taking and forced de-leveraging became evident, especially when the largest index components corrected. This simultaneous adjustment made it challenging for the overall index to hold its ground.
Second, the narrative surrounding interest rates and policy has shifted. Recent commentary from the Federal Reserve has adopted a more cautious tone regarding the pace and scale of future interest rate cuts. With inflation remaining above target and some data being impacted by the government shutdown, policymakers appear hesitant to endorse the market's most optimistic expectations for easing. This recalibration towards a "higher for longer" mindset is detrimental to long-duration growth equities and affects the valuations assigned to market leaders.
Third, while the government shutdown has concluded, the subsequent rhythm of the economic calendar has been disrupted. Several critical data releases have been delayed or are now under scrutiny, prompting investors to navigate through somewhat erratic information. In this context, there has been a notable reluctance to take on risk at elevated valuations without clearer data confirmation. Consequently, we are witnessing a trend of de-risking, characterized by a swift rotation from expensive stocks into cash, defensive positions, and protective strategies.
The outcome has been a pronounced selloff, exhibiting broad downside movement and a surge in volatility. Importantly, this occurred without significant turmoil in credit or funding markets, suggesting that we are dealing with a valuation reset rather than a systemic crisis.
Looking ahead, the question arises: Is this the beginning of a more substantial downtrend or merely a temporary flush? From a structural perspective, the market has yet to breach the typical thresholds that signal the onset of a major downtrend. The previous daily higher low remains in place, the weekly uptrend is still intact, and we have not observed the combination of lower highs and lower lows that would signify a broader bearish phase.
Currently, we are witnessing a rejection from a weekly premium/supply zone, with momentum weakening at both daily and weekly levels. Additionally, there is a clear lower high alongside a liquidation move visible on the four-hour chart, which aligns with the expected behavior during the early stages of a significant correction following an extended rally.
As it stands, the prevailing view is that we are experiencing a sharp corrective phase or volatility spike within the upper range of the ongoing uptrend. While the risk of a more profound correction is heightened, particularly if the support range of 6,600 to 6,535 is breached, the current indicators do not yet suggest a completed market top or a fully developed bearish trend.
A genuine trend transition would likely require:
– a decisive break of S3 and a failed retest from below;
– a sustained period of weak breadth rather than a single-day air pocket;
– and, on the macro side, a clear deterioration in credit and funding conditions alongside a persistent inversion of the equity volatility term structure.
At present, those conditions are not fully in place.
Level-KZ Execution Framework for Tomorrow
Asia/London Participation: If overnight trade pushes the ES down into the 6,710–6,680 range and subsequently prints a rejection with a definitive 15-minute close above that zone, consider it a tactical bounce location. This could target a move back toward the 6,770–6,800 region. Given the event risk, participation should be smaller than usual and approached as preparatory rather than primary risk.
PPI Window (08:30–09:15 ET): The initial 15–30 minutes post-PPI release should be regarded as a discovery phase. If the first impulse upward drives the price into R1/R2 but then closes back below 6,780–6,800 with upper wicks and a failure of the 5-minute structure, it sets up a potential short from the underside of the shelf. Targets for this short could be at 6,720 and then 6,680. Conversely, if the initial market reaction results in a drop to S2/S3 that quickly wicks back and closes above that zone on a 15-minute chart, it presents a tactical bounce long toward the 6,740–6,780 area. The decisive 15-minute close after the data release will provide clarity on which side gains control for the session.
NY AM Kill Zone (09:30–11:00 ET): For short positions, the optimal area remains a rejection from 6,780–6,815 after the PPI reaction is digested. A long upper wick and a return close within that range on a 15-minute chart, paired with a failure in the 5-minute attempts to maintain above, supports a short position. Stops should be placed just above the rejection high, with profit targets initially toward 6,720 and subsequently toward 6,680. Conversely, for long opportunities, an ideal scenario involves a constructive reaction from the 6,700–6,660 support band. This would look for a higher low on the 15-minute chart, reclaiming and holding above 6,700, while sellers falter at S1. In this case, stops would belong below the reaction low, targeting 6,770 and 6,810. Standard A-tier protocol applies: anticipate at least 2R to the first target based on a 15-minute-anchored stop, limit attempts per level, and enforce daily risk guardrails.
NY PM Window (13:30–16:00 ET): Should the ES remain constrained between 6,700 and 6,800 by early afternoon, the trade dynamic typically shifts from discovery to mean-reversion. Thus, the afternoon should primarily focus on managing existing positions from the morning rather than initiating new aggressive plays. Fresh entries based on trending strategies should only be considered if there is a clear breakout from the established intraday range, whether below S3 or above R3, accompanied by confirmation.
Big-Picture Takeaway: Fundamentally, today’s decline indicates a reassessment of overly optimistic growth and AI valuations, along with near-term Federal Reserve easing, partly prompted by a complicated post-shutdown data environment. Technically, the ES is retreating from a weekly premium into various support zones while maintaining the core bullish structure. Stress indicators favored by large professional investors—such as volatility, options positioning, breadth, credit, and cross-asset behavior—suggest a serious risk-off event has occurred, but they don't exhibit the persistent stress and credit strain typically seen before a full bear market materializes.
As long as the ES decisively holds above the 6,600–6,535 zone and doesn’t reject that area from below, the higher-probability play in the coming sessions is a volatile corrective range, offering tactical opportunities to sell rallies into resistance and buy deeper, well-defined demand zones—always bearing in mind the heightened volatility and macro event risks on the calendar.

XAU/USD Intraday Plan | Gold Stalls Below 4153 ResistanceGold is currently trading around 4118 after a strong rally from the 4027 breakout. Buyers appear to be pausing after several failed attempts to clear the 4153 resistance, with price now consolidating just above the 50MA, which is acting as short-term dynamic support.
We need confirmed break above 4153 resistance for bulls to extend the move to 4197 and possible 4234.
However, if price loses the 50MA and 4115 support, we may see a move into the pullback zone. Failure to hold the key support at 4027 may bring the First Reaction Zone back into focus.
📌Key Levels to Watch
Resistance:
4,153
4,197
4,234
4,285
Support:
4,115
4,074
4,027
3,984
🔎 Fundamental Focus:
It’s a busy day for speeches, with multiple FOMC members scheduled to speak throughout the session — comments could spark volatility across USD pairs.
Meanwhile, markets are keeping a close watch on the scheduled House vote to approve temporary government funding and reopen the U.S. government.

BTC SETUP IDEAIm waiting for price to reach the OB + FVG zone Below, if price react there, maybe another Leg up

EURJPY BUY THE TREND Will be using a buy limit to enter a buy on Eurjpy and will be keeping things simple with the trend following , very good trade and low risk higher chance to buy than sell

Long - XAUUSD Hit TP on early MondayAnother week opened, XAUUSD long position hit TP as expected. I took a buy following a strong rejection at support zine. Price closed the week with 4000 after a strong bullish candle/rejected wick, confirming a short term bullish bias and surge with a sharp move earlier this morning.

Spotting Inefficiencies in an Efficient MarketMarket Efficiency Theory;
Core Idea: Stock prices already include and reflect all available information.
Implication: It is very difficult (if not impossible) to consistently outperform the market because prices adjust quickly when new information appears.
Note: Markets are not perfectly efficient all the time — they can become inefficient in the short term due to emotions, news, or sudden events.
⚙️ Three Forms of Efficiency
Weak Form Efficiency
All past market prices and data are already reflected in current prices.
Therefore, technical analysis (chart patterns, trends) is useless because it can’t predict future prices.
Semi-Strong Form Efficiency
All public information (both technical and fundamental) is reflected in prices.
This means fundamental analysis (using financial statements, news, etc.) is also useless for gaining an edge.
Strong Form Efficiency
All information, including insider or private information, is already priced in.
So, no one can consistently outperform the market — not even insiders.
💡 Why Inefficiencies Exist
Markets aren’t perfectly efficient because human behavior and emotions often cause mispricing:
Investor emotions — Fear and greed can drive irrational buying or selling.
Market sentiment extremes — Overconfidence or panic can push prices too far.
Short-term behavioral mistakes — Herd mentality or cognitive biases lead to temporary inefficiencies.
🔍 Finding Inefficiencies
Although hard, traders can sometimes find and exploit short-lived inefficiencies:
Market sentiment indicators like VIX (volatility index) or put/call ratios signal extremes.
Seasonal trading strategies such as “Sell in May” patterns or year-end rallies.
Time arbitrage — taking advantage of short-term market overreactions.
Exploiting short squeezes when traders betting against a stock are forced to buy back.
⚠️ Difficult Markets for Traders
Some markets are naturally harder to trade efficiently:
Forex market: Highly competitive with huge volumes and professional players.
Commodities market: Often volatile and erratic due to unpredictable factors like weather, geopolitics, or demand shocks.
Conclusion:
Is it possible to find inefficiencies in the markets?
The markets are probably to a certain degree efficient, but we believe you can make good and consistent returns by using the right approach – which is to use empirical and quantified data for short-term strategies and by using common sense. Moreover, we believe the best place to start is in the stock market.
The markets are somewhat inefficient because of human folly. This is unlikely to change, which is good for the rational trader and investor. So the correct answer about inefficiencies is this: Yes, it’s possible to find inefficiencies in the markets.

Bullish Setups Emerging: Usha Martin and Alicon in Focus🔹 Usha Martin NSE:USHAMART
After months of sideways movement, the stock has formed a rounding bottom pattern.
It recently broke out and retested its support zone. If momentum continues, the stock could move higher from here. 📈
🔹 Alicon Castalloy NSE:ALICON
The stock bounced back strongly from ₹600 after a big correction from ₹1,530.
It now trades near the key resistance zone of ₹1,000–₹1,050.
Yesterday’s 13% jump with high volume shows strong buying interest. A breakout above this zone could take it closer to previous highs. 🔥
👉 Keep an eye on both — they’re showing promising setups for the next move!
