The key is whether it can rise above 17.07 ~ 32.06
Hello, fellow traders.
If you "Follow" me, you'll always get the latest information quickly.
Have a great day.
-------------------------------------
(Vale S.A. Sponsored ADR 1M Chart)
The key is whether the price can break above the Fibonacci level of 0.618 (17.07) on the left and 0.618 (32.06) on the right.
-
(1D Chart)
To do this, we need to see if the price can sustain above 15.40 and rise.
If it falls, we need to check for support around 12.72 to 14.0.
To break above a key point or level and continue the uptrend, the StochRSI, TC, and OBV indicators must show upward trends.
If possible,
1. The StochRSI indicator should not be in an overbought zone. 2. The TC indicator should remain above the 0 level.
3. The OBV indicator should remain above the High Line.
-
Thank you for reading.
I wish you successful trading.
--------------------------------------------------
Tradingstrategy

Prop Firms vs Real Accounts: The Structural Trade-Off Most TradeMost comparisons between prop firms and real accounts focus on capital size, profit splits, or challenge difficulty. What is discussed far less is how each environment reshapes the way traders think, decide, and execute. The difference is structural, and it has a direct impact on performance.
Prop firm accounts are rule-bound by design. Daily drawdown limits, maximum loss thresholds, and evaluation deadlines create a narrow operating window. These constraints reward control and consistency, but they also introduce pressure. Every trade is filtered through the question of survival. Traders become highly sensitive to short-term equity fluctuations because a single mistake can end the account.
This changes behavior in subtle ways. Traders hesitate to hold through normal drawdowns, cut winners early to protect equity, or avoid valid setups late in the day to reduce risk exposure. None of these actions are irrational. They are logical responses to the environment. The issue arises when traders confuse rule compliance with optimal execution.
Real accounts remove these external constraints. There is no forced stop at a daily loss and no expiration date. Drawdowns are uncomfortable but recoverable. This freedom allows for longer holding periods, broader trade selection, and more flexibility in execution. At the same time, it demands a higher level of internal discipline. Without rules enforced externally, risk management becomes entirely self-regulated.
Many traders perform well in one environment and struggle in the other because the skill sets are different. Prop firms reward precision, restraint, and consistency under pressure. Real accounts reward patience, emotional regulation, and long-term thinking. Success in one does not automatically translate to success in the other.
The mistake is treating prop accounts as practice for real trading without acknowledging the incentives involved. The rules shape behavior, expectations, and even strategy selection. Traders who understand this stop blaming themselves for feeling constrained or overly cautious.
Neither model is superior. Each serves a different purpose. Clarity comes from aligning your approach with the structure you are trading under, rather than forcing one mindset into the wrong environment.

GOLD (XAU/USD) – FINAL GRAND CYCLE ANALYSIS🟡 GOLD (XAU/USD) – FINAL GRAND CYCLE ANALYSIS
“The Rise of Real Money in a Failing Fiat World”
Elliott Waves | Fibonacci | Smart Money | Macro Fundamentals | Market Psychology
📅 Date: October 22, 2025
📍 Current Price: ~$4,039/oz
⏳ Time Horizon: 1970s to post-2050
🎯 Focus: Multi-decade Elliott Wave structure signaling the endgame for fiat currencies
🌐 SUPER CYCLE NARRATIVE – GOLD’S MONETARY METAMORPHOSIS
🔵 Wave I (1971–1980): The Rebirth of Real Money
Gold's first major secular rally began when the Bretton Woods system collapsed and President Nixon ended the U.S. dollar’s convertibility to gold in 1971. Gold soared from around $35 to nearly $875 by 1980. This wave was driven by runaway inflation, the oil embargo, and shattered confidence in fiat money.
🔴 Wave II (1980–1999): The Great Fiat Illusion
Following the 1980 peak, gold entered a brutal 19-year corrective phase, falling to the $250 zone. During this time, the U.S. dollar gained strength, Volcker’s interest rate hikes reined in inflation, and a new era of debt-based prosperity and stock market euphoria unfolded. Gold was dismissed, even by central banks who sold reserves. Structurally, this corrective phase formed a complex WXYXZ pattern , setting the groundwork for the massive Wave III rally.
🟢 Wave III (1999–~2033): The Fiat Reckoning Has Begun
This is the longest and most powerful supercycle wave and the one we are currently in. It is subdivided into five impulsive macro waves. As of now, gold is deep within Wave iii of III , the most explosive phase of the entire structure. The current rally is no longer driven by inflation fears but by existential doubts about the long-term viability of fiat currencies.
📈 Wave I of III (1999–2011): The Institutional Accumulation
Gold rose from around $250 to $1,920 over this period. Triggers included the dot-com bust, 9/11, the 2008 global financial crisis, and the launch of the first gold ETFs like GLD. This wave marked the beginning of institutional interest in gold as a systemic hedge.
📉 Wave II of III (2011–2015): The Disbelief Correction
Gold corrected nearly 45%, bottoming near $1,050. The narrative shifted — QE hadn't caused hyperinflation, the stock market was booming again, and faith in the dollar resurged. Retail abandoned gold, but institutional buyers quietly accumulated from newly created demand zones.
🚀 Wave iii of III (2015–~2026): The True Price Discovery Phase
This is where we are now. Since 2015, gold has exploded upward, driven by COVID-era QE, negative real interest rates, geopolitical instability, and major central banks accumulating gold for cross-border settlements outside the dollar system.
We are currently in the middle of this wave — micro wave (3) of iii — with price around $4,039. According to Fibonacci projections, this wave is expected to peak near $6,552 , corresponding to the 2.618 extension level . If bullish momentum continues, gold could overshoot toward $22,744 , matching the 3.618 Fibonacci extension and marking the likely top of macro Wave III.
In an extreme scenario where fiat trust collapses entirely, the 4.618 extension projects a possible target of $78,940 . All of these levels align with the upper bounds of the long-term logarithmic channel, validating both structure and projections. But most likely this target is for Wave V TOP .
🟣 Wave IV (Projected: 2026–2033): The Great Shakeout
After the parabolic run of Wave iii, a deep multi-year correction is likely. This correction — Wave IV — may retrace toward the long-term red trendline and could coincide with a temporary return to “faith” in fiat through reforms like CBDC rollouts or aggressive fiscal pivots.
This wave could resemble a WXY pattern or large ABC structure and may unfold alongside capital controls, deflationary pressure, and a resurgent tech or dollar narrative. However, this will likely be the last major buying opportunity before gold enters its final, euphoric revaluation.
🟢 Wave V (2033–2045+): The Final Blow-Off Top
Wave V is expected to be driven by an overt crisis of confidence in the global fiat system. Scenarios could include:
Mass adoption of gold-backed or commodity-tied digital currencies
Loss of global trust in the USD as the reserve currency
BRICS or emerging alliances introducing gold into cross-border settlements
Global central banks returning to physical gold as a monetary base
The upside potential here is monumental. The 4.618 Fibonacci extension already targets $78,940 , but under full systemic collapse or monetary reset conditions, gold could reprice toward $100,000–$250,000 per ounce — not as a bubble, but as a return to its role as sound, base-layer money.
📐 Fibonacci Milestones and Structure Alignment
Each major wave has closely respected its corresponding Fibonacci extension. Wave I topped around the 1.618 level ($1,887) . The ongoing Wave iii appears on track to reach the 2.618 level ($6,552) . From there, macro Wave III could stretch toward 3.618 ($22,744) . If Wave V extends fully, a 4.618 projection leads to $78,940 — all within the bounds of the established logarithmic trend channel. In a full-blown systemic reset, price could break even higher.
These levels are not speculative but grounded in structural alignment with Elliott wave geometry , Fibonacci mathematic s, and long-term institutional order flow .
🧠 Smart Money Concepts & Technical Validations
Smart money activity has left clear fingerprints across this cycle. Each break of market structure (in 2016, 2020, and 2023) confirmed higher time-frame bullish continuation. Institutional demand zones — especially during the 2018–2019 consolidation and 2022 pullback — were respected to the dollar.
This cycle isn’t retail-driven mania — it's a stealth institutional accumulation that’s now evolving into price discovery.
📊 Market Psychology Across the Cycle
Investor sentiment has followed classic psychology stages:
From 1999 to 2004, disbelief reigned: “Gold is dead.”
Between 2005 and 2011 came growing awareness: “Gold might work again.”
The 2011–2015 correction brought denial: “It was just a bubble.”
Hope returned in 2016–2020 as price quietly rallied.
From 2022 to 2026, euphoria dominates: “Gold will never go down.”
Wave IV will likely bring fear and capitulation between 2026 and 2033.
Finally, Wave V will ignite mania: “Gold to the moon!”
🚨 Final Synthesis: What This All Means
We are living through the largest repricing of monetary value in modern financial history. Gold is no longer just an inflation hedge — it’s becoming a hedge against the system itself . The structure on the chart doesn't just map price — it maps the collapse of fiat trust and the return of monetary sanity.
Gold is transitioning from:
A commodity hedge →
To a central bank hedge →
To a currency hedge →
And finally, to a system hedge
The current leg — Wave iii of III — is nearing its climax. After a correction in Wave IV, Wave V could take gold into previously unthinkable territory, not because gold changed — but because everything else did.
📌 Final Position Summary
We are currently in wave (5) of iii of III — the most powerful segment of the bull run
The next Fibonacci target is $6,552
The broader Wave III could peak near $22,744
After a correction (Wave IV), the final wave could send gold toward $78,940 , or even into the $100,000–$250,000 zone under extreme monetary reset conditions
This is not a mere forecast — it’s a macro-monetary blueprint for the coming decades.
🌊 "Those who understand the waves will ride them. Those who don’t will be swallowed by the tide." – FIBCOS
📘 Disclaimer: This is an educational market outlook based on technical and macroeconomic structure. It is not financial advice. Always do your own due diligence and risk management.
#XAUUSD #Gold #GoldAnalysis #ElliottWave #Fibonacci #SmartMoneyConcepts #PriceAction #TechnicalAnalysis #MarketStructure #Commodities #InflationHedge #MacroEconomics #CentralBanks #BRICS #MonetaryReset

Whale Watching 101: How to Use Exchange Inflow/Outflow DataIn the ocean of cryptocurrency, Retail Traders are the plankton, and Institutions are the Whales. When a Whale moves, the water displaces, and the plankton get pushed around. If you want to survive in 2026, you must stop swimming against the current and start tracking the Whales.
But how do you see them? They don't post their trades on Twitter. They leave On-Chain Footprints. The biggest footprint they leave is moving money in and out of Exchanges.
Today, we are mastering the most fundamental On-Chain metric: Exchange Netflow.
1. The Golden Rule of Flows
To understand this data, you must understand the psychology of a Whale. A Whale (holding 1,000+ BTC) does not keep their money on an exchange like Binance or Coinbase unless they are planning to do something.
Exchange INFLOW (The Bearish Signal)
The Logic: Why would a Whale move 5,000 BTC from a secure Cold Wallet (Ledger/Trezor) to an Exchange?
The Intent: They are likely preparing to SELL.
The Trading Signal: If you see a massive spike in "Exchange Inflow" while price is hitting a Resistance level, it is a massive warning sign. The Whales are loading their guns to dump on the retail breakout.
Exchange OUTFLOW (The Bullish Signal)
The Logic: Why would a Whale withdraw 5,000 BTC from an Exchange to a Cold Wallet?
The Intent: They have finished buying. They are removing the supply from the market to hold for the long term.
The Trading Signal: If price is dumping, but "Exchange Outflows" are hitting record highs, this is Accumulation. The Whales are buying the dip and removing the coins from circulation. This is how "Supply Shock" happens.
2. The Nuance: Stablecoins vs. Bitcoin
This is where 90% of rookie traders get it wrong. You must distinguish what is flowing in.
BTC Moving to Exchange = Sell Pressure (Bearish)
Interpretation: Supply is increasing.
Stablecoins (USDT/USDC) Moving to Exchange = Buy Power (Bullish)
Interpretation: This is "Dry Powder." When Whales move millions of USDT to an exchange, they are preparing to BUY the dip.
The "Ultimate Bull Signal": High BTC Outflows (Supply Shock) + High Stablecoin Inflows (Buying Power) = Parabolic Price Action.
3. Case Study: The "Fakeout" Trap
Let’s apply this to a real trading scenario.
The Scenario: Bitcoin is trading at $98,000. It looks bullish. Suddenly, a breakout occurs to $100,000. Retail traders start longing with 50x leverage.
The On-Chain Reality: You check the data. You see that 1 hour before the breakout, 10,000 BTC flowed INTO Coinbase Pro.
The Trade:
The Trap: The breakout is likely a "Bull Trap." The Whales moved that BTC to sell into the liquidity provided by the retail longs.
Your Move: Instead of longing the breakout, you Short the rejection, knowing that massive sell pressure is sitting on the order book.
4. Tools of the Trade
You cannot trade this without data. Here are the industry standards for 2026:
Glassnode: The gold standard for "Exchange Net Position Change" charts.
CryptoQuant: Excellent for real-time "Exchange Inflow" alerts.
Whale Alert (Twitter/X): Good for spotting individual massive transactions, but be careful—sometimes these are just internal transfers (exchange wallet to exchange wallet). Always verify if it is an actual inflow.
Conclusion: Context is King
Exchange flows are powerful, but they are not a crystal ball.
Low Volatility + Inflows = Preparing for a big move (likely down).
High Volatility + Inflows = Panic selling (Capitulation).
Use Fundamental Analysis to see Where the money is going, and Technical Analysis to time When to enter.
Stop guessing. Start tracking.
-Tuffycalls (Team Mubite)

Check for support near 29.20
Hello, fellow traders!
Follow us to get the latest information quickly.
Have a great day!
-------------------------------------
(CMCSA 12M chart)
CMCSA is located near key support and resistance levels.
If it falls below 27.78, it could fall to around 12.90. Therefore, to sustain the uptrend, it must find support near 27.78.
-
(1D chart)
Since the price is below the M-Signal indicator on the 1M chart, the top priority is to see if it can rise above the M-Signal indicator and maintain its upward momentum.
To achieve this, it must find support at three support and resistance levels and then rise.
The three support and resistance levels are:
29.20,
27.78 ~ 28.03, and
26.65.
Since a volume profile zone has formed at 26.65, the area around 26.65 is the most important support and resistance point among the three support and resistance levels.
However, if the price declines from 29.20 or 27.78 to 28.03, there's a high possibility of strong selling pressure, so caution is advised when trading.
A full-blown uptrend is likely to begin with an upward breakout above 35.09.
To ensure this, check for upward trends in the StochRSI, TC, and OBV indicators.
-
Thank you for reading to the end.
I wish you successful trading.
--------------------------------------------------

Example of How to Check Support
Hello, fellow traders.
By "Following," you'll always get the latest information quickly.
Have a great day.
-------------------------------------
How can we confirm that the price is supported at support and resistance levels?
While support can be determined over time, it's not always easy to tell when support is being tested.
The indicators we focus on are the HA-Low and HA-High indicators.
Then, in combination with the DOM(-60) and DOM(60) indicators, we identify low and high ranges and respond based on whether they are supported.
In other words, we can use the basic trading strategy of buying if support is found in the DOM(-60) to HA-Low range, and selling if resistance is found in the HA-High to DOM(60) range.
-
The current price is located near the DOM(-60) ~ HA-Low range.
The DOM(-60) indicator has been maintained since its creation.
Therefore, we can see that support is currently being tested near the DOM(-60) ~ HA-Low range.
So, how can we determine if support is found and an upward trend is possible?
This can be predicted by observing the movements of the OBV, StochRSI, and TC indicators.
Since the current price is located near the HA-Low indicator, for the HA-Low indicator to support the price and move upward, the StochRSI, TC, and OBV indicators must be trending upward.
If possible,
1. The StochRSI indicator should not have entered the overbought zone.
2. The TC indicator should remain above zero.
3. The OBV indicator should remain above the High Line.
Applying the above conditions, we can see that support is still present and the likelihood of an upward trend is low.
Even under these conditions, if the price remains near the DOM(-60) ~ HA-Low range, we can say that support is present.
-
To examine the situation in more detail, let's examine the movement on the 15m chart.
To determine whether support exists near the HA-Low indicator point on the 1D chart, I've marked the HA-Low indicator point on the 1D chart.
The DOM(-60) and HA-Low indicators are generated on the 15m chart, and the upward movement is testing support as it meets the DOM(60) indicator.
Therefore, even if the price declines from the HA-Low indicator point (87944.84) on the 1D chart, if it maintains around the DOM (-60) ~ HA-Low range on the 15m chart, it will likely attempt to rise again.
To achieve this, as mentioned earlier, we must monitor the movements of the StochRSI, TC, and OBV indicators.
If the StochRSI indicator enters the overbought zone, the upward movement may be limited.
Therefore, to sustain the uptrend, it is best to ensure the StochRSI indicator has not entered the overbought zone.
The TC indicator is a comprehensive evaluation of the OBV + PVT + StochRSI indicators. An increase above the zero point indicates that buying pressure is dominant, while a decrease indicates that selling pressure is dominant.
Therefore, even if the TC indicator shows an upward trend, the uptrend is likely to continue only if it rises above the zero point.
The OBV indicator should be divided into three sections:
1. Low Line ~ High Line
2. Above the High Line
3. Below the Low Line
1. Low Line ~ High Line
If the OBV indicator is within the Low Line ~ High Line range, it is best to assume that the price has entered a sideways trading range.
Whether this sideways trading range is bullish or bearish can be determined by examining the trend of the channel formed by the Low Line ~ High Line.
Since the channel formed by the Low Line ~ High Line is currently forming an upward channel, it should be interpreted as being within a bullish sideways trading range.
2. Above the High Line
For the price to break out of the sideways trading range and enter an uptrend, it must rise above the High Line.
3. Below the Low Line
For the price to break out of the sideways trading range and enter a downtrend, it must fall below the Low Line.
Therefore, based on the movements of the StochRSI, TC, and OBV indicators, we should consider the current price unlikely to continue its upward trend and develop a response strategy.
-
Support may require observing the price movement for 1 to 3 days.
However, the price has been held near the DOM (-60) ~ HA-Low range for over two months.
Therefore, it's correct to interpret the current price as being in an upward sideways range.
If the OBV indicator falls below the Low Line and then below the DOM (-60) indicator, it will break out of the sideways range and enter a downtrend.
This is the answer to the question of whether the current price is supported.
For the price to show an upward trend, it must rise above at least DOM(-60) to HA-Low.
To create a stepwise uptrend, or a full-blown uptrend, it must rise above HA-High to DOM(60).
Therefore, if the current price rises from the DOM(-60) to HA-Low range, the resistance zone will be the HA-High to DOM(60) range.
Since the HA-High and HA-Low indicators are the most important indicators, the price must rise above the HA-High indicator and remain there for a full-blown uptrend to occur.
-
Thank you for reading to the end.
I wish you successful trading.
--------------------------------------------------

TSLA Trading at Key Gamma Level (435) — Volatility DecisionNASDAQ:TSLA 📊 | Price + Gamma Alignment
435 is the key.
🧲 Gamma Flip / HVL: 435
Above = controlled, range behavior
Below = volatility expansion
🔴 Resistance: 449 → 460
🟢 Support: 435 → 431 → 420
GEX still positive, but dealer support weakening.
Acceptance below 435 opens downside.
Trade price — let gamma explain why 🎯

#EURUSD Roadmap if the Plaza Accord Scenario is ConfirmedFed and NY Fed Actions on USD/JPY: Last week, reports emerged that the Federal Reserve Bank of New York conducted so-called "rate checks" on USD/JPY — technical consultations that often precede currency intervention. This was indeed interpreted by the market as a signal of readiness to support the yen, although no direct interventions have occurred yet — only the possibility of them.
Important: Despite the absence of direct interventions, the market reacted to the rumors: the dollar weakened against the yen, and the dollar index pulled back, as investors remember the power of coordinated actions similar to the Plaza Accord.
The news is generally credible, however, it's important to note that we're currently only discussing the possibility of intervention and talks about a new version of the Plaza Accord — not an actual agreement or joint operations. Real economic consequences will depend on whether practical actions follow the statements and "rate checks."
If the news is confirmed. Here's my new roadmap for the pair:
Weekly chart analysis. Identifying key historical levels.
Daily chart analysis. Determining impulse movement targets and projected correction levels.
Summary:
We've broken out of the accumulation zone on impulse from the news.
Nearest target: 1.22
Next target: 1.24 (possible sideways movement, partial profit-taking, position accumulation)
If intervention news is confirmed:
New target: 1.28
Correction (likely): 1.24
Final target: 1.30
Reversal.
And here's where it gets interesting.
Weak #USD = Strong #BTC

The Hybrid Trader: How to Combine Fundamental & Technical Analys
The biggest debate in trading is usually: "What matters more? The News (Fundamentals) or the Charts (Technicals)?"
The Fundamentalist says: "Charts are just lines. Real value comes from adoption, revenue, and interest rates."
The Technician says: "Price discounts everything. The chart tells me what insiders are doing before the news breaks."
Here is the harsh truth: If you rely on only one, you are trading with one eye closed. In 2026, the most profitable traders are Hybrids. They use Fundamentals to determine WHAT to trade (and the Direction), and Technicals to determine WHEN to trade (the Entry).
In this educational guide, I will teach you the "Hybrid Workflow" used by institutional desks to capture the biggest moves in crypto.
1. The Role of Fundamental Analysis (The "Why")
Fundamental Analysis (FA) is your Compass. It tells you the direction of the wind. You would not sail a boat into a hurricane just because the waves looked nice for a minute.
In Crypto, FA is not just "reading news." It comes down to two pillars:
A. Macro-Economics (The Tide)
Bitcoin is now a macro-asset. It moves with the US Dollar (DXY) and Interest Rates.
Bullish Winds: Falling Interest Rates, Weak Dollar (DXY < 100), Rising Global Liquidity (M2).
Bearish Winds: Rising Inflation, Hawkish Fed, Strong Dollar (DXY > 105).
Rule: Never go Long if the Macro is screaming Short.
B. On-Chain Data (The Engine)
Unlike stocks, we can see exactly what Bitcoin whales are doing.
Exchange Outflows: Coins leaving exchanges = Accumulation (Bullish).
Exchange Inflows: Coins moving to exchanges = Potential Dump (Bearish).
Rule: If price is rising but Whales are sending BTC to exchanges, it’s a trap.
2. The Role of Technical Analysis (The "When")
Technical Analysis (TA) is your Trigger. Even if the Fundamentals are perfect, you can still lose money if you buy the top. TA helps you find the "Discount."
Market Structure: Are we making Higher Highs (Uptrend) or Lower Lows (Downtrend)?
Key Levels: Where is the Liquidity? (Support/Resistance).
Momentum: Is the move exhausted? (RSI Divergence).
3. The "Hybrid Workflow": A Step-by-Step Strategy
Here is how you combine them into a single trade. Do not skip a step.
Step 1: The Macro Check (The Green Light)
Before you even look at a chart, ask: "Is the environment safe?"
Check: Is the DXY dropping? Is the Stock Market (S&P 500) stable?
Result: If YES, look for Longs. If NO, sit on hands or look for Shorts.
Step 2: The Project Check (Asset Selection)
Check: Which coin has a strong narrative right now? (e.g., Is it "AI Season"? Is it "Meme Season"?)
Action: Don't trade random coins. Pick the one with the strongest Fundamental Catalyst.
Step 3: The Technical Entry (The Sniper Shot)
Now—and only now—open the chart.
Do not market buy. Wait for the price to pull back to a "Key Level" (e.g., a retest of a breakout, or the 0.618 Fibonacci level).
Look for Confluence: Does the Support level match the 200-day Moving Average?
Step 4: The Invalidations (Risk Management)
Fundamental Stop: "If the Fed unexpectedly raises rates, I close the trade immediately."
Technical Stop: "If the price closes below the weekly support level, I’m out."
Case Study: The "Fakeout" Trap
Imagine Bitcoin breaks a major Resistance level at $95,000.
The Pure Technician: Sees the breakout candle and blindly buys. "To the moon!"
The Hybrid Trader: Checks the context. They see the DXY is spiking and Interest Rates are high. They realize the "breakout" has no volume backing it.
The Result: The price fakes out and crashes. The Technician gets liquidated. The Hybrid Trader stayed in cash and waited to buy the crash lower.
Conclusion
Technicals tell you where to buy. Fundamentals tell you how long to hold. To survive in 2026, you must stop viewing them as enemies. Combine them.
Fundamentals = Strategy.
Technicals = Tactics.
Master both, and you master the market.

Why You Should Backtest (Before You Trust Any Strategy)Most traders ask the wrong question.
They ask:
“Does this strategy work?”
The better question is:
“When does this strategy stop working?”
Backtesting exists to answer that.
1. A Single Backtest Is Not Proof
One profitable run does not mean a strategy is good.
It means it worked once, under one set of assumptions.
Markets change.
Volatility changes.
Behavior changes.
Backtesting across parameters, symbols, and timeframes shows whether performance is structural or accidental.
2. Drawdown Matters More Than Profit
Profit attracts attention.
Drawdown determines survival.
Two strategies can both make money.
Only one lets you stay disciplined long enough to compound.
Backtesting reveals:
Worst historical drawdown
Length of drawdowns
Recovery behavior
If you don’t know those, you don’t know the strategy.
3. Most Strategies Fail From Fragility
Many strategies look great until you:
Change RSI length by 2
Shift timeframe slightly
Switch from BTC to ETH
If performance collapses from small changes, the edge isn’t robust.
Backtesting exposes fragility before the market does.
4. Backtesting Protects You From Yourself
Most trading mistakes aren’t technical.
They’re emotional.
Backtesting:
Sets realistic expectations
Reduces overconfidence
Prevents panic exits during normal variance
Confidence comes from data, not conviction.
5. Backtesting Is About Risk, Not Prediction
Backtesting doesn’t predict the future.
It defines boundaries.
It tells you:
What’s normal
What’s abnormal
When something is truly broken
That’s the difference between trading and guessing.
Final Thought
Strategies don’t fail because they’re bad.
They fail because traders never tested their limits.
Backtesting isn’t optional.
It’s the cost of taking trading seriously.

Why Trading Strategies Fail When Market Conditions ChangeA Strategy Rarely Breaks Overnight
Most traders imagine strategy failure as a sudden event. One day it works. The next day it doesn’t.
In reality, strategies usually degrade slowly. Performance weakens as market conditions shift, even though the underlying logic remains unchanged. This gradual decay is easy to miss when trades are evaluated one by one.
1. Markets Do Not Stay in One Regime
Markets rotate through different environments:
High volatility and low volatility
Strong trends and choppy ranges
Expansion and compression phases
A strategy that thrives during one regime can struggle in another without any error in its design. This mismatch between strategy behavior and market conditions is one of the most common sources of frustration.
2. Why Traders Misinterpret Strategy Failure
When results deteriorate, traders often assume:
the strategy stopped working
the logic is flawed
the market “changed permanently”
In many cases, none of these are true. What changed was the context. Without understanding which environments favor or punish a strategy, losses feel random and confidence erodes.
3. How Backtesting Reveals Regime Sensitivity
Backtesting across longer periods often shows performance clustering. Profitable stretches tend to group together, followed by extended drawdowns or stagnation. These clusters usually align with shifts in volatility, trend strength, or liquidity.
Testing doesn’t eliminate drawdowns, but it explains them. Losses stop feeling mysterious when their conditions are understood.
4. The Risk of Optimizing for a Single Environment
Many strategies look impressive because they are tuned for one specific market regime. They perform exceptionally well under ideal conditions and poorly everywhere else.
Backtesting across different environments exposes this fragility. Robust strategies may not look spectacular in any single regime, but they remain functional across many.
5. Expectations Matter More Than Precision
A strategy does not need to work all the time to be valid. It needs to behave as expected.
Drawdowns are tolerable when anticipated. They become destructive when they arrive unexpectedly. Testing helps align expectations with reality and reduces reactive decision-making.
6. The Real Purpose of Backtesting
Backtesting is not about predicting the future. It is about understanding behavior.
It turns unexplained losses into understood outcomes. It replaces emotional responses with informed patience. Most importantly, it allows traders to stay aligned with the market long enough for probabilities to matter.
Final Thought
Strategies fail most often not because their logic is wrong, but because traders expect them to work under conditions they were never designed for.
Backtesting doesn’t prevent regime changes.
It prepares you for them.

The key is whether the price can rise above the uptrend line
Hello, fellow traders.
By "Following," you can always get the latest information quickly. Have a great day today.
-------------------------------------
#ETHUSDT
We need to observe the price action from around January 28th to February 4th.
The key is whether it can find support around the 2.828.57 to 2.887.66 range and rise above the uptrend line.
If it fails to rise, we need to check for support around the 2.419.83 to 2.706.15 range.
If the decline continues, the maximum decline is expected to be around the 1597.76 to 1861.57 range.
-
If it falls below the HA-Low indicator on the 1D chart, a stepwise downtrend is likely.
Since the downtrend ends with an uptrend, trading to increase the coins (tokens) corresponding to the profits is possible.
The basic trading strategy is to buy in the DOM(-60) ~ HA-Low range and sell in the HA-High ~ DOM(60) range.
The time to stop increasing the amount of coins (tokens) representing profits is when the price rises above the M-Signal indicator on the 1M chart and shows support.
This is because increasing the amount of coins (tokens) representing profits when the price is trending upward can actually decrease the number of coins (tokens).
To continue the uptrend by breaking above a key point or range, the StochRSI, TC, and OBV indicators must show upward trends.
If possible,
1. The StochRSI indicator should not have entered the overbought zone.
2. The TC indicator should remain above 0.
3. The OBV indicator should remain above the High Line.
If the above conditions are not met, caution is required when trading, as the price may only pretend to rise and then fall again.
-
Thank you for reading to the end.
I wish you successful trading.
--------------------------------------------------

Next Volatility Period: Around February 7th
Hello, fellow traders!
Follow us to get the latest information quickly.
Have a great day!
-------------------------------------
I believe BTC is currently at a critical crossroads, where it's either going to continue its uptrend or turn into a downtrend.
(BTCUSDT 1M Chart)
Therefore, support near the M-Signal indicator on the 1M chart is crucial.
Looking at this month's candlestick chart, the StochRSI 20 indicator appears to have formed a new point, rising from 37,155.0 to 87,550.43.
Therefore, caution is advised, as a decline below 87,550.43 could lead to a decline toward the next support and resistance level, near 73,499.86.
Even if the M-Signal indicator on the 1M chart rises above the OBV High indicator at 97,954.51, an uptrend is expected only if it rises above this level.
-
(1W chart)
The key is whether the price can rise along the rising trend line (1).
Furthermore, to maintain the price above the M-Signal indicator on the 1M chart, it is crucial to see if the price can rise above the 91013.65 level, which is the StochRSI 50 indicator point, to find support.
-
(1D chart)
The next volatility period is expected to begin around February 7th.
However, since the volatility period shown on the 1W chart is in April, the main volatility period is expected to occur in April.
As the next volatility period passes, the key point to watch is whether the price continues to rise along the rising trend line (1).
Therefore, the price must remain above 89524.74 at the very least.
Currently, the M-Signal on the 1W chart > M-Signal on the 1D chart > M-Signal on the 1M chart, so a complete reversal has not yet occurred.
Therefore, if support is found near the M-Signal indicator on the 1M chart this time, it is expected to move upwards above the M-Signal indicator on the 1W chart.
Considering these points,
1. Key areas to protect: Left Fibonacci ratio 2.618 (87814.27) ~ Left Fibonacci ratio 3.14 (93570.28)
To protect the first key area, support is needed around the 84739.74 ~ 87944.84 area.
To turn to an uptrend and continue the uptrend, the M-Signal indicator on the 1W chart must rise above this level. Based on the current position, this is expected to occur only if the price rises above 95330.17.
-
(15m chart)
For the Heikin-Ashi candlestick to turn bullish, it needs to rise near 92631.0. It's rising.
Based on the chart movement, I believe a rise above 92631.0 will signal a reversal.
Since the M-Signal indicator on the 1D chart is passing near 92631.0, we believe the price must ultimately rise above the M-Signal indicator to maintain its upward momentum.
My basic trading strategy is to buy in the DOM(-60) ~ HA-Low range and sell in the HA-High ~ DOM(60) range.
However, if the price rises from the HA-High to DOM(60) range, it could exhibit a step-like upward trend. If the price falls from the DOM(-60) to HA-Low range, it could exhibit a step-like downward trend.
Therefore, it's recommended to trade using a split trading method.
Looking at the current 15m chart, the DOM(-60) and HA-Low indicators were generated and then rose, but only slightly, generating the DOM(60) indicator.
Therefore, to sustain the upward trend, the DOM(60) indicator must break above the level.
Once you've identified a key point or range, you need to determine whether a break above that point or range can sustain the upward trend.
For this purpose, we use the StochRSI, TC, and OBV indicators.
The StochRSI, TC, and OBV indicators should all be showing upward trends.
If possible, the StochRSI indicator should not have entered an overbought zone. The TC indicator should remain at 0.
The OBV indicator should remain above the High Line.
If the above conditions hold when the DOM (60) indicator breaks above, an attempt to rise above 92631.0 is expected.
If not, a decline towards the HA-Low indicator is likely.
--------------------------------------------------
The final destination is likely to be near the 69K to 73499.86 range, as mentioned at the start of the decline.
However, as always, there is a possibility of a smaller decline and a subsequent rise. Therefore, we need to closely monitor the upward trend, especially when the price rises above the left Fibonacci 2.618 (87814.27) to left Fibonacci 3.14 (93570.28) range and sustains.
Every investor wants to buy at a lower price. However, caution is required, as buying when the price is in a downward trend can be extremely burdensome.
Currently, the price is near the HA-Low indicator on the 1D chart, so if the price falls, it is likely to experience a step-down trend.
This step-down trend ultimately signals a reversal to the upside, so aggressive buying is acceptable. However, investment allocation should be adjusted, as additional buying will be necessary when the HA-Low indicator is met again.
-
Thank you for reading to the end.
I wish you successful trading.
--------------------------------------------------

Why Beginners Struggle w/ Strategies (And How Testing Fixes It)Why Beginners Struggle With Strategies
And How Backtesting Changes Everything
Most beginners struggle with trading strategies for the same reason: they judge performance too quickly.
A strategy looks good on a chart. A few trades win. Confidence builds. When losses eventually show up, frustration follows and the strategy is abandoned. The cycle repeats with a new indicator, a new setup, or a new idea.
This isn’t because beginners lack intelligence or discipline. It’s because they’re evaluating strategies without context.
Trading strategies don’t “work” or “fail” in isolation. They behave differently depending on conditions, risk, and expectations. Backtesting is what reveals that behavior.
Logic Explains the Idea. Testing Explains the Reality
Strategy logic explains why something might work.
Backtesting explains how it actually behaves.
A strategy might be based on momentum, mean reversion, trend-following, or volatility expansion. The logic can be sound and still produce disappointing results if the conditions aren’t favorable.
Backtesting adds perspective by answering questions logic alone cannot:
How often does this strategy win?
How large are the losses when it fails?
How long do losing streaks last?
How sensitive is performance to small changes?
Without testing, beginners often mistake a good story for a good strategy.
The Beginner Trap: Judging a Strategy Too Early
One of the most common mistakes beginners make is evaluating a strategy based on a very small number of trades.
A short streak of wins creates confidence.
A short streak of losses creates doubt.
Neither tells you much.
Markets are noisy. Randomness dominates in the short term. Backtesting across more data helps smooth that noise and reveal what’s normal behavior versus what’s a warning sign.
A strategy that loses five times in a row may be behaving exactly as expected. A strategy that wins five times in a row may simply be experiencing luck. Testing provides the reference point needed to tell the difference.
Why Drawdown Matters More Than Profit
Beginners often focus on profit first.
Experienced traders focus on drawdown first.
Drawdown is the amount an account declines from a peak before recovering. It’s not just a number. It represents psychological pressure, risk of abandonment, and capital erosion.
Two strategies can produce the same return and feel completely different to trade:
One may experience shallow, manageable drawdowns
The other may suffer deep, extended losses before recovering
Backtesting exposes this difference clearly.
A strategy with large drawdowns may look profitable on paper, but it can be extremely difficult to trade in real time. Many traders quit these strategies at the worst possible moment, right before recovery.
Understanding drawdown ahead of time helps beginners choose strategies they can actually stick with.
Why Win Rate Is Often Misleading
Another common beginner focus is win rate.
High win rate feels comforting. Low win rate feels broken.
But win rate alone says very little about strategy quality. A strategy can win often and still lose money if losses are large. Another can lose frequently and still be profitable if wins are larger than losses.
Backtesting helps beginners see how metrics interact:
Win rate
Average win
Average loss
Drawdown
Trade frequency
No single metric tells the full story. Testing reveals the balance.
The Problem With “Perfect” Settings
Many beginners assume that once the “right” parameters are found, performance will remain consistent.
In reality, this is rarely the case.
Strategies that depend on very specific settings often fail when conditions change. Slight adjustments to timeframe, volatility, or market structure can dramatically alter results.
Backtesting across parameter ranges helps identify whether a strategy’s edge is structural or accidental. Robust strategies tend to behave similarly across a range of settings. Fragile strategies collapse when assumptions shift.
This distinction is almost impossible to see without broader testing.
Frequency, Friction, and Expectations
More trades do not automatically mean better results.
Each trade introduces:
Execution risk
Slippage
Fees
Emotional decision-making
Backtesting helps beginners understand how trade frequency affects performance. A strategy that trades constantly may look productive but struggle to compound once friction is accounted for. Fewer, higher-quality trades often lead to smoother equity curves.
Testing sets realistic expectations and prevents overtrading driven by boredom or impatience.
Why Beginners Argue About Strategies
Beginners often argue about whether a strategy “works” because they’re each looking at a different slice of data.
One trader tests during a favorable period.
Another tests during a difficult regime.
Both conclusions feel correct.
Backtesting across broader conditions helps reconcile these disagreements. It doesn’t eliminate uncertainty, but it reveals where and when a strategy tends to struggle.
Understanding this reduces frustration and replaces debate with curiosity.
What Backtesting Really Teaches
Backtesting is often misunderstood as a way to find perfect strategies. In reality, its greatest value is educational.
It teaches:
What normal losing periods look like
How strategies behave under stress
How expectations should be calibrated
Why patience matters
For beginners, this learning curve is invaluable. It transforms trading from guessing into structured experimentation.
Final Thoughts: From Guessing to Understanding
Backtesting doesn’t make trading easy.
It makes trading honest.
It replaces hope with context and confidence with preparation. Instead of chasing strategies that look good today, beginners learn how strategies behave over time.
Trading becomes less about finding something flawless and more about understanding what you’re actually trading.
That shift doesn’t guarantee success.
But it dramatically improves the odds of staying in the game long enough to learn.

What Profitable Traders Learned From Their Biggest MistakesEvery trader faces challenges, and understanding your own trading psychology is key to success. This video highlights the common mistakes traders make, emphasizing the importance of learning with errors to improve your trading discipline. By understanding the psychology of trading, you can cultivate a stronger trading mindset and avoid pitfalls.
Every profitable trader has one thing in common: they didn’t start out profitable. Behind consistent gains lies a history of costly mistakes, hard lessons, and moments of doubt. What separates successful traders from the rest isn’t avoiding errors—it’s learning from them.
One of the most common mistakes traders make early on is overtrading. Many profitable traders admit they once believed more trades meant more money. Instead, it led to emotional decisions, higher fees, and unnecessary losses. The lesson? Quality beats quantity. Waiting for high-probability setups is far more effective than being constantly in the market.
Another painful lesson comes from poor risk management. Ignoring stop-losses, risking too much on a single trade, or trying to “win it all back” after a loss often resulted in blown accounts. Profitable traders learned that protecting capital is priority number one. They now focus on controlling downside risk, knowing that survival in the market comes before growth.
Many traders also struggled with emotional trading. Fear caused them to exit winning trades too early, while greed kept them in losing trades far too long. Over time, they learned that discipline matters more than prediction. Creating and following a clear trading plan helped them remove emotion from decision-making.
A final major mistake was failing to review trades. Early on, losses were often blamed on the market. Profitable traders learned to take responsibility instead. By journaling trades and analyzing patterns, they turned mistakes into data—and data into improvement.
In the end, profitable traders didn’t eliminate mistakes; they transformed them into teachers. Their success is built not on perfection, but on reflection, discipline, and the willingness to learn from failure. In trading, mistakes are inevitable—but repeating them is optional.
And what is your biggest mistake in trading, share :)

XAU/USD Bullish Outlook: Is Gold Heading Toward the $4,850?Market Analysis:
Gold (XAU/USD) remains in a dominant bullish structural trend on the 4H timeframe. After a strong rally, the price is currently consolidating near the $4,600 psychological level.
Key Technical Observations:
Trend Geometry: Price is respecting a well-defined ascending channel. The current trajectory suggests a healthy trend with consistent higher highs and higher lows.
The "Buy the Dip" Opportunity: My primary thesis revolves around a potential retrace/pullback to the $4,530 - $4,550 support zone. This area aligns with previous structural resistance-turned-support and the dynamic support of the moving averages.
The Moon Target: If the support holds, the projected path points toward Take Profit #3 ($4,800 - $4,860), which sits at the upper confluence of the expansion channel.
Trade Parameters:
Entry Zone: $4,515 - $4,530 (Look for bullish reversal candles here).
Stop Loss (SL): Below $4,470
Take Profit Targets:
TP 1: $4,790 (Initial supply zone)
TP 2: $4,857 (Final Target / Major Resistance)
Strategy Note:
Gold is currently trading at historic levels. While the momentum is clearly bullish, caution is advised. Keep a close eye on the DXY (US Dollar Index) and upcoming Macro data, as any sudden USD strength could deepen the correction before the next leg up.
What’s your take? Are we seeing $4,800 before the end of the quarter? Drop your thoughts in the comments! 👇
Disclaimer: This is a personal trading idea for educational purposes and not financial advice.

See if the price can hold above the M-Signal indicator on the 1D
Hello, fellow traders!
Follow us to get the latest information quickly.
Have a great day!
-------------------------------------
(BTCUSDT 1D chart)
This period of volatility is expected to last until January 21st.
The key question is whether the price can maintain its upward momentum by rising above the left Fibonacci level of 3.14 (93570.28) after this period of volatility.
To sustain the uptrend, the price must rise above the M-Siganl indicator on the 1W chart.
Therefore, the price must ultimately rise above the StochRSI 80 level at 97193.34.
However, the most important indicators on the chart are the DOM (-60), HA-Low, DOM (60), and HA-High indicators.
Therefore, support must be found around the DOM (60) level at 96951.78 to sustain the uptrend.
-
If the price meets the HA-Low indicator and rises, then meets the HA-High indicator, the wave is considered reset and a new wave is determined.
Most often, a price meeting the HA-High indicator leads to a decline.
Currently, the price is showing a downward trend as it encounters the DOM (60) indicator.
Therefore, the wave cannot be considered reset.
Therefore, it may show an upward trend again after this period of volatility.
-
I use the StochRSI and On-Board Value (OBV) indicators as auxiliary indicators to help identify support and trends.
The strength of the trend can be predicted by observing the movements of the OBV indicator.
Currently, the OBV indicator has fallen below the High Line, indicating weakening upward momentum.
However, since it is still above EMA 1, the upward momentum is still dominant.
If the OBV indicator remains above EMA 2, it will rise above the High Line again, indicating a strengthening upward momentum.
There are several ways to interpret the OBV indicator.
Among these, the most important interpretation is the direction in which the OBV indicator is positioned relative to the zero point.
If it's above the zero point, it can be interpreted as a buying trend, while if it's below the zero point, it can be interpreted as a selling trend.
Another interpretation method I use is the one I use.
That is, it predicts the trend based on the direction in which the OBV indicator deviates from the Low Line to the High Line.
If the OBV indicator rises above the High Line, it can be interpreted as a bullish trend, while if it falls below the Low Line, it can be interpreted as a bearish trend.
Therefore, the current OBV indicator can be considered to have entered a sideways trading range, or a boxing range.
-
The OBV indicator is a leading indicator.
However, the StochRSI indicator can be considered a slower indicator than the OBV indicator.
However, it is not a completely lagging indicator.
I believe the StochRSI indicator signals a wave.
This is because it can predict price movements based on whether the 50 level is rising or falling.
Next, it determines whether the price is in an overbought or oversold zone.
The StochRSI 20, 50, and 80 indicators were created to visually represent this method of interpreting the StochRSI.
Each of these indicators acts as support and resistance.
The StochRSI 20 indicator can be interpreted as indicating a low, while the StochRSI 80 indicator can be interpreted as indicating a high.
Therefore, for a trend to form, the StochRSI must either fall below 20 or rise above 80.
Based on the movements of the OBV and StochRSI indicators above, the current price position suggests that it has re-entered the sideways or boxy range.
-
The tedious explanation above is actually unnecessary.
However, I explained it because it's important to understand why such indicators are displayed on the chart at least once.
The price is currently rising within the DOM(-60) ~ HA-Low range.
While it hasn't yet met the HA-High indicator, there's a possibility of further increase. However, since it has met the DOM(60) indicator, we can interpret this as a price correction.
Therefore, we can determine whether support is present by falling back to the DOM(-60) ~ HA-Low range.
It's important to note that the M-Signal indicator on the 1M chart is passing through the DOM(-60) ~ HA-Low range, and the current price is above it.
To sustain the uptrend, the price must remain above the M-Signal indicator on the 1M chart.
Therefore, we should consider buying based on whether there is support at:
1. the DOM(-60) ~ HA-Low range,
2. the StochRSI 20 indicator point,
3. the DOM(60) indicator point.
If the price rises above the DOM(60) indicator point of 96951.78, the next important support and resistance level is the 108353.0 ~ 110105.69 range.
-
Thank you for reading to the end.
I wish you successful trading.
--------------------------------------------------
- This is an explanation of the big picture.
(3-year bull market, 1-year bear market pattern)
I will explain in more detail when the bear market begins.
------------------------------------------------------

EUR/USD: The Greenland Gambit & Tariff ShockHedge Funds Retreat as Trump Weaponizes Trade Policy for Arctic Control
The Euro has entered a volatile corridor, driven by a sharp reversal in institutional positioning. Hedge funds and leveraged speculators have aggressively exited bullish Euro bets, flipping to net short positions for the first time since November. This pivot directly correlates with President Donald Trump’s ultimatum: impose punitive tariffs on European nations unless they facilitate the U.S. acquisition of Greenland.
Geopolitics & Geostrategy: The Arctic Pivot
The currency fluctuation is no longer just a monetary phenomenon; it is a geostrategic signal. Washington views Greenland not merely as territory, but as a critical security asset. Control over the island secures the GIUK Gap (Greenland-Iceland-UK), a naval choke point vital for monitoring Russian submarine activity in the North Atlantic.
Trump’s willingness to leverage transatlantic trade relationships highlights a shift in U.S. doctrine. The administration is prioritizing territorial expansion and resource security over traditional alliance stability. Investors are pricing in a scenario where the Euro becomes the primary casualty of this diplomatic coercion.
Science & High-Tech: The Rare Earth Race
Behind the political theater lies a cold scientific reality. Greenland holds some of the world’s largest undeveloped deposits of Rare Earth Elements (REEs) . These materials, neodymium, praseodymium, and dysprosium, are non-negotiable components for high-tech manufacturing, including F-35 fighter jets, electric vehicles, and quantum computing hardware.
The battle for Greenland is a proxy war for technological supremacy. China currently dominates the REE supply chain. By forcing the Greenland issue, the U.S. aims to break this monopoly. The Euro’s depreciation reflects the market’s realization that Europe holds the losing hand: it risks losing either its trade access to the U.S. or its sovereignty over strategic Arctic resources.
Macroeconomics: Growth Under Siege
The economic implications for the Eurozone are severe. Tariffs act as a direct tax on European growth, which is already fragile. Analysts warn that traders are underpricing the risk of a "rupture" in major currency pairs. A full-scale trade war would dismantle the nascent recovery in European manufacturing, specifically in the German automotive sector, which relies heavily on U.S. exports.
Strategists predict EUR/USD could test support at 1.1499 . This technical level represents a psychological floor; a breach here would invite algorithmic selling, accelerating the currency’s decline.
Market Dynamics: The Algorithmic Shift
Data from the Commodity Futures Trading Commission (CFTC) confirms a decisive sentiment shift. The flip to net short positioning indicates that smart money is front-running the potential escalation. Algorithms, programmed to react to "trade war" syntax in news wires, are driving intraday volatility. The Euro’s swing between losses and gains underscores a market struggling to price in a binary geopolitical outcome: a diplomatic deal or a trade conflict.
Conclusion
The EUR/USD pair is now a barometer for the breakdown of the post-WWII order. The drivers of this fluctuation extend far beyond interest rate differentials. They encompass Arctic security, the control of future-tech resources, and the weaponization of economic policy. Until the Greenland standoff resolves, volatility will remain the only certainty.

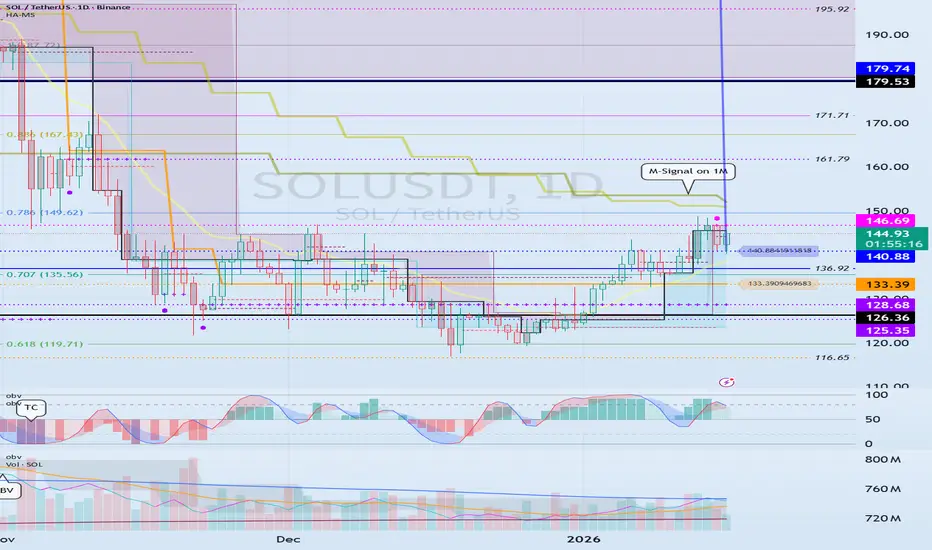
Support and Resistance Area: 140.88-146.69
Hello, traders!
Follow us to get the latest information quickly.
Have a great day!
-------------------------------------
(SOLUSDT 1D Chart)
SOLUSDT is entering a new phase with the emergence of the DOM(60) and HA-High indicators.
Accordingly, the key question is whether the price can rise while gaining support near the 140.88-146.69 level.
If not, it could fall below the 128.66-133.39 level and set a new low.
A decline below the M-Signal indicator on the 1M chart is highly likely to trigger a downtrend, so caution is advised when trading.
Therefore, we should set a buy point when the price rises above the M-Signal indicator on the 1M chart and maintains its level.
Since BTCUSDT's volatility period is around January 20th, we should monitor whether the price can rise above the M-Signal indicator on the 1M chart after this period.
-
To continue the uptrend by breaking above a key point or level, the StochRSI, TC, and OBV indicators must show upward trends.
If possible,
1. The StochRSI indicator should not have entered an overbought zone. 2. The TC indicator should remain above the 0 level.
3. The OBV indicator should remain above the High Line.
Looking at the current auxiliary indicators, we can see that the conditions for a sustained uptrend are not met.
Therefore, we should examine whether the conditions for a sustained uptrend can be met around the 140.88-146.69 range.
-
Thank you for reading to the end.
We wish you successful trading.
--------------------------------------------------
Next Volatility Period: Around January 20th
Hello, traders!
Follow us to get the latest information quickly.
Have a great day!
-------------------------------------
(BTCUSDT 1D chart)
This volatility period will last until January 11th.
The current price is above the M-Signal indicator on the 1M chart. To confirm this, we need to examine whether the price can rise to the left Fibonacci range of 3 (92026.52) - 3.14 (93570.28).
The StochRSI indicator has entered an oversold zone, and the On-Board Volume indicator is near the High Line.
Since the TC indicator is at 0, any movement is not surprising.
If the On-Board Volume indicator breaks above the High Line and the second EMA, and the price rises to the left Fibonacci range of 3 (92026.52) - 3.14 (93570.28), further upside is expected.
The next volatility period is around January 20th.
Therefore, as the next volatility period passes, we need to examine which of the circles on the chart it is near.
-
If the price falls below the 84739.74-87944.84 range, a step-down trend is likely, so you should consider a response plan.
The maximum decline is between 69K and 73K, but a potential uptrend near 78595.86 is also possible, so you should consider a response plan for this.
-
During an uptrend, you should monitor whether the price can sustain itself by breaking above the M-Signal indicator on the 1W chart.
If the upward breakout is successful, the key will be whether it can break above the 108353-11010569 range.
-
A lot of money has flowed into the coin market, but recently, it has been flowing out.
If this flow of funds changes, the coin market could experience another bull market.
For the coin market to experience a bull market, I believe both BTC and USDT dominance must decline.
USDT dominance must fall below 4.915 and either remain stable or show a downward trend.
BTC dominance must fall below 55.01 and either remain stable or show a downward trend.
If not, I believe it will be difficult for all coins (tokens) to experience a bull market.
2026 is likely to be the year of a major bear market, so it's a good idea to closely monitor capital movements.
USDT and USDC are showing gapping declines as a precursor to a bear market.
-
Thank you for reading to the end.
I wish you successful trading.
--------------------------------------------------
- Here's an explanation of the big picture.
(3-year bull market, 1-year bear market pattern)
I will provide more detailed information when the bear market begins.
------------------------------------------------------

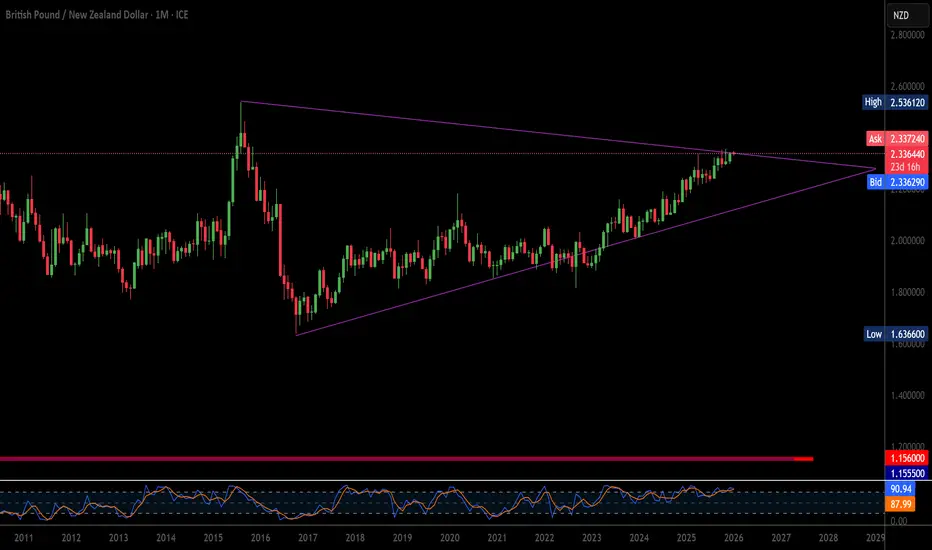
GBP/NZD 2026: Why the Kiwi is Winning the New Year RallyThe GBP/NZD exchange rate faces intense pressure as 2026 begins. A surge in global risk appetite is currently driving investors toward the New Zealand Dollar. Meanwhile, disappointing economic data from London is weighing heavily on the British Pound. This divergence has pushed the pair into a defensive posture near the 2.33 level.
Geostrategy: From Venezuela Shock to Settlement
Geopolitical tensions initially spiked following the U.S. military operation in Venezuela on January 3, 2026. However, the "fear factor" evaporated quickly as early dialogue between Washington and Caracas began. Markets now hope for a stabilized energy corridor rather than a prolonged conflict. This shift from "panic" to "risk-on" directly benefits the New Zealand Dollar. As a high-beta currency, the "Kiwi" thrives when global uncertainty recedes.
Macroeconomics: The UK's Services PMI Reality Check
The British Pound struggled this week following a significant revision to the UK Services PMI. Final figures for December 2025 dropped to 51.4 from an initial "flash" estimate of 52.1. This downgrade signals that the UK's core growth engine is losing steam. Rising operational costs and weak European demand are currently squeezing British margins. Consequently, traders are increasing bets on aggressive Bank of England rate cuts throughout 2026.
Industry Trends: Agriculture and High-Tech Resilience
In New Zealand, the "Fonterra Pivot" is generating renewed optimism for the national balance sheet. The expected return of capital from Fonterra’s consumer brand sales is supporting the rural economy. Furthermore, New Zealand’s high-tech precision farming sector continues to attract significant international investment. These "green shoots" in domestic activity contrast sharply with the UK's sluggish industrial sector. While the UK recovers from a major cyber incident at Jaguar Land Rover, New Zealand is accelerating its export growth.
Technology and Cyber: The Productivity Gap
The UK's long-standing productivity challenges remain a significant hurdle for Sterling. Recent Office for National Statistics data shows the UK attracted the lowest investment in the G7 during 2025. While some British firms are finally integrating AI to lower costs, the rollout remains fragmented. In contrast, New Zealand's focus on tech-led agricultural efficiency has created a more resilient "commodity-plus" economic model. This technical advantage supports a stronger long-term floor for the NZD.
Management & Leadership: The BoE vs. RBNZ
Management of monetary policy is now the primary battleground for this currency pair. The Reserve Bank of New Zealand (RBNZ) has lowered the OCR to 2.25%, signaling the end of its easing cycle. Conversely, the Bank of England is just beginning to face its growth-inflation dilemma. With UK unemployment rising to 5.1%, the BoE faces immense political pressure to slash rates. This policy divergence favors the New Zealand Dollar’s yield advantage over the Pound.
Trading Methods to Increase Your Coin (Token) Holdings
Hello, fellow traders!
Follow us to get the latest information quickly.
Have a great day!
-------------------------------------
Increasing your coin (token) holdings by retaining coins (tokens) that represent profits is a useful method in investment markets where decimals are traded.
To use this method, familiarity with day trading is advantageous.
Familiarity with futures trading will also make it easier to understand the principles.
-
The trading principle is simple.
1. If a profit is generated based on the purchase price, sell the original purchase amount to retain the coin (token) corresponding to the profit.
2. If a profit is generated based on the purchase price, sell the existing coin (token) before the price begins to decline, and then sell the amount at the appropriate price to increase the number of coins (tokens) you currently hold.
-
(ETHUSDT 1D chart)
The basic trading method is to buy in the DOM(-60) ~ HA-Low range and sell in the HA-High ~ DOM(60) range.
Using this basic trading method, you can increase the number of coins (tokens) corresponding to the profit.
However, since trading based on 1D chart movements is difficult, it is recommended to trade on a lower timeframe chart (e.g., 15m, 30m).
-
(15m chart)
You can trade using the basic trading method on the 15m chart.
However, sell when the HA-High ~ DOM(60) range declines, and buy when the DOM(-60) and HA-Low indicators meet to increase your coin (token) holdings.
Therefore, understanding LONG and SHORT positions in futures trading is essential.
At first, it's best not to try to increase your coin (token) holdings drastically all at once.
This is because you may make unintended trades if you're not yet comfortable with trading.
-
When the price is rising, the StochRSI, TC, and OBV indicators will trend upward.
At this time, the StochRSI indicator should not enter the overbought zone.
The TC indicator should remain above 0.
The OBV indicator should remain above the High Line.
If this isn't the case, it's highly likely that the uptrend will be difficult to maintain, so caution is advised when trading.
-
Conversely, when the price is falling, the StochRSI, TC, and OBV indicators will show a downward trend.
In this case, the TC indicator should remain below 0.
The OBV indicator should remain below the Low Line.
The StochRSI indicator is only valid if the trend isn't upward.
-
When determining the timing of a trade, check the support levels of the indicators displayed in the price section, along with the movements of the auxiliary indicators during uptrends and downtrends.
In other words, the most important factor in trading is whether the indicators in the price section provide support near the horizontal line.
It's not a significant trading strategy if the profit increases by just 1 coin (token).
However, increasing the number of coins (tokens) representing profit through numerous transactions ultimately increases the number of coins (tokens) with a purchase principal of zero, reducing the burden of trading with existing investment funds.
Regardless of your investment amount, increasing the number of coins (tokens) representing profit is a method that can generate significant profits in the long term.
The basic trading method of buying and selling all of the profits to generate cash profits may be a better option.
However, since there's no guarantee of profit when starting a new transaction, the burden of new transactions is likely to increase.
However, increasing the number of coins (tokens) representing profit reduces this burden.
This is because trading is conducted through existing holdings (coins, tokens) rather than starting a new transaction.
-
There may be cases where you sell an existing coin (token) because you expect the price to fall, and then try to buy it back at a reasonable price, only to find that the price doesn't fall.
To reduce these risks, you should monitor the movements of auxiliary indicators on the 1D chart, such as StochRSI, TC, and OBV.
In other words, it's better to sell and then buy when the price is in a downward trend rather than when it's in an upward trend.
-
Thank you for reading.
I wish you successful trading.
--------------------------------------------------

The key is whether the price can break above the 4.90-6.03 level
Hello, fellow traders!
Follow us to get the latest information quickly.
Have a great day.
-------------------------------------
(Sidus Space 1W chart)
For a bullish reversal, the price must rise above 6.03 and hold.
The buy zone is 1.32-2.67. If it declines from this level, you should stop trading and wait and see.
A volume profile zone has formed at 4.90, so the key question is whether it can break above the 4.90-6.03 range.
Since the M-Signal indicator on the 1M chart is declining above 16.24, I believe a full-blown uptrend is still a long way off.
-
(1D chart)
To break above the 4.90-6.03 range, we need to check for support around 3.81-4.25.
If it falls below 3.81, it could fall to around 2.67, so we should consider a response plan.
A sharp upward surge is expected if the price breaks above the 4.90-6.03 level.
The target area we should focus on is the 16.24-16.97 range.
-
Thank you for reading.
We wish you successful trading.
--------------------------------------------------
