EURUSD Short-Term Correction Within Bullish StructureHello traders! Here’s my technical outlook on EURUSD (1H) based on the current chart structure. EURUSD recently shifted into a bullish phase after completing a prolonged corrective move inside a descending channel. Price respected the lower boundary of that channel multiple times, forming higher reactions from support and signaling weakening seller pressure. Eventually, buyers took control and triggered a strong impulsive breakout to the upside, decisively breaking above the channel resistance and accelerating higher. This impulse confirms a short-term bullish market structure and strong momentum from buyers. Following the impulsive rally, price pushed directly into a clearly defined Seller Zone / Resistance Level around 1.1880, where a fake breakout occurred. The sharp rejection from this area indicates that sellers are active near the highs and that the market may be temporarily overextended. Such behavior after a vertical move often signals exhaustion rather than immediate continuation. As a result, EURUSD is now showing signs of a corrective phase. The most logical scenario is a pullback toward the previous Buyer Zone around 1.1790, which aligns with the former resistance turned support and the broader Support Level marked on the chart. This zone represents a key area where buyers previously stepped in aggressively, making it a natural magnet for price during a retracement. My scenario: after the strong impulse and rejection from the Seller Zone, EURUSD may continue to correct lower toward the 1.1790 support area (TP1). As long as price remains below the resistance and inside this corrective structure, a pullback remains the favored outcome. A clean reaction and stabilization from the support zone could later open the door for trend continuation to the upside. However, a failure to hold this support would increase the probability of a deeper correction. For now, this is a counter-trend pullback scenario within a broader bullish context, with sellers in control in the short term and buyers expected to re-enter at key support. Please share this idea with your friends and click Boost 🚀
Tradingview

EURUSD: Corrective Pullback After Strong Bullish ImpulseHello everyone, here is my breakdown of the current EURUSD setup.
Market Analysis
EURUSD has been trading within a well-defined upward channel, which reflects a strong bullish structure over the higher timeframe. Price has consistently respected the channel boundaries, forming higher highs and higher lows, confirming that buyers remain in control of the broader trend. Each impulsive leg higher has been followed by corrective pullbacks that stayed contained within the channel, signaling healthy trend behavior rather than trend exhaustion. Recently, the market delivered a strong bullish impulse, breaking above the previous consolidation and pushing decisively higher. This impulsive move confirmed bullish momentum and attracted aggressive buying interest. After the breakout, price reached a key resistance zone around 1.1900, where sellers stepped in and caused a fake breakout above resistance. This failure to hold above the highs signals weakening bullish pressure at premium levels.
Currently, EURUSD started to correct lower, pulling back from resistance while still remaining inside the overall upward channel. Importantly, this decline currently appears corrective rather than impulsive, suggesting profit-taking and short-term seller activity instead of a full trend reversal. The former resistance area around 1.1800 has flipped into a Support Zone, which is now acting as the first key downside target and decision area. As long as price remains above the lower boundary of the channel, the broader bullish structure stays intact. However, the inability to sustain acceptance above resistance increases the probability of a deeper pullback toward support before the next directional move.
My Scenario & Strategy
My primary scenario is a short-term bearish correction within the broader bullish trend. As long as EURUSD trades below the resistance zone near 1.1900 and shows rejection from the upper channel boundary, I expect sellers to maintain control in the short term. The first target for this corrective move is the Support Zone around 1.1800, where buyers previously stepped in aggressively. If price reaches this support area and shows bullish reaction or consolidation, a continuation to the upside would remain the preferred higher-timeframe scenario. A clean bounce from support would confirm that the move lower was only a correction within the uptrend.
However, if EURUSD breaks below the support zone and shows acceptance beneath it, this would signal a deeper correction toward the lower boundary of the ascending channel. Only a decisive breakdown of the channel structure would invalidate the bullish bias and shift the market into a more bearish environment. For now, the setup favors a controlled pullback after a strong impulse, with short-term downside potential toward support while the overall trend structure remains bullish.
That’s the setup I’m tracking. Thank you for your attention, and always manage your risk.

EURUSD Short: Approaches Supply - Pullback Short Setup in FocusHello traders! Here’s a clear technical breakdown of EURUSD (3H) based on the current chart structure. After a strong bullish impulse and a confirmed breakout from the descending channel, EURUSD has moved aggressively higher inside a newly formed ascending channel. This impulsive rally signals strong buyer dominance in the short term; however, price is now approaching a key Demand-to-Supply transition area around 1.1790–1.1830, which previously acted as a significant reaction zone. The sharp upside move has created a near-vertical leg, increasing the probability of a temporary pullback due to overextension and profit-taking.
Currently, price is testing the upper portion of the ascending channel while simultaneously reacting to prior structure resistance. The rejection candles forming near this area suggest that bullish momentum is slowing, and buyers may be losing short-term control. This behavior often precedes a corrective retracement rather than a full trend reversal, especially after such an impulsive move. From a structural perspective, the zone around 1.1830–1.1870 aligns with a higher-timeframe Supply Zone, making it a logical area for sellers to step in. A bearish reaction from this region could trigger a pullback toward the mid or lower boundary of the ascending channel, where fresh demand may later re-enter.
My scenario: In my opinion, after a strong impulse, a corrective pullback to the level of 1.1790 (TP!) will follow. This zone aligns with channel support and previous breakout structure, making it a natural target for a healthy retracement (TP1). This short idea is counter-trend and should be treated strictly as a pullback trade within a broader bullish structure. Strong acceptance and continuation above the supply zone would invalidate the short scenario and signal renewed bullish continuation. For now, price is at a critical reaction zone where sellers may attempt to force a correction before the next directional move. Manage your risk!

SPX500 H1 – Supply Zone Rejection | Bearish Sell Setupon the SPX500 H1 timeframe, price has respected the previous Supply zone and is currently showing signs of stalling or rejection.
The RSI is around 59, indicating overbought conditions and building bearish pressure. If the market shows bearish momentum from this level and the structure weakens, the sell setup active.
Confirmation for the sell includes rejection from the Supply zone, RSI shifting from overbought toward downside, and bearish candles or momentum confirmation. The first target is 6890.0 (H1 Order Block) and the final target is 6840.0 (major downside liquidity)
Disclaimer:
This analysis is for educational purposes only. It is not financial advice. Trading involves risk, so always do your own research and manage risk properly before taking any trade.

OIL analysis, What will happen given the tensions ?The price is moving inside an ascending channel, which can push it higher. Now and in the future, as tensions in the Middle East increase, we should expect energy prices to rise. This upward pressure on prices will likely continue until the tensions come to an end.
Best regards CobraVanguard.💚
Give me some energy !!
✨We spend hours finding potential opportunities and writing useful ideas, we would be happy if you support us.

XAUUSD in coming daysThe price on the 1h timeframe is within an ascending triangle, which can be promising. If the price breaks this pattern with bullish candles, it could easily rise by the distance of AB=CD.

ADA's SituationAfter the drop, the price can slightly bounce back up if buyers support it and we have a price correction. If the red trendline is broken, the price can move to the ranges we have specified.
Best regards CobraVanguard.💚

GOLD above resistance? what's next?#GOLD... so our area is 5087 88
keep close and above sustain means another bull push on the table.
keep close n stay sharp.
good luck
trade wisely

GOLD supporting Level? What's next??#GOLD.. after a gap opening market made a new supporting area that is a round 5015 16
Keep close n sustain above means another rise on the table.
NOTE:we will go for cut n reverse below 5015 on confirmation.
Good luck
Trade wisley

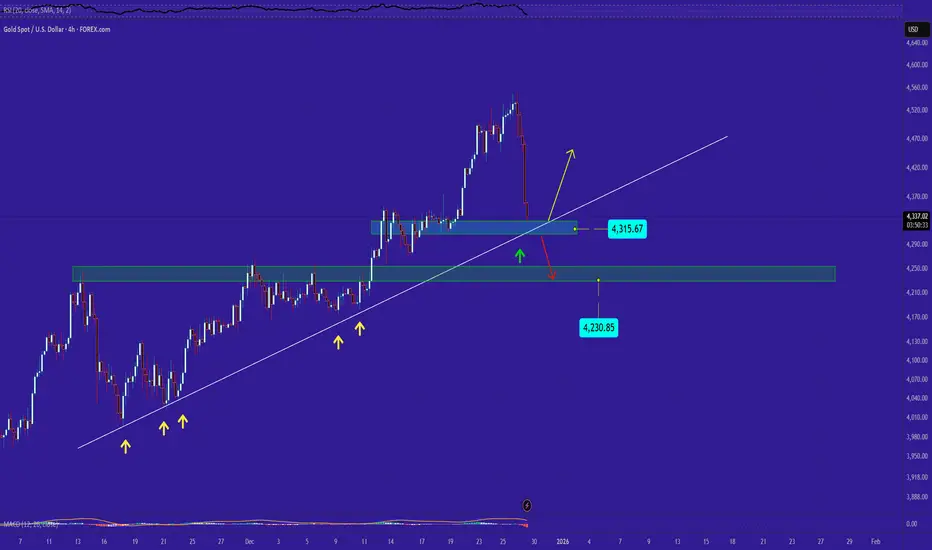
GOLD's SituationFor this drop, we can consider two support levels: one dynamic and one static. I’m hoping the dynamic support line can stop the decline. If not, and the dynamic support is broken, the price may fall down to around 4230.
GOLD at Resistance Region? what's next??#GOLD.. market perfectly moved as per our last idea and discussion and now market made a fresh resistance region that is around 5091 to 5095
keep close and sustain below means there is no buying scenarios for the time being.
NOTE: we will go for cut n reverse above 5095 on confirmation.
good luck
trade wisely

BTC / USDT – DAILY MARKET UPDATEMarket structure remains intact on the higher timeframe.
BTC is still trading within a higher timeframe bullish structure, but price is currently rotating lower inside a broadening structure, suggesting a corrective phase rather than a confirmed trend reversal.
While the Daily structure remains bullish, lower timeframes have shifted bearish, indicating short-term weakness and a move toward value and liquidity.
The recent downside move aligns with built liquidity below the range, with price gravitating toward the FRVP high-volume node around 85.8K, a key area of fair value.
Key levels to watch:
Resistance: 89K – 92K (previous range support turned resistance)
Support / Value: 85.8K (FRVP HVN) → liquidity below the range
As long as price remains below resistance, the market is likely to stay corrective and risk-off in the short term.
Bullish continuation becomes valid again only after a strong reclaim and daily acceptance above the 90–92K region.
Bias: HTF bullish, short-term corrective.
👍 Like if this helps
💬 Do you expect continuation into value, or a higher timeframe bounce from here?
MrC

#GBPJPY , Continue to hell ?📊 Morning Market Brief | London Session Prep
🔎 Instrument Focus: #GBPJPY
⚠️ Risk Environment: High
📈 Technical Overview:
I believe there is a chance we do see retracement from the point and goes up a bit then drop , but lets have this plan in our watchlist either.
🚀 Trading Plan:
• Wait for Momentum around key levels
• LTF ENTRY NEEDED
• Manage risk aggressively, and secure ASAP.
🧠 Stay updated with real time news and macro events, visit 👉 @News_Ash_TheTrader_Bot
#Ash_TheTrader #Forex #EURUSD #MarketInsight #PriceAction #TradingPlan #RiskManagement #LondonSession #Scalping #Futures #NQ #Gold

GBPAUD: Bearish Setup With High R/R PotentialLadies and gentlemen, GBPAUD could give us a solid short trigger with killer R/R potential. Straight to the analysis, no fluff. 🧙♂️
From the daily timeframe , I'd say the trend is fully bearish with heavy downside momentum.
In the 1H timeframe , after hitting support at 1.97064 and a mostly time-based correction, we're now forming a range below the key daily resistance 1.97980 . If the range floor— 1.97652 —breaks, first target is support 1.97064 . In continuation, if the trend holds, we'll see MWC downtrend extension—so watch that support closely.
Long trigger? None right now—we need higher highs/lows on 4H first, then maybe consider it.
By the way, I’m Skeptic , founder of Skeptic Lab .
I focus on long-term performance through psychology, data-driven thinking, and tested processes.
I'll keep you updated. Capital management—don't forget it, skip the FOMO. Peace out. 🩵

USD/ILS — Structure Still Pulling LowerToo many unfinished bearish Cs below.
USD/ILS keeps bleeding and can’t protect highs. As long as that’s the case, downside remains the magnet.
3.00 isn’t a call — it’s a destination if structure keeps playing out.

TOTAL MARKET CAP – 4H UPDATEMarket structure is shifting.
Price is trading inside a broadening structure, with a clear bearish market structure shift on the lower timeframes.
Price failed to hold above previous support and printed a bearish MSS.
Multiple bearish order blocks remain overhead and price is currently trading below them.
The recent HL is weak and sits inside a bearish structure, suggesting this move is more likely a correction continuation rather than trend continuation.
Key levels to watch
Resistance: 2.95T – 3.07T (bearish OB zone)
Support: 2.88T → 2.75T (liquidity + range lows)
As long as price stays below the bearish OBs, downside liquidity remains the primary target.
Bullish bias only returns after a clear 4H bullish MSS and reclaim above 3.05T+.
Market remains corrective / risk-off for now.
👍 Like if this helps
💬 What do you expect next: deeper pullback or quick reclaim?
MrC

GOLD at current supporting area? What's next??#GOLD market made a new supporting area that is around 4927 28
Keep close it and if market sustain above means there is another rise on the table.
Good luck
Trade wisley

XAUUSD – Liquidity Sweep → Supply Rejection → Short SetupPrice ran buy-side liquidity above the previous high and tapped into fresh supply. No acceptance above the high—strong rejection with wicks tells us sellers are active. That move up was manipulation, not continuation.
We’re looking to short after price closes back below the supply zone.
Entry: Post-rejection / bearish confirmation under supply
Stop: Above the liquidity sweep high
Target: Down into the discount / imbalance (green zone)
Clean structure, clear invalidation, strong R:R. As long as price stays below supply, bias remains short.

What will happen given the tensions?As you know, the accumulation of military equipment in the Middle East has strengthened speculation about a potential conflict with Iran, and this is impossible to ignore. This alone provides a strong justification for the rise in gold, silver, and other key metals. Additionally, the uncertainty surrounding Greenland and ongoing geopolitical tensions further contribute to this trend.
Now, moving to the technical analysis: since the price has broken down from the descending triangle pattern, it could decline toward $2630, or even lower, potentially reaching $2400. This bearish movement is likely to continue as long as geopolitical tensions persist.
Best regards CobraVanguard.💚
Give me some energy !!
✨We spend hours finding potential opportunities and writing useful ideas, we would be happy if you support us.

What will happen given the tensions?As you know, the accumulation of military equipment in the Middle East has strengthened speculation about a potential conflict with Iran, and this is impossible to ignore. This alone provides a strong justification for the rise in gold, silver, and other key metals. Additionally, the uncertainty surrounding Greenland and ongoing geopolitical tensions further contribute to this trend.
Now, moving to the technical analysis: since the price has broken down from the descending wedge pattern, it could decline toward $83,000 , or even lower, potentially reaching $79,000 . This bearish movement is likely to continue as long as geopolitical tensions persist.
Best regards CobraVanguard.💚
Give me some energy !!
✨We spend hours finding potential opportunities and writing useful ideas, we would be happy if you support us.
Best regards CobraVanguard.💚

WHEAT — Watching This Area CloselyWheat is pushing into a bearish WCL , and what’s interesting is that a bullish ABC (red) already hit its C right inside this zone .
Usually, that’s where things slow down.
At least a pause. A wick. Something.
Instead, price just kept going.
No real rejection.
No obvious momentum loss.
No bearish structure shift.
That tells me sellers showed up, but they didn’t get control. Feels more like absorption than resistance right now.
As long as price holds structure up here, I’m not fighting it. The move still looks alive, and the next area I’m watching is around ~$5.50 .
If this zone suddenly rejects hard and structure flips bearish, then fine — idea’s invalid. Simple.
For now, just watching how price behaves here.
Not financial advice.

AUDUSD – Higher Timeframe Setup (D1)Price is trading into a major HTF resistance / supply zone (~0.69871) that previously acted as strong distribution. The recent move up looks corrective, forming lower highs inside a broader bearish structure. Liquidity is likely resting above this zone (“stops”), which often gets swept before a strong bearish expansion.
If price rejects this zone, the higher-timeframe bias favors a continuation to the downside, with downside targets toward the 0.55 liquidity area marked below.
Bias: Bearish below HTF resistance
Idea: Wait for rejection → sell confirmation → ride the HTF move
📌 I trade structure, liquidity, and HTF zones — not indicators.
If you want to learn how to spot these setups early and trade them with confidence, follow me and check my 90-day trading plan.
Trade with a plan. Trade with structure.

EURUSD: Trend Shift in Play as Buyers Defend Rising SupportHello everyone, here is my breakdown of the current EURUSD setup.
Market Analysis
EURUSD is trading within a broader bullish context after completing a corrective phase. Earlier, price moved higher inside a well-defined ascending channel, confirming strong buyer control with a clear sequence of higher highs and higher lows. After reaching the upper boundary of the channel, the market transitioned into a corrective bearish move, forming a descending channel that reflected temporary seller dominance rather than a full trend reversal. During this correction, price interacted multiple times with key structure levels, producing several breakouts and fake breakouts, which highlighted increased volatility and stop-hunting behavior. Eventually, EURUSD broke below the descending channel but failed to sustain downside momentum. Sellers lost control near the Support Zone around 1.1700, where price found strong demand aligned with previous structure and a rising support line. Buyers stepped in aggressively from this area, leading to a sharp bullish impulse and a confirmed breakout above the descending channel resistance. This breakout suggests a structural shift back in favor of buyers.
Currently, price is consolidating above the support zone and holding above the rising support line, indicating acceptance and strengthening bullish intent. Overhead, the market is approaching the Resistance Zone around 1.1780, which previously acted as a rejection area and remains a key level to watch.
My Scenario & Strategy
My primary scenario remains bullish as long as EURUSD holds above the 1.1700 support zone and continues to respect the rising support structure. A sustained move toward the 1.1780 resistance area is likely, with this level acting as the first target (TP1). A clean breakout and acceptance above resistance would confirm continuation and open the door for further upside.
However, if price gets rejected from resistance, a period of consolidation or a shallow pullback toward the support zone could occur before the next attempt higher. A decisive breakdown below the 1.1700 support would weaken the bullish bias and signal a deeper corrective move. For now, structure and price action favor buyers while support continues to hold.
That’s the setup I’m tracking. Thank you for your attention, and always manage your risk.
