XAUUSD Builds Upward PressureGold continues to trade within a strong upward trajectory,showing consistent momentum and firm buyer engagement.The market structure indicates ongoing accumulation,with price maintaining stability after minor corrective movements.Buy-side activity remains dominant,reflecting confidence among institutional participants as the metal sustains its trend within an orderly channel.While short-term pullbacks may occur for liquidity rebalancing,the broader outlook remains decisively bullish as long as momentum persists and demand continues to support higher valuations.
Tradingview

TradeCityPro | Bitcoin Daily Analysis #198👋 Welcome to TradeCity Pro!
Let’s move on to the Bitcoin analysis. The price is in a very sensitive area, so it’s important to have a proper analysis.
⏳ 1-Hour Timeframe
Bitcoin is still near its support zone and is ranging around 110,420.
⭐ The top of the range is 111,714, and the price is forming a compression.
✨ At the same time, the RSI has formed a range between 30 and 50 and is oscillating.
📊 If 110,420 breaks, the probability of breaking the range increases significantly, and this level can serve as a good early short trigger.
📈 For long positions, we can open the first position on a break of 111,714. The next entry points would be 113,218 and 115,698.
🔔 Currently, market volume is very important and decisive; the volume favors sellers, which increases the probability of a bearish scenario. If this volume persists, Bitcoin’s support zone could break.
💥 However, if we see a change in volume and buying volume exceeds selling volume, we can expect Bitcoin to be supported in this area and move upwards.
❌ Disclaimer ❌
Trading futures is highly risky and dangerous. If you're not an expert, these triggers may not be suitable for you. You should first learn risk and capital management. You can also use the educational content from this channel.
Finally, these triggers reflect my personal opinions on price action, and the market may move completely against this analysis. So, do your own research before opening any position.

Possible Next Moves for Ethereum | ETH 1H Analysis D2👋 Hey everyone! Hope you’re doing great! - ❤️ Welcome to Satoshi Frame .
📅 Today we’re diving into the 1-hour Ethereum analysis. Stay tuned and follow along!
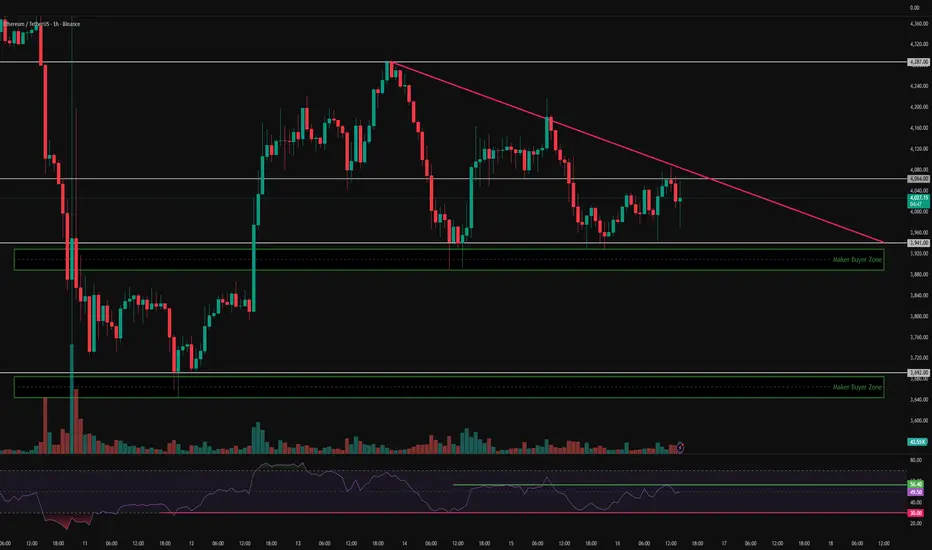
👀 On the 1-hour timeframe of Ethereum (ETH), we can see that ETH is currently moving inside a triangle compression structure, and it has now reached the final third of that triangle — meaning we’re waiting for a breakout to trigger a trade. The red trendline, which forms the upper edge of the triangle, acts as a dynamic resistance and overlaps with the $4064 resistance zone — creating a strong Long trigger setup. The bottom of the triangle acts as our Short trigger, where a confirmed break below it, combined with a Maker Buyer zone breakdown, could start ETH’s next move and break it out of this compression phase.
🧮 Looking at the RSI oscillator, ETH is currently fluctuating between 56.4 and 30. A breakout beyond either side of this range could enhance trading volatility and increase ETH’s momentum in the upcoming move.
🕯 Analyzing ETH’s volume, we can see that upon reaching the Maker Buyer zone, buying volume has increased — causing a noticeable reversal reaction from that level. If ETH continues to see increased buying pressure, it can break through resistance; otherwise, if it faces selling pressure, a large whale candle will be needed to break the Maker Buyer zone to the downside.
🧠 For Ethereum positioning, we can define two clear scenarios — since the price is near the end of its compression, these setups are relatively simple and well-defined:
🟢 Long Scenario: A breakout above the static + dynamic resistance at $4064, combined with RSI moving above 56.4 and increasing buying volume, could push ETH toward higher resistance levels.
🔴 Short Scenario: A break below the key Low at $3692, accompanied by a large whale candle cutting through the Maker Buyer zone and RSI dropping below 30 to enter its 1-hour OverSell area, would confirm bearish momentum. Note that if ETH dips slightly these days, many major projects, institutions, and even government-linked entities have been accumulating heavily within this identified Maker Buyer zone — so it’s wise to approach short positions with reduced risk exposure.
❤️ Disclaimer : This analysis is purely based on my personal opinion and I only trade if the stated triggers are activated .
TradeCityPro | LINKUSDT Early Entry Trigger!👋 Welcome to TradeCityPro Channel!
After the recent sharp drop in the overall crypto market, which was mainly triggered by negative news from China and the United States, Chainlink (LINK) also faced a noticeable correction —just like most major altcoins.
At the moment, LINK is trading below a strong daily resistance zone, which has previously acted as a key turning point for price action. The market seems to have already completed a pullback to this resistance, showing that sellers are still active in this region. This is a critical area — the next move from here could define whether LINK continues downward or begins a new bullish leg.
If the market manages to break above this resistance with strong momentum and confirmed volume, we can start looking for long opportunities on lower timeframes (like 4H or 1H). However, it’s safer to wait for confirmation of structure change, such as the formation of higher highs and higher lows, before entering.
For a short position, there are two clear scenarios:
If the price gets rejected from the 20.12 level, it can trigger a short setup early, especially if accompanied by bearish candlestick patterns like a shooting star or bearish engulfing.
A confirmed break below 17.07 would act as a stronger confirmation for continued downside momentum — showing that buyers are losing control and the bearish pressure remains dominant.
On the other hand, if the price breaks above 20.12, we’ll likely see a move toward the descending trendline that has been guiding LINK’s movement for several weeks. This zone could become another major decision point:
A rejection from the trendline might start another wave of correction,
But if LINK breaks above it and sustains momentum, it would signal the start of a potential bullish reversal, possibly leading to a trend continuation toward higher resistances.
🔹 Bullish confirmation: Break and retest above 20.12 with structure change on lower TFs.
🔹 Bearish confirmation: Breakdown below 17.07, or rejection from 20.12 with volume.
🔹 Neutral zone: Between 17.07 – 20.12, where price might consolidate before its next move.
Overall, LINK is currently in a decision-making phase, and traders should stay patient, waiting for clear breakout or rejection signals before entering any position.
📝 Final Thoughts
Stay calm, trade wisely, and let's capture the market's best opportunities!
This analysis reflects our opinions and is not financial advice.
Share your thoughts in the comments, and don’t forget to share this analysis with your friends! ❤️

TradeCityPro | HYPE: Watch Key Zones for Trend Reversal👋 Welcome to TradeCity Pro!
In this analysis, I want to review the HYPE coin for you. This is one of the crypto DEX projects, with a market cap of $13.26 billion, ranking 11th on CoinMarketCap.
📅 Daily Timeframe
On the daily timeframe, this coin had an upward channel that, after being rejected from its peak, started a downward move and managed to break the channel’s support.
💥 Currently, the price is forming a bearish structure, creating lower highs and lower lows.
✅ The support level the price is currently interacting with is 36.682, which has previously been an important low and is now reacting to it.
✨ A minor high has formed at 42.862, and if the price breaks this level, it could start forming a bullish structure again.
📊 With a break above 42.862, we can open a long position on lower timeframes. The important support level is 36.682, and breaking it could serve as a risky short trigger.
🔔 The main confirmation of the bearish trend will be given with the break of this coin’s support zone; for bullish continuation, the next wave would start after breaking the 55 level.
📝 Final Thoughts
Stay calm, trade wisely, and let's capture the market's best opportunities!
This analysis reflects our opinions and is not financial advice.
Share your thoughts in the comments, and don’t forget to share this analysis with your friends! ❤️

Can BTC break the 111681$ resistance? | BTC 1H Analysis D2👋 Hey everyone! Hope you’re doing great! - ❤️ Welcome to Satoshi Frame .
📅 Today we’re diving into the 1-hour Bitcoin analysis. Stay tuned and follow along!
👀 On the 1-hour timeframe of Bitcoin (BTC), we can see that — similar to USDT.D — it is moving within a range box, but inversely positioned near a Maker Buyer support and a multi-timeframe Low at $111,681. A confirmed breakout above this zone could push Bitcoin upward toward the box midline.
🧮 Looking at the RSI oscillator, we can see that it’s currently oscillating between the Oversell (30) Low and the static ceiling around 53. A breakout beyond either of these boundaries would likely signal the start of Bitcoin’s next move.
🕯 Recent volume on Bitcoin has increased as it reached the Maker Buyer zone — strong buying pressure from market makers has helped defend this support level effectively. Right now, Bitcoin sits just below a resistance area that will require a significant uptick in buying volume to break and confirm stability above it.
🧠 For Bitcoin positioning, we can consider that this current Low is very strong and unlikely to break easily, so the main focus should remain on long positions:
🟢 Long Scenario: Once Bitcoin breaks the multi-timeframe resistance at $111,681, combined with RSI surpassing the 53 threshold and a visible increase in buying volume, a long position setup becomes valid.
🔴 Short Scenario: Since the Maker Buyer support is very strong and USDT.D has been repeatedly rejected at its top, it’s better to wait until the Maker Buyer zone breaks with a large whale candle before considering short setups.
❤️ Disclaimer : This analysis is purely based on my personal opinion and I only trade if the stated triggers are activated .

ADM 1W - Bulls back in the field Weekly chart shows ADM breaking through the long-term trendline and holding above the support zone - a clean breakout + retest setup.
EMAs are stacked below the price, confirming bullish control. RSI remains healthy, leaving room for continuation.
✅ Support zone: 55–60
🎯 Target 1: 80
🎯 Target 2: 98.8
As long as price holds above the 60 level, momentum may continue toward the next resistance around 80, and eventually to 98.8.
Fundamentally , ADM stays strong in the agricultural and food supply chain - from grain processing to biofuels - sectors that remain essential regardless of market cycles.
In short: bulls are planting seeds for a solid harvest 🌾📈

US30: Rebound before the stormTechnical Outlook – Wall Street Index (30-Minute Chart)
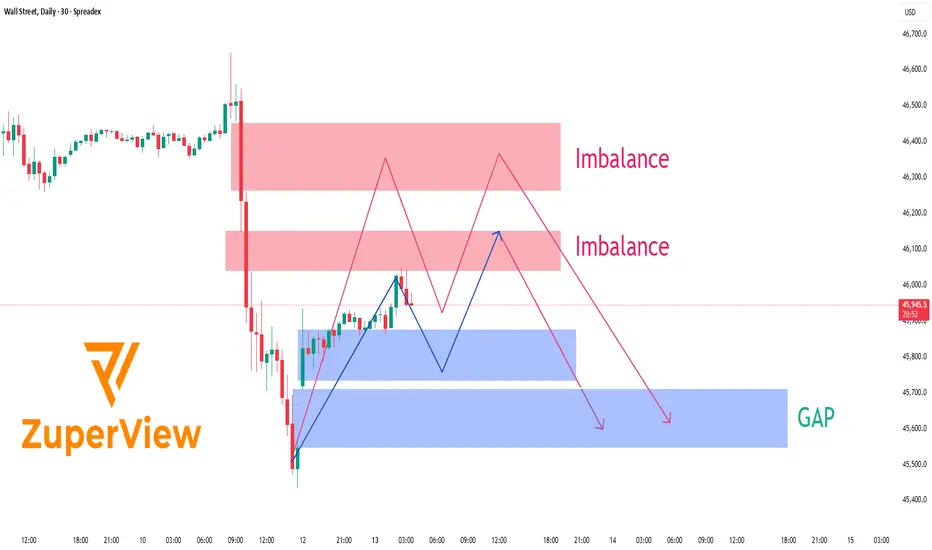
After the announcement that the U.S. will impose a 100 % tariff on Chinese imports, Wall Street ⚡ plunged sharply, leaving behind distinct Imbalance zones and an unfilled GAP lurking below current price levels.
At present, price is hovering around 45,950 💵, showing a modest rebound after tapping into a short-term demand zone. Above, two notable Imbalance areas stand out — around 46,000-46,150 and 46,250-46,450 - both formed as aggressive sell orders flooded the market following the latest wave of trade-war headlines 🌍.
The likely scenario 🎯:
Price could continue to retrace upward ↗️ to test one of these supply/imbalance zones before sellers re-enter the market. If selling pressure remains dominant, the index may resume its decline toward the GAP area around 45,500 - 45,650 📉, where liquidity is still unfilled and buyers may look to step back in.
Current price action indicates a corrective pullback rather than a full reversal. Trading volume is thinning 📉, candlestick patterns show signs of exhaustion 🕯️, and the upper imbalance zones remain untouched — all signaling that sellers still hold the upper hand.
________________________________________
🌍 Fundamental Context – U.S. vs. China Tensions Heating Up
On October 10, President Trump officially declared a 100 % additional tariff on Chinese goods, effective November 1, 2025 — the most aggressive move since the 2018-2019 trade war.
Beijing immediately condemned the plan, warning of “corresponding countermeasures”, including restrictions on rare-earth exports and higher port fees on U.S. vessels. While strong in tone, China has so far stopped short of announcing a direct tariff retaliation, signaling a cautious approach while keeping the door open for talks.
Washington, meanwhile, insists the measure aims to “protect American interests and reduce over-reliance on China’s supply chains,” but officials also noted that negotiations remain possible if China shows “substantive goodwill.”
Financial markets reacted swiftly 💥:
• U.S. and Asian equities dropped 2–3 % on average.
• USD strengthened, while gold and JPY rallied as safe-haven flows increased.
• Tech and industrial stocks with strong China exposure saw the largest losses.
Overall, risk sentiment remains fragile as investors brace for a prolonged phase of trade uncertainty.
________________________________________
💡 Trading Summary
Short-term structure favors a sell-the-rally approach. The market may retest upper imbalance zones before resuming its downtrend toward the 45,500 USD GAP area.
If U.S.–China tensions intensify further, downside momentum could accelerate. Conversely, any sign of renewed dialogue or tariff delay could trigger a short-term rebound — but bias remains bearish until the market reclaims 46,300 USD convincingly.
In short: patience, risk control, and reaction to headlines are key this week. ⚖️
Please like and comment below to support our traders. Your reactions motivate us to do more analysis in the future 🙏✨
Harry Andrew @ ZuperView
US30: Flash pump not enough to break resistanceSPREADEX:DJI Analysis – Weak flash pump signals a possible pullback ahead.
📊 Technical Overview
On the 30-minute timeframe, Wall Street (US30) has recently shown a quick rebound — a flash pump — after a strong flash dump earlier in the week. Price is now trading near the 46,400 – 46,500 area, right below the major resistance zone between 46,600 – 46,750 (highlighted in green).
Below, the support range around 46,050 – 46,200 (marked in red) remains the key demand area.
⚙️ Market Structure Insight
The recent flash pump recovered quickly from the previous drop, but the momentum appears insufficient to break through the prior flash dump zone. This imbalance often indicates a short-term exhaustion in buying pressure, meaning the market could need one more corrective leg before finding new strength.
🧭 Main Scenario
The most likely scenario is that price will move sideways or slightly pull back toward the 46,200 support zone before deciding its next major move.
• If buyers defend 46,200 successfully, the index could attempt another test of 46,700.
• However, failure to hold that support might open the door to a deeper correction.
💡 Personal View
The weak flash pump following the previous flash dump signals that the market is still in a consolidation and absorption phase. A short-term pullback could help reset momentum before a more sustainable trend emerges.
⛔ This analysis represents a personal technical perspective and should not be taken as investment advice. Always manage your risk before entering any position.
Please like and comment below to support our traders. Your reactions will motivate us to do more analysis in the future 🙏✨
Harry Andrew @ ZuperView

US100: Breakout signals a strong second bullish leg🧩 Market Context
On the 30-minute chart, SKILLING:US100 index shows renewed bullish momentum after a phase of sideways consolidation. Following a deep correction, price action has started forming higher highs and higher lows, suggesting that buyers are gradually regaining control.
🔍 Price Structure and Breakout
Price has recently broken out above a short-term consolidation zone and a rising trendline.
This breakout reinforces the short-term bullish bias and could mark the start of a second upward leg in the current recovery.
Statistically, when a breakout happens after tight accumulation, the next bullish leg often becomes equal to or larger than the previous one, as momentum builds and buyers gain confidence.
📈 Key Price Levels
• Resistance 1: 24,914 – prior rejection zone in the last upward move.
• Resistance 2: 25,074 – distribution area before the previous drop.
• Support: 24,700 – 24,750 (former resistance now acting as potential support).
⚙️ Trading Scenarios (for observation only)
• After the breakout, price may retest the previous resistance zone (around 24,700–24,750) before continuing higher.
• If buyers defend this level, the second bullish leg could extend toward 24,914 and possibly 25,074.
• Conversely, a close back below 24,700 may trigger a deeper pullback before any continuation attempt.
🧠 Summary
The technical structure on US100 favors a short-term bullish outlook. A successful retest of the breakout zone could pave the way for a second upward leg, potentially matching or exceeding the size of the previous rally.
______________________________________
📌 This analysis is for educational and technical purposes only. It does not constitute financial advice or a recommendation to buy or sell any asset.
Please like and comment below to support our traders. Your reactions will motivate us to do more analysis in the future 🙏✨
Harry Andrew @ ZuperView

SOLUSDT – Weak rebound, bears back in controlAfter a sharp drop on October 14, Solana made a slight recovery but quickly hit resistance at the downtrend line — where sellers stepped back in strongly. The $208 zone continues to act as a tight lid on price action, signaling that current buying pressure isn’t strong enough for a reversal.
With U.S.–China trade tensions still simmering, the overall crypto market — including SOL — remains under pressure. If the price fails to break above this descending trendline, SOL could likely fall back toward the $188 support zone, or even $175 in the next move.
In short, the main trend remains bearish, and current rebounds look more like opportunities for sellers to reload for the next push downward.

BTC/USDT – Downtrend ContinuesBitcoin is facing downward pressure after the escalation of US-China trade tensions. Although President Trump made more conciliatory remarks, which helped ease short-term concerns, the global economic uncertainty remains a major factor driving BTC/USDT into a downtrend.
On the chart, BTC/USDT is moving within a clear downtrend channel. Despite a slight recovery, the price is currently fluctuating around $113,129 and could continue to adjust towards the 106,500 USD and 101,800 USD targets in the near term.
With ongoing macroeconomic instability and no strong signs of recovery, Bitcoin may continue to decline in the short term.

GOLD Breakout area? What's next??#GOLD ... Now market have upside breakout and current resistance is is 4207-08
Keep close that area because sustain above means further rise expected.
SteroidsFX
Trade wisely

TradeCityPro | Bitcoin Daily Analysis #197👋 Welcome to TradeCity Pro!
Let’s go over the Bitcoin analysis; today Bitcoin is still in a downtrend, so let’s review the market together.
⏳ 1-Hour Timeframe
After the double top that was activated yesterday near the 0.5 Fibonacci level, Bitcoin entered a corrective phase after reaching the double top target.
✨ The double top peaks formed around 115,698, but after completing the downward move and starting the correction, the price created lower highs around 113,218, and now with the break of 111,975, a new high-volume downward move has started.
📊 The price is moving back toward the supply zone it had, and reaching this area is not a good sign for the upward trend we see on higher timeframes.
🔽 The more the price approaches this zone and reacts to it, the weaker the zone becomes, and the probability of it breaking increases in subsequent attempts.
✔️ Currently, this is the third time the price is approaching this zone, and each time it comes with higher volume and a stronger bearish structure; if this pattern repeats several times, the zone could break.
🔍 Whether the price breaks or finds support at this zone can determine the market’s direction for the upcoming period.
⚡️ If the zone breaks, Bitcoin could enter a corrective and range-bound phase for weeks or even months, and we wouldn’t be able to open positions effectively in that environment.
📈 If the zone holds as support, with a break above 115,698, we would get confirmation of Bitcoin’s bullish trend and could expect the next upward move to begin.
❌ Disclaimer ❌
Trading futures is highly risky and dangerous. If you're not an expert, these triggers may not be suitable for you. You should first learn risk and capital management. You can also use the educational content from this channel.
Finally, these triggers reflect my personal opinions on price action, and the market may move completely against this analysis. So, do your own research before opening any position.

XAUUSD | Gold Holds Firm as Buyers Dominate the MarketGold continues to demonstrate a strong and orderly bullish structure, with momentum sustained by a combination of market confidence and macroeconomic positioning. The metal’s consistent upward drive reflects ongoing demand for safety amid lingering inflationary concerns and uncertainty surrounding global economic recovery. Institutional accumulation remains visible, suggesting that investors are positioning ahead of potential policy adjustments and currency fluctuations.
The recent moderation phase appears to be a controlled pause rather than weakness, indicating that buyers are maintaining control while the market digests prior gains. Should current stability in yields persist and geopolitical tensions remain elevated, gold could extend its advance in the medium term, reaffirming its role as a key hedge within diversified portfolios.

MARA: shoulders done, now walk toward the targetOn the daily chart, MARA completed a textbook inverse Head & Shoulders reversal with a clear breakout above the descending trendline. A corrective pullback followed, and the price is now heading into the key buy zone at 15.21–15.77 - aligning with the 0.72 and 0.79 Fibonacci retracements, and the upper boundary of the broken channel. This is the area to watch for a potential continuation of the bullish impulse.
Volume on the breakout was above average, confirming strong buyer interest. The EMAs are trending below the price, supporting the upward structure. The first target is located at 21.57 (previous resistance), with a potential extension to 28.77 (Fibonacci 1.618).
Fundamentally, MARA remains highly correlated with BTC and crypto sentiment. As interest returns to crypto-related assets due to ETF flows and possible Fed easing, mining stocks like MARA gain attention. Recent reports also show improved production efficiency and lowered costs - a tailwind for bulls.
Tactically, the best setup would be a confirmed reaction from the buy zone — whether a strong candlestick formation, volume surge, or reclaim of a key level. If that happens, aiming for 21.57 and 28.77 becomes a solid plan.
The pattern played out - now it's time for the market to walk the talk.

ALVES Stock Analysis & CommentaryALVES Stock Analysis & Commentary
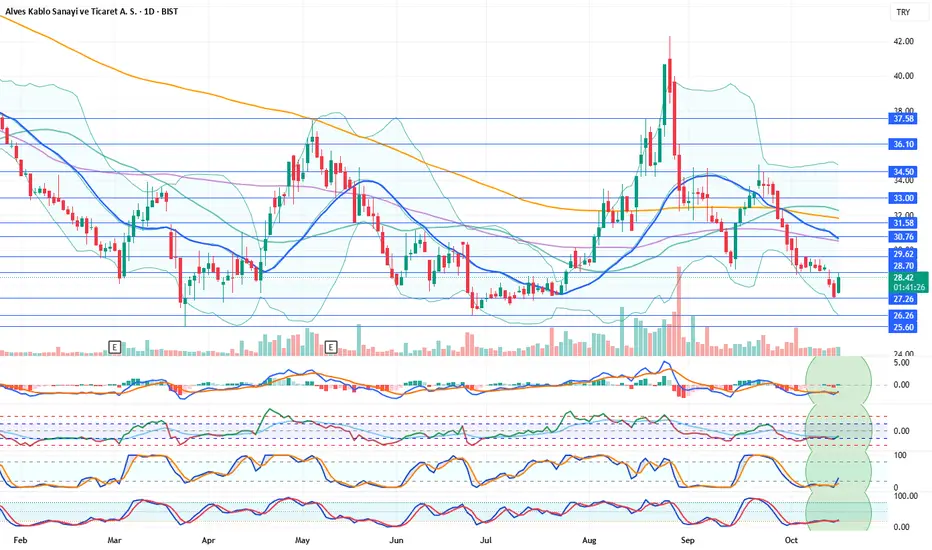
Daily technical indicators are positive. After forming support at 27.26, the stock appears to be recovering from that level. With indicators also showing positive momentum, we believe further recovery may occur. In a potential bullish scenario, the stock could have a chance to test the 21-day moving average (30.68).
Resistance Levels: 28.70 – 29.62 – 30.76 – 31.58
Support Levels: 27.26 – 26.26 – 25.60
We’d appreciate it if you could boost our posts and share them on your social media. 🚀
Legal Disclaimer:
The information, comments, and recommendations contained herein do not constitute investment advice. Investment advisory services are provided only within the framework of an investment advisory agreement to be signed between the investor and authorized institutions such as brokerage firms, portfolio management companies, and non-deposit banks.
The opinions expressed here are personal views and may not be suitable for your financial situation, risk profile, or return preferences. Therefore, no investment decisions should be made based solely on the information and opinions presented on this page.
UP TREND BUY Eurjpy will be buying and it would be best to follow the trend to the up side and make sure to maximise profits have set a buy limit to catch the trend trade

TradeCityPro | Ethereum: Break Key Levels for Bullish Momentum👋 Welcome to TradeCity Pro!
In this analysis, I want to examine Ethereum for you. The queen of the crypto market, with a $497 billion market cap, is ranked 2nd on CoinMarketCap.
⏳ 4-Hour Timeframe
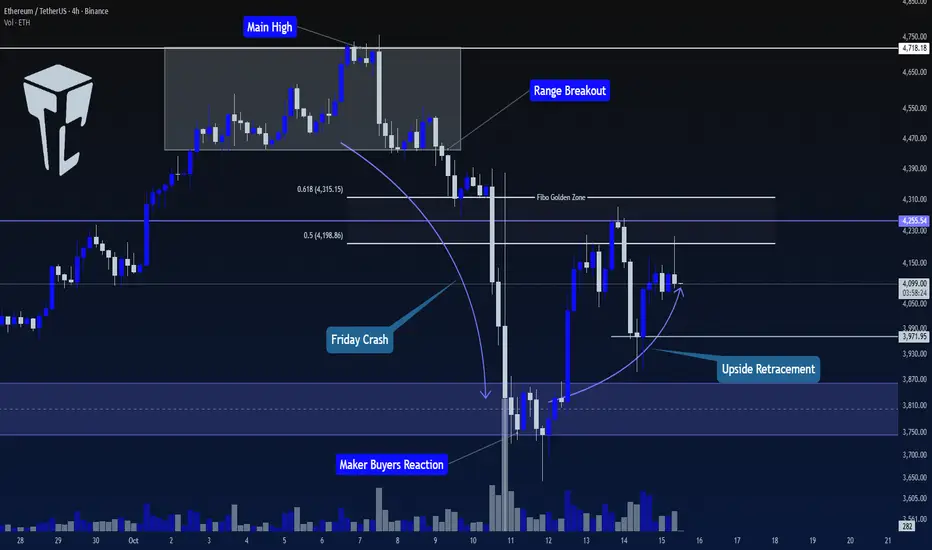
This coin, in the 4-hour timeframe, after breaking the range box at the ceiling and moving towards the $3800 level, is now in a corrective phase and has made an upward movement.
⭐ The $3800 range is a very important level for Ethereum, and this zone was not broken even during the Flash Crash that occurred on Friday, and it managed to hold the price.
🚀 Now, the price has moved towards the range between 0.5 and 0.618 Fibonacci, and has been rejected once from this zone.
📊 The volume has not increased significantly during this move and has mostly been range-bound, but since the price has created a higher low at the $3971 level, if the buying volume increases, we can get a bullish confirmation with a break of the $4255 level.
💥 Since this coin is bullish on higher timeframes and is currently undergoing a correction on lower timeframes, if the price gives us a small bullish confirmation, we can take advantage of it and open a long position.
💡 The main resistance for Ethereum is the $4718 level. Breaking this level will initiate the next wave for Ethereum on higher timeframes, such as weekly charts. Therefore, I will try to open a long position on Ethereum before this level is broken.
📈 The suitable trigger right now seems to be a break of $4255. With this break, the price can move towards $4718, and if this level is broken, we will have a very good and attractive entry point for a long position on Ethereum.
📝 Final Thoughts
Stay calm, trade wisely, and let's capture the market's best opportunities!
This analysis reflects our opinions and is not financial advice.
Share your thoughts in the comments, and don’t forget to share this analysis with your friends! ❤️
BUY GOLD Gold will be buying and I’ve set a buy limit to make sure I’ll be able to catch it at the right time join in with me but keep it all professional and not too risky as we are following the trend

Ethereum 1H Analysis – Key Battle at $4,278 Resistance | D1👋 Hey everyone! Hope you’re doing great!
💥 Welcome to Satoshi Frame — today we’re diving into the 1-hour Bitcoin analysis. Stay tuned and follow along!
👀 1-hour timeframe of Ethereum, and we can see that Ethereum, after the heavy drop it experienced, broke down from the 4278$ area and moved toward its lower support levels. A major support level has formed around the 3692$ area, where we saw strong buyer support, and they pushed the Ethereum price upward. After the upward movement and buyer support, as Ethereum approached its resistance in the 4278$ area, the buying volume decreased, and then buyers’ strength ended. Sellers, with strong momentum and multiple red candles, pushed the price down toward the 3941$ support, where the price was supported again. Now a higher low has formed compared to the 3941$ bottom, and the price is moving toward its key resistance area at 4278$.
🧮 We can see in the RSI oscillator that there is a key level around 70, which is the OverBuy boundary. If the fluctuation limit passes this area, Ethereum can break its resistance around 4278$.
🕯 Regarding volume, there is an educational note that when the price approached the 4278$ resistance, it faced a decrease in buying volume and was rejected from this area with many red candles. Now that the price is moving toward this resistance, if it is accompanied by an increase in buying volume, it increases the probability of breaking this resistance for us.
🧠 For the Ethereum position, a breakout of the 4278$ area is needed, and now if the price moves toward this area, it will form our second touch and create several scenarios for us.
↗️ First scenario for long position: breakout of resistance accompanied by an increase in volume and setting the trigger at 4278$, which gives us a large stop size and reaches its risk-to-reward ratio later.
↗️ Second scenario for long position: wait for the price to have a reaction to the 4278$ area and then create a higher high and higher low for us, and we can enter on the created higher low and place our stop below that same low.
❤️ Disclaimer : This analysis is purely based on my personal opinion and I only trade if the stated triggers are activated .

BTC 1H Box Breakout Setup | D1👋 Hey everyone! Hope you’re doing great!
💥 Welcome to Satoshi Frame — today we’re diving into the 1-hour Bitcoin analysis. Stay tuned and follow along!
👀 On the 1-hour timeframe of Bitcoin, we can see that after its recent drop, Bitcoin has entered a one-hour consolidation box. The top of this box is around $115,802, and the bottom is at $110,224. A breakout from this box could lead to the next impulsive move. Currently, Bitcoin’s price is near the midline of the box at $113,222 — and if it breaks and stabilizes above this level, Bitcoin could start moving toward the top of the box and potentially break above it.
Notice that Bitcoin reacted to the buyer-maker zone near the bottom of the box, showing a reversal pattern. With buying pressure pushing it upward and a higher low forming, the probability of a midline breakout has increased.
🧮 Looking at Bitcoin’s RSI oscillator, it’s currently near the static resistance around the 54 range. If RSI breaks and stabilizes above this level, long-trade momentum is likely to increase, which could help Bitcoin break through the midline and become more bullish.
🕯 Let’s first discuss the maker-buyer zone, which acts as a major support area for buyers and institutions that accumulate their positions here. This area tends to create counter-direction reactions in Bitcoin. Right now, Bitcoin has formed a higher low just below the midline and is showing increasing buying volume, with larger candle sizes appearing on the chart.
🧠 For Bitcoin’s trading setup, once the midline breaks, we can consider entering a position, forming a potential long scenario:
↗️ Long Position Scenario:
If Bitcoin breaks and stabilizes above $113,222, accompanied by an RSI breakout above 54 and a rise in buying volume, it could move toward the top of the box and provide a solid long opportunity.
❤️ Disclaimer : This analysis is purely based on my personal opinion and I only trade if the stated triggers are activated .

BTCUSD Plunges: USD Intensifies Downward Pressure!BTCUSD is currently in a downtrend, with the chart showing Bitcoin's price moving below a clear downward trendline. The resistance level at 116,100 USD remains a key point to watch. If the price fails to break this level, BTCUSD is likely to continue its decline towards the next support levels at 104,500 USD.
A strong increase in USD buying by hedge funds and asset managers, combined with rising trade tensions between the US and China, is driving the strength of the US dollar. As the USD strengthens, BTCUSD faces downward pressure, as risk assets like Bitcoin tend to decrease in value.
With fundamental factors supporting the USD and the chart showing a bearish adjustment, BTCUSD is likely to continue its downward trajectory in the short term, targeting the support zone at 104,500 USD.
