SUI 1D Analysis - Key Triggers Ahead☃️ Welcome to the cryptos winter , I hope you’ve started your day well.
⏰ We’re analyzing SUI on the 1-Day timeframe .
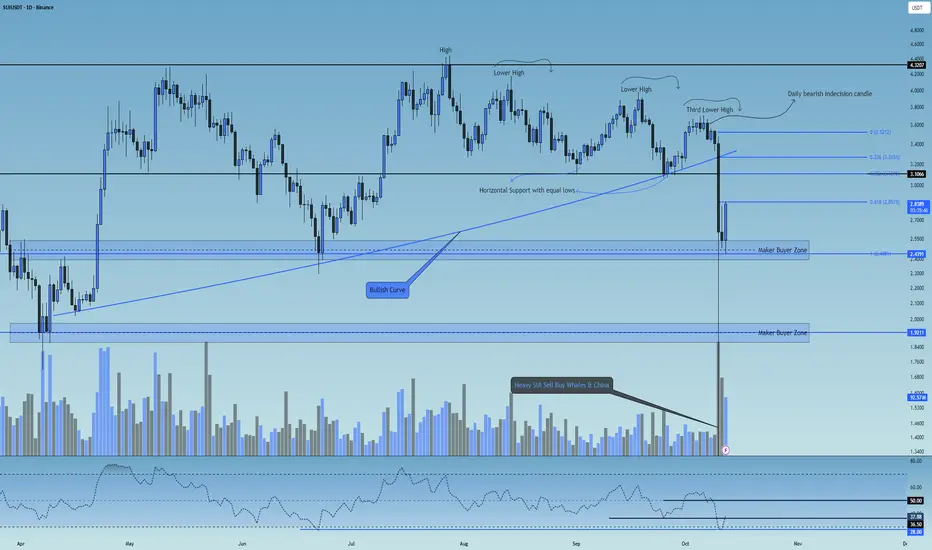
👀 On the daily timeframe of the SUI coin, we can see that SUI was moving along a slightly upward curved line, continuously forming higher highs and higher lows. After creating a top around the $4.3 zone, it faced a strong rejection and dropped toward the $3.3 support area. From there, it started forming lower highs and lower lows, practically entering a descending channel.
At the third and final lower high, SUI formed a strong daily indecision candle, which broke its multi-timeframe support at the $3.5 zone and continued moving downward. During the historic flash crash night of crypto, SUI opened around $3.4, then plunged to $0.5. Following exchange buybacks and market maker interventions, it made a massive upper shadow wick back toward the $2.6 zone, where it finally closed its daily candle.
🧮 Looking at the RSI oscillator, SUI experienced a heavy rejection from the 57 level, dropping below 50 and moving toward its daily oversold zone. The key RSI levels are currently around 36.5 and 50, with the 36.5 zone acting as the nearest crucial pivot level. A bounce from this region would slightly reduce the fear and FOMO of a deeper drop among traders.
🎮 A Fibonacci retracement drawn from $3.5 down to the market maker support zone at $2.43 reveals several important resistance levels. The 0.618 zone serves as a major resistance level—if this level breaks, it could lead to a higher low formation above $2.5, signaling a potential bullish reversal. The next resistance lies around 0.382, which is currently out of buyers’ immediate reach.
🕯 The recent candle sizes and volumes indicate strong selling pressure and rapid price teleportation downward. Signs of this drop could already be seen through the bearish indecision daily candle, but such an extreme dump couldn’t have been predicted purely by technicals. This crash was largely caused by Chinese fund managers selling their holdings, with large wallets entering risk-off mode, unwilling to take further losses. They, along with the Chinese government, sold off their SUI positions to prevent deeper damage—a case of “prevention is better than cure.”
During the recovery phase, exchanges executed significant buybacks, and because the price had fallen to major discounts, many market-making buyers placed strong limit orders at low levels, which helped drive the price back upward.
🪙On the weekly timeframe (SUI/BTC pair), this trading symbol has an extremely critical bottom—losing it could lead to a deep correction that would heavily impact SUI’s core structure. Thanks to buyer support and exchange buybacks, this bottom hasn’t yet been broken in the current weekly candle. There’s also a dynamic resistance trendline pressing down on its relative value; currently, SUI is in the final third of this price compression phase. If this trendline breaks, SUI could gain relative strength against Bitcoin and move upward.
🧠 Currently, SUI sits below its key resistance zone at $2.85. A break and daily close above this level could allow SUI to form a higher low compared to its flash crash bottom, retracing part of the recent drop and providing a better exit opportunity for many holders and traders.
This scenario will be updated with more precision and detail in future analyses.
❤️ Disclaimer : This analysis is purely based on my personal opinion and I only trade if the stated triggers are activated .
Tradingview
NIFTY 13th Oct'2025 | LONG | BULLISH Nifty : Bullish Trend
Long Entry
15m after sell-side lq sweep market likely move to bullish trend until above zone.

TradeCityPro | Bitcoin Daily Analysis #194👋 Welcome to TradeCity Pro!
Let’s analyze Bitcoin today, the market has calmed down a bit, and we can perform some analysis.
⏳ 1-Hour Timeframe
In the 1-hour timeframe, Bitcoin has reached a support level around $109,000 and has shown a reaction to this level.
⭐ After the heavy drop that occurred two days ago, the open interest and market volume have decreased significantly, which clearly indicates that market participants are currently indecisive.
✨ Yesterday, the price reacted to the support zone on Bitcoin, and a significant resistance was created around $112,420, which it has now reached again.
💥 The RSI oscillator has finally moved out of the Oversell zone, and it’s currently below the 50 level.
🧮 Although there’s still fear and a bearish momentum in the market, breaking the $112,420 resistance could be a very risky long trigger.
✔️ Personally, I’m waiting and observing. However, for those who like to open positions every day, breaking this resistance is the only long trigger I can provide.
💡 For a short position, we could enter after the price breaks below the level. I’m passing on this position for now and will wait for a confirmation to search for a short trigger after the price stabilizes below this zone.
❌ Disclaimer ❌
Trading futures is highly risky and dangerous. If you're not an expert, these triggers may not be suitable for you. You should first learn risk and capital management. You can also use the educational content from this channel.
Finally, these triggers reflect my personal opinions on price action, and the market may move completely against this analysis. So, do your own research before opening any position.

TradeCityPro | AVAXUSDT Further Decline or Time to Rise?👋 Welcome to TradeCityPro Channel!
✨ Let’s move on to Avalanche (AVAX) one of the older coins in the market, mostly active in the DeFi ecosystem with its own network and solid utility. It’s often considered a bull-run project due to its long-term relevance and use cases.
🌐 Overview of Bitcoin
Before we begin, let me remind you that we’ve moved the Bitcoin analysis section to a separate daily report at your request,
so we can go into more detail about Bitcoin’s condition, price action, and dominance:
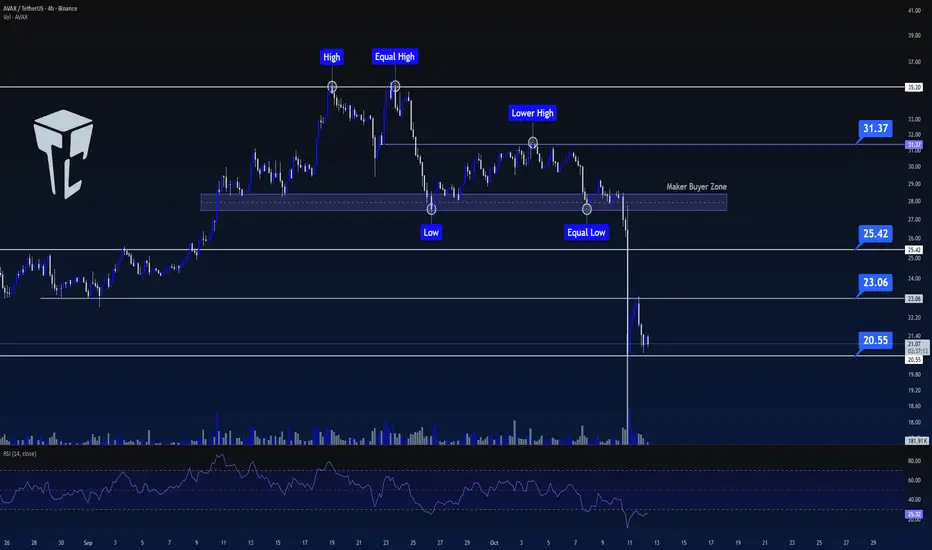
🕧 In the 4-hour timeframe, after the recent market crash, AVAX is trying to build a new structure and stabilize its price action.
🟢 Long Setup:
It’s still too early to go long, but AVAX has shown a partial recovery compared to other coins, and its drop hasn’t been as deep.
For a long position, we should either range here for a while and enter after a confirmed breakout above 23.04,
Or wait for a higher high and higher low formation to confirm a bullish structure before entering.
🔴 Short Setup:
The short scenario is clear if 20.57 breaks with volume, it would signal bearish continuation, and opening a short position would be reasonable.
📝 Final Thoughts
Stay calm, trade wisely, and let's capture the market's best opportunities!
This analysis reflects our opinions and is not financial advice.
Share your thoughts in the comments, and don’t forget to share this analysis with your friends! ❤️
TradeCityPro | SOL: Market Calms After Sharp Move & RSI Support👋 Welcome to TradeCityPro!
Let’s analyze SOL, one of the most popular Ethereum killers with a market cap of $99.9 billion, currently ranking 6th on CoinMarketCap.
⏳ 4-Hour Timeframe
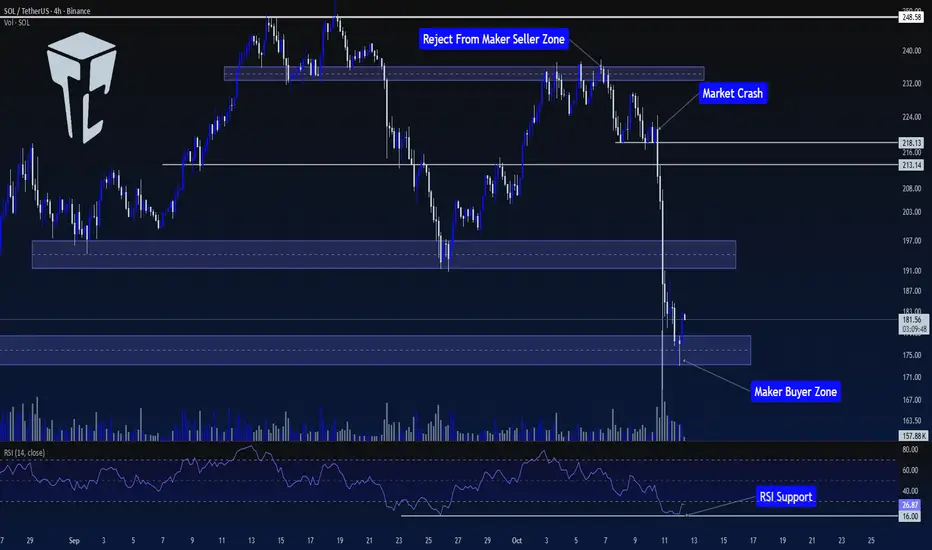
In the previous analysis, we had a Maker Buyer zone around $235. In that analysis, I mentioned that breaking this zone would be an early trigger for breaking $248.58.
🔍 However, the price never managed to sustain above this level, and after getting rejected from this zone, the price entered a corrective phase, forming a support at $218.13.
📊 After the price bounced from $218.13 for the first time, it failed to set a new high in line with previous highs and instead formed a lower high. The price returned to $218.13 again.
✔️ With the breakout of this level, coinciding with news between China and the U.S., the price started a sharp downward move, breaking through the $213.14 support.
✨ Over the course of 2-3 candles, SOL made a sharp move towards the first Maker Buyer zone, breaking it and reaching the second Maker Buyer zone.
💫 Naturally, there was a significant increase in selling volume during this move, and RSI dropped to 16, where it found support.
🧩 Currently, the market seems to have calmed down, with RSI still in the Oversell zone, but volatility has significantly decreased.
💡 Although the market has calmed, I believe the price needs to build a more structured setup before finding valid triggers, and the market conditions are not ideal for opening positions right now.
💥 So, for now, I won’t provide any triggers on this coin and will wait for more structure to form before making a better decision to open a position.
📝 Final Thoughts
Stay calm, trade wisely, and let's capture the market's best opportunities!
This analysis reflects our opinions and is not financial advice.
Share your thoughts in the comments, and don’t forget to share this analysis with your friends! ❤️
YTHUSDT Analysis – The Biggest Market Crash Yet!👋 Welcome to TradeCityPro Channel!
🌐 Overview of Bitcoin
Before we begin, let me remind you that we’ve moved the Bitcoin analysis section to a separate daily report at your request, so we can go into more detail about Bitcoin’s condition, price action, and dominance:
🌙 Last night, the crypto market witnessed a massive liquidation of nearly $19 billion, marking one of the biggest crashes in the history of digital assets.
📈 At this point, trading or buying in these zones isn’t logical it’s better to stay out of the market for a few days, watch the price action, and let volatility settle before making any moves.
🔥 Weekly Time Frame
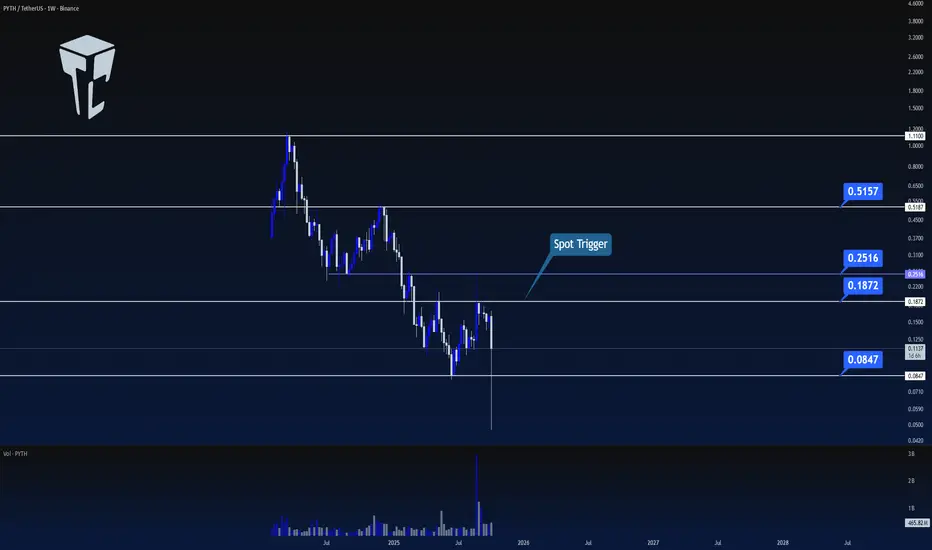
After a 92% drop from its all-time high, PYTH is currently consolidating below the resistance level at $0.1851.
This area is crucial it’s acting as both a psychological and technical barrier where the next trend direction will be defined.
🟢 Spot & Long Entry Setup
⛏ If this weekly candle turns green and we see confirmation, that could become one of the best bullish triggers for accumulation.
However, the main confirmation will be the breakout above $0.1851, which would give us a solid long entry setup.
✍️ Personally, I’m planning to open a long futures position once $0.1851 breaks, and if we later break above $0.2532, I’ll use my futures profits to buy PYTH in spot and hold for a potential longer-term recovery.
📝 Final Thoughts
Stay calm, trade wisely, and let's capture the market's best opportunities!
This analysis reflects our opinions and is not financial advice.
Share your thoughts in the comments, and don’t forget to share this analysis with your friends! ❤️
ETH 1D Analysis - Key Triggers Ahead | Day 32☃️ Welcome to the cryptos winter , I hope you’ve started your day well.
⏰ We’re analyzing ETH on the 1-Day timeframe .
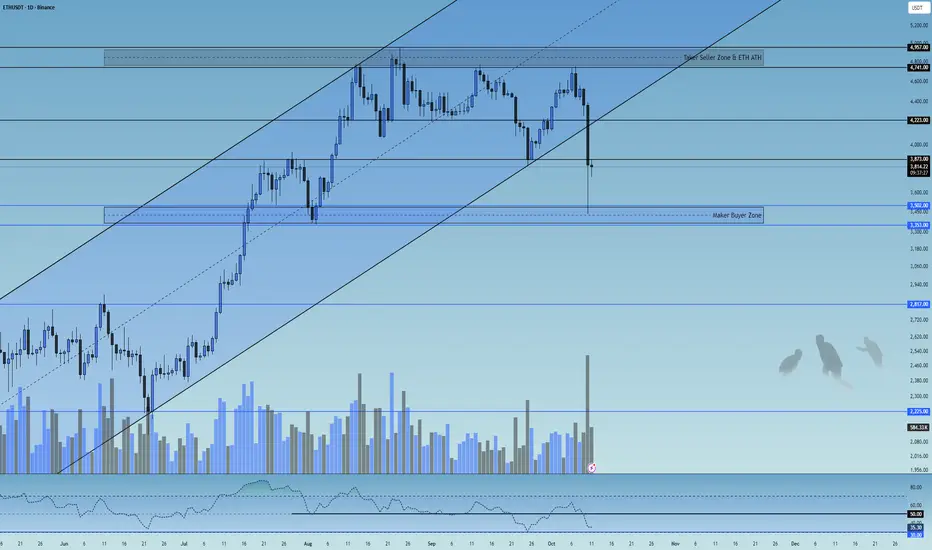
👀 On the Ethereum daily timeframe, we can see that after the historic economic war between the U.S. and China, Ethereum broke its ascending channel with a high-volume whale candle and has now managed to stabilize below this channel. Currently, Ethereum is in a critical decision-making zone, with two key resistance levels at $3,873 and $4,223.
A break and confirmation above these zones, especially $4,223, could lead to a bullish continuation; otherwise, a breakdown below the channel support may trigger a deep correction and cause Ethereum to enter a risk-off phase on the higher timeframe (weekly).
🧮 Looking at the RSI oscillator, after crossing down from the 50 level, it is now heading toward the 30 and oversold region. These two zones — 50 and 30 — are our key RSI levels, and when volatility crosses these zones, it can be accompanied by a significant increase in trading volume.
🕯 The recent daily candle of Ethereum has shown a massive amount of sell volume, with an open around $4,400 and a close below $3,900 (ignoring the shadow). This indicates strong selling pressure — if buyers fail to hold Ethereum above $4,200, we could see further correction and selling pressure ahead.
🧠 Currently, there’s no specific trigger for Ethereum, but a trading range will likely form in this zone until the end of the week.
A break of either the top or bottom of this range across multiple timeframes could give us a potential long or short position.
❤️ Disclaimer : This analysis is purely based on my personal opinion and I only trade if the stated triggers are activated .
TradeCityPro | Bitcoin Daily Analysis #193👋 Welcome to TradeCity Pro!
Let’s analyze Bitcoin, yesterday, a phenomenon called a Flash Crash occurred, and the market experienced a massive drop. Let’s review what happened and where the market stands now.
⏳ 4-Hour Timeframe
Before diving into the chart, let’s first understand what happened in the broader market.
🔍 Yesterday, the U.S. restricted the sale of certain computer chips to China,
and in response, China halted exports of five rare elements to the U.S.
📰 Then, the U.S. reimposed heavy tariffs on China, and China raised duties on American ships.
✨ These escalating tensions severely impacted global markets — and we witnessed the largest Flash Crash in Bitcoin’s history.
📉 A total of $19 billion worth of positions were liquidated, marking the highest figure ever recorded in crypto history.
To put that into perspective, during the COVID crash, only about $3 billion was liquidated — a massive difference.
🔔 Interestingly, Bitcoin dropped less compared to most altcoins and managed to recover partially.
However, altcoins like TON, AVAX, ARB, and SUI (each with their own networks) saw brutal crashes, many with wicks of 60–70% downward.
📊 Now, looking at the chart, yesterday, Bitcoin was ranging above the $120,835 zone.
🧮 Once the geopolitical tension began, the price started a strong downward move, breaking below its key support.
🔽 After two large red candles and a close below support, the third candle formed a 12% wick, dropping as low as $102,000.
✔️ Following that, the price quickly recovered and is now consolidating above the $109,000 support zone.
💡 At the moment, in such a highly volatile environment, finding valid triggers and opening new positions isn’t ideal.
🔑 The price action has been driven mostly by news and panic, so it’s best to wait until the market stabilizes and the effects of these developments fade away.
❌ Disclaimer ❌
Trading futures is highly risky and dangerous. If you're not an expert, these triggers may not be suitable for you. You should first learn risk and capital management. You can also use the educational content from this channel.
Finally, these triggers reflect my personal opinions on price action, and the market may move completely against this analysis. So, do your own research before opening any position.

BTC 1D Analysis - Key Triggers Ahead | Day 54☃️ Welcome to the cryptos winter , I hope you’ve started your day well.
⏰ We’re analyzing BTC on the 1-Day timeframe .
👀 After the start of the trade war between the United States and China, news was released about a 100% tariff imposed by the United States on China. The crypto market experienced an unbelievable heavy drop (flash crash) last night, which from a technical point of view was completely unexpected and caused the biggest financial loss in the history of crypto.
👍 On the Bitcoin chart and in the daily timeframe, we can see that it is inside a very strong ascending channel, which even with last night’s drop has not closed below its channel body. Currently, Bitcoin is ranging with support at the bottom of the channel, and since it’s the weekend, the market volume has decreased sharply, and we are in a state of uncertainty until the new week’s open.
💡 Note that Bitcoin has not yet entered a trend reversal for the start of its heavy drop. The reversal zone that I specified in the analysis is between $108,960 and $107,521. With a break and confirmation below this zone, Bitcoin can experience a deeper correction and end its long-term primary trend and enter a secondary trend. We can also consider this zone as a distribution area.
Also note that Bitcoin’s return inside the channel has been supported by strong buyers, which has caused this uncertainty. In summary, Bitcoin has a very important resistance in the $114,351 zone, and with a break and confirmation above this area, it can move upward and turn the flash crash into a continuation move. In the continuation of the analysis, we will also use indicators and volume to reach the best conclusion.
🧮 In the RSI oscillator, we can see that after the selling pressure and increase in volatility, it moved downward and easily crossed the 50 zone. We have now defined two key RSI zones:
Zone 50 can be our long trigger area.
Zone 37, where if volatility passes below this level, Bitcoin can move toward the oversold area in its daily timeframe and experience a deeper correction.
🕯 First, let’s talk about volume — the selling pressure was so strong that it pushed the Bitcoin price near $102,000, and then it faced support from buyer makers (those who buy with market-type orders), which brought the price back above $110,000. The size of Bitcoin’s recent candle has been very strong and large, showing the great power of the sellers. With the increase in selling volume and continuation of the tariff war, the market can enter a risk-off state in higher timeframes, and investors may sell their Bitcoins, putting more selling pressure on BTC.
🧠 With the intensification of the tariff war between the U.S. and China, Bitcoin may start its secondary trend after weeks and months of bullish movement, but we still can’t make a definite decision about this issue. So we are waiting for the break of the defined zones in the analysis to make the best decision. Last night’s event was truly painful — a big experience and lesson for all of us that if we can manage our capital, we can have the best results relative to the market. However, last night will be remembered as the biggest financial loss in crypto history.
❤️ Disclaimer : This analysis is purely based on my personal opinion and I only trade if the stated triggers are activated .

TradeCityPro | ENA: Market Shake-Off and Support Rebuild Zone👋 Welcome to TradeCity Pro!
In this analysis, I’ll review ENA, one of the DeFi projects that currently holds a market cap of $3.02 billion, ranking 36th on CoinMarketCap.
📅 Daily Timeframe
First, let’s take a look at the market as a whole — yesterday, some extremely unusual events occurred, which I’ll explain in detail in Bitcoin’s analysis.
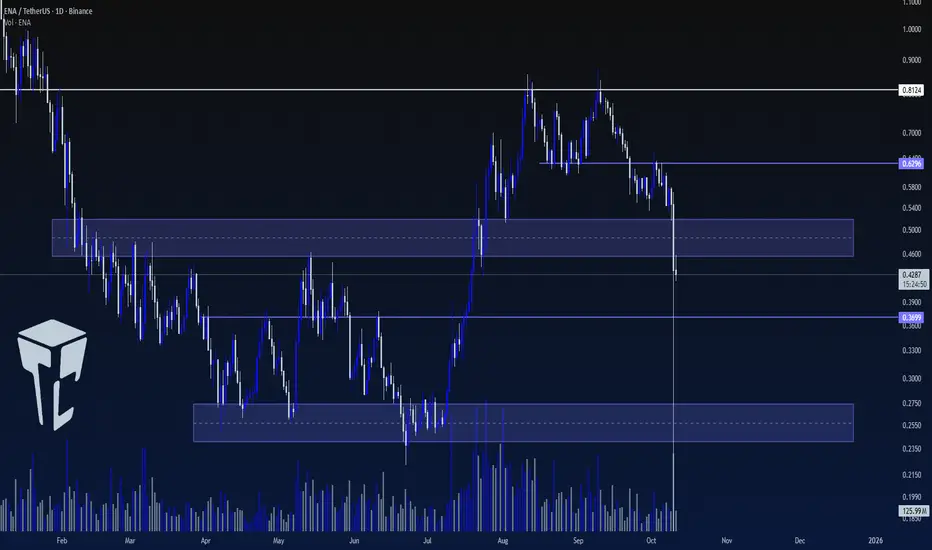
✨ For now, the result of these events has been a sharp market decline, which has also affected this coin. ENA has now stabilized below the $0.5 support zone and printed a very long shadow to much lower levels.
🔍 Currently, the price is far below its last major high at $0.8124 and has formed a lower high at $0.6296.
✔️ There was a support zone around $0.5, but since the price has closed below it, the next key support lies at $0.3699.
📊 The final strong support zone is around $0.25, which is considered ENA’s main support level.
💥 For now, it’s better to stay on the sidelines and wait for the market to build a new structure. The recent move was highly emotional and volatile, making it difficult to accurately interpret the market’s behavior at the moment.
📝 Final Thoughts
Stay calm, trade wisely, and let's capture the market's best opportunities!
This analysis reflects our opinions and is not financial advice.
Share your thoughts in the comments, and don’t forget to share this analysis with your friends! ❤️
USDCHF 1D – the dollar wakes upAfter a long decline, the pair finally shows some life - on the daily chart we have a clean breakout from the falling wedge followed by a retest.
Price now holds inside the buy zone (0.795–0.803) - the perfect base for a potential bullish move.
Technically, the setup looks solid:
✅ breakout confirmed
✅ retest completed
✅ volume rising
✅ momentum turning bullish
The first resistance sits at 0.808, where a minor pause could appear.
If buyers hold control above that level - the path to 0.823 (1.618) and later 0.848 (2.618) opens up nicely.
Structure remains bullish as long as the buy zone stays intact.
And remember: you don’t fight the wedge - you ride the breakout.

Gold Trading Strategy Based on News (News Trading)Hello everyone,
When it comes to gold, few things move the market faster and stronger than economic news. Data releases such as CPI, NFP, or Fed interest rate decisions can cause gold prices to swing sharply within minutes — creating perfect opportunities for traders who react in time. For example, a higher-than-expected CPI report often pushes gold prices up, while a strong NFP can send them plunging instantly.
To take advantage of these moves, you must first understand how each type of news impacts gold. A high CPI signals rising inflation — gold tends to climb as investors seek protection against inflation. A low CPI usually strengthens the USD, pushing gold lower. A strong NFP indicates economic growth, leading to USD gains and gold weakness, while a weak NFP weakens the USD and boosts gold. As for the Fed’s interest rate decisions : rate hikes strengthen the USD and pressure gold, while rate cuts do the opposite.
The core strategy here is to trade immediately after the news release . If the outcome exceeds expectations, gold typically reacts sharply: high CPI or weak NFP → buy, strong NFP or low CPI → sell . The key is quick execution and strict risk management .
The Economic Calendar on TradingView is your best ally — it helps you track upcoming data releases in real time. Before the news, identify the market expectation and prepare your buy or sell setups. Once the data drops, react based on price action and always set a proper Stop Loss : below support for buys, above resistance for sells, and never risk more than 1–2% of your account per trade .
This strategy’s appeal lies in the high volatility, rapid opportunities , and strong liquidity , which allow for efficient entries and exits. Traders who can stay calm and react correctly can capture sharp profits from news shocks — while those unprepared often get caught in the chaos.
In short, trading gold based on news is a powerful strategy — but it only works if you master timing, manage your risk carefully, and stay updated with tools like the Economic Calendar.
Are you ready to catch gold’s next big move when the news hits?
TradeCityPro | NEARUSDT Ready for a Spot Buy!👋 Welcome to TradeCityPro Channel!
Let’s take a look at NEAR, which is currently moving nicely within a strong daily box, and it seems like a breakout could happen any moment!
🌐 Overview of Bitcoin
Before we begin, let me remind you that we’ve moved the Bitcoin analysis section to a separate daily report at your request, so we can go into more detail about Bitcoin’s condition, price action, and dominance:
📆 Daily Time Frame
Keep in mind that weekly and daily boxes in crypto charts are very important, because the breakout from these zones usually defines the start of a major trend.
Typically, the target range after a breakout is about the same size as the box itself for example, if the box is 10%, we might expect a similar 10% move after the breakout.
Currently, in the daily time frame, NEAR is moving inside a large box between $1.891 and $3.172, while forming higher lows, which is a bullish sign.
Recently, it also found support at the box midline, which is another strong signal of buyer activity, and the price is following a parabolic curve pattern, showing building momentum.
🚀 Spot & Long Position Setup
If NEAR breaks above $3.172, that’s our main trigger to enter a spot buy and even open a long futures position this breakout could mark the start of a strong bullish leg.
🔻 Short Position Setup
However, if the parabolic curve breaks and the price forms a lower high, then a break below $2.616 in lower time frames could trigger a short position opportunity, signaling a potential pullback phase.
📝 Final Thoughts
Stay calm, trade wisely, and let's capture the market's best opportunities!
This analysis reflects our opinions and is not financial advice.
Share your thoughts in the comments, and don’t forget to share this analysis with your friends! ❤️

BTC 1H Analysis - Key Triggers Ahead | Day 53☃️ Welcome to the cryptos winter , I hope you’ve started your day well.
❤️ I sincerely apologize to everyone in the channel — I’ve been down with a cold for several days. Now, let’s dive into the 1-hour Bitcoin analysis.
⏰ We’re analyzing BTC on the 1-Hour timeframe .
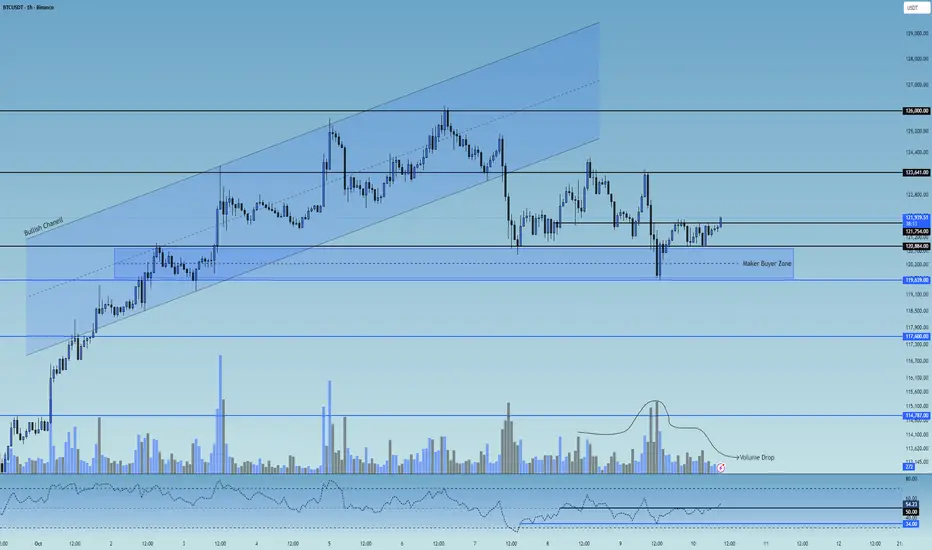
👀 In the 1-hour timeframe, after a strong bullish rally, Bitcoin broke below its ascending channel and moved toward the $121,000 support zone. From there, increased buying volume pushed the price upward, but it got rejected from the $123,600 resistance** and pulled back, creating a long trigger at that zone.
As it moved toward lower support levels, it formed a micro buyer zone between $119,640 and $120,884, where each time price enters this zone, Bitcoin experiences noticeable buying pressure.
🧮 Looking at the RSI oscillator, after ranging below the 50 level, it’s now trying to break above it. The 50 level has become a **strong static resistance, while there’s swing support near 34.
If the RSI breaks out of these marked zones, it could trigger stronger volatility and expand both **short and long trading opportunities.
🕯 The size and volume of recent candles on the 1-hour chart show range-bound movement, weak momentum, and market indecision, forming a **multi-timeframe trading range** where the top and bottom boundaries act as trigger zones.
The **micro buyer zone is where buyers aggressively defend price through market orders, preventing further downside — a reversal candle forming inside this zone is a strong example of that.
▶️ **Today’s economic news related to U.S. monetary policy can impact the market significantly. Since Bitcoin is currently in a small trading range, upcoming volatility spikes from the news could provide short-term setups.
↗️ Risky Long Scenario:
Look for a breakout above the marked $121,754 zone, accompanied by an engulfing candle, **indecision signal, SMA-7 confirmation, and increasing volume in the direction of the breakout — especially if the news comes out risk-on (positive for markets).
📉 Very Risky Short Scenario:
If price breaks below the micro buyer zone and loses the swing RSI support near 33, Bitcoin could enter a deeper correction.
However, note that a drop in Bitcoin’s price often increases its attractiveness compared to other assets, so avoid rushing into shorts.
❤️ Disclaimer : This analysis is purely based on my personal opinion and I only trade if the stated triggers are activated .
TradeCityPro | Bitcoin Daily Analysis #192👋 Welcome to TradeCity Pro!
Let's dive into Bitcoin analysis. Today, Bitcoin is still in a consolidation and range-bound phase. Let’s take a look at the current market conditions.
⏳ 1-Hour Timeframe
In yesterday’s analysis, Bitcoin was in the process of breaking the $120,835 level. I mentioned that I wasn't opening any short positions yet, but a rejection of this downward movement could be a good sign for a potential upward move.
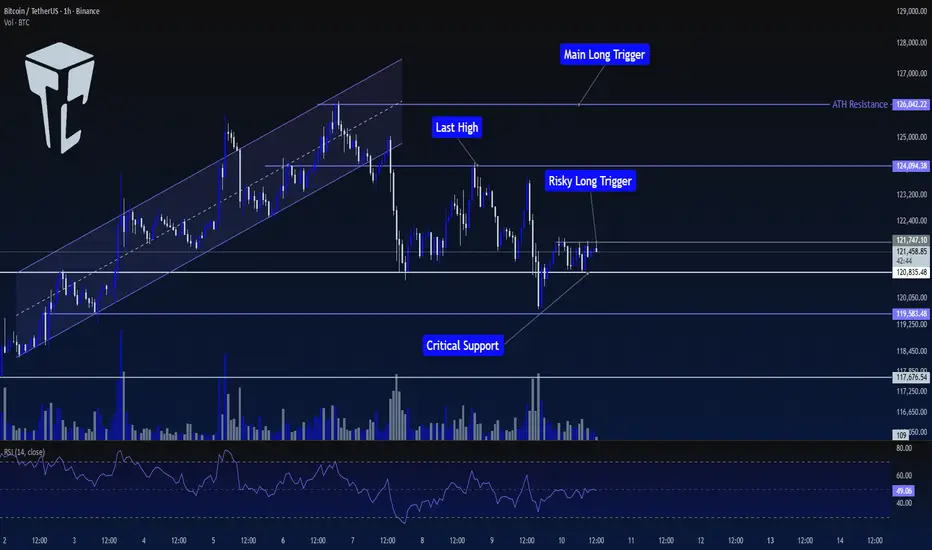
⭐ This scenario played out, and the price has now moved back above $120,835, which gives us an opportunity to look for long triggers.
✔️ One trigger that has formed is $121,747, which can be used as a risky trigger for a long position.
📊 Market volume has decreased slightly, so it’s better to wait for an increase in volume when this level is broken, as that would raise the likelihood of an upward move.
📈 The next reliable long triggers we have are $124,094 and $126,042. These triggers are more reliable for a position, but they are currently farther from the price, so the chance of them activating today is lower.
💥 For short positions, I'm still not focusing on them and prefer to focus on long positions. Therefore, I currently don’t have any short triggers to provide.
❌ Disclaimer ❌
Trading futures is highly risky and dangerous. If you're not an expert, these triggers may not be suitable for you. You should first learn risk and capital management. You can also use the educational content from this channel.
Finally, these triggers reflect my personal opinions on price action, and the market may move completely against this analysis. So, do your own research before opening any position.
TradeCityPro | NEAR: Breakout Opportunity and Potential Uptrend👋 Welcome to TradeCity Pro!
In this analysis, I’ll review NEAR, one of the Layer 1 and AI crypto projects, with a market cap of $3.9 billion, currently ranked 35th on CoinMarketCap.
⏳ 4-Hour Timeframe
This coin is showing an upward trend against Bitcoin and is currently in a very important resistance zone.
✨ Since being supported at the $2.589 level, the price has reacted multiple times to this zone, and it has formed a higher low at $2.832.
📊 At present, the price is engaged with a supply zone, which it has encountered several times, and is now reaching it again with increased buying volume.
🎲 Breaking this resistance zone will initiate a new upward move for this coin. The main trigger for confirming this move is a break at $3.211.
✔️ We can use the $3.211 break as a trigger for a long position on this coin. Additionally, if the RSI enters Overbuy, the upward movement could become much sharper and more volatile.
📝 Final Thoughts
Stay calm, trade wisely, and let's capture the market's best opportunities!
This analysis reflects our opinions and is not financial advice.
Share your thoughts in the comments, and don’t forget to share this analysis with your friends! ❤️

AUDCHF 1D - wedge falls, price risesOn the daily chart AUDCHF shows a classic falling wedge, already broken to the upside with a retest of the 0.5250 entry zone. Price is consolidating above this level, giving bulls a chance to build momentum. The nearest targets are 0.5295, followed by 0.5374 and 0.5448. Moving averages are flattening, while RSI, recovering from seller pressure, supports a potential upward trend.
Fundamentally , the pair reflects the tug-of-war between risk appetite and safe-haven demand. The Aussie gets moderate support from commodity strength, while the franc remains a defensive play. If global risk appetite stays firm, capital is more likely to flow out of CHF into higher-yielding currencies like AUD.
Tactical plan: consider longs around 0.5250, with targets at 0.5295, 0.5374, and 0.5448. If bulls hold above the breakout zone, the structure may turn into a solid bullish leg.
The only question is: will the franc stay defensive while the Aussie fires up the barbecue?

TradeCityPro | ATOMUSDT Ready for a Sharp Drop!👋 Welcome to TradeCityPro Channel!
Let’s analyze ATOM (Cosmos) — one of the older and more established coins in the market. Personally, I’ve been holding and staking this one for quite a while.
🌐 Overview of Bitcoin
Before we begin, let me remind you that we’ve moved the Bitcoin analysis section to a separate daily report at your request, so we can go into more detail about Bitcoin’s condition, price action, and dominance:
📊 Higher Time Frames
On the higher time frames, ATOM has been ranging for a long period of time and interestingly, it has even formed a smaller range inside its main range.
Currently, it’s oscillating near the bottom support of that larger range, showing weakness.
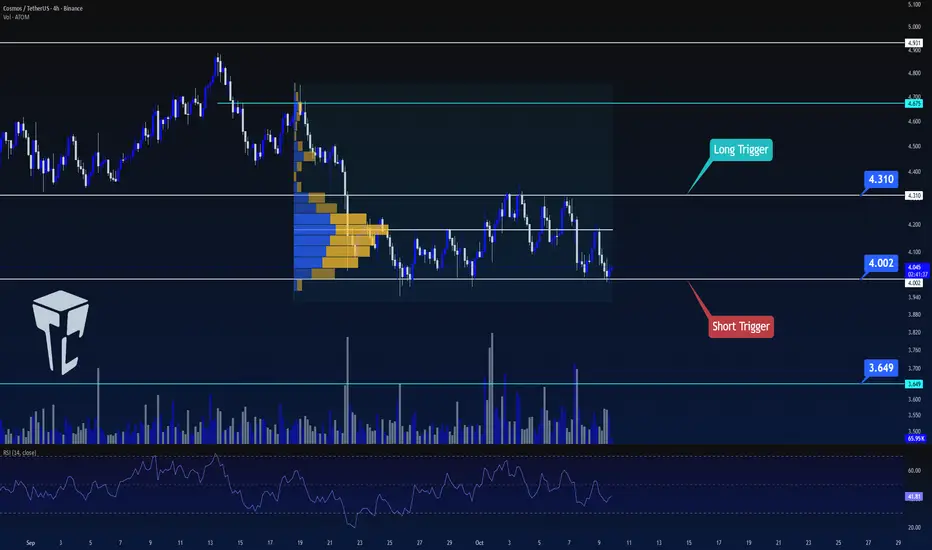
🕓 4H Time Frame
In the 4-hour chart, the price remains stuck inside a range between $4.002 and $4.310.
However, this time it has been rejected from the midline, which increases the likelihood of losing the lower support.
📉 Short Position Setup
If the price breaks below $4.002 with increasing volume and momentum, opening a short position would be completely logical and I’ll personally be taking that short setup as well.
📈 Long Position Setup
For a long position, patience is key.
Other coins like MNT, HYPE, and AVAX currently show stronger bullish potential, but if ATOM breaks above $4.310 and starts forming higher highs and higher lows, we can then begin to shift our bias to bullish.
📝 Final Thoughts
Stay calm, trade wisely, and let's capture the market's best opportunities!
This analysis reflects our opinions and is not financial advice.
Share your thoughts in the comments, and don’t forget to share this analysis with your friends! ❤️
TradeCityPro | Bitcoin Daily Analysis #191👋 Welcome to TradeCity Pro!
Let’s get into Bitcoin analysis. The market is still in a ranging phase, so let’s take a look at today’s triggers together.
⌛️ 1-Hour Timeframe
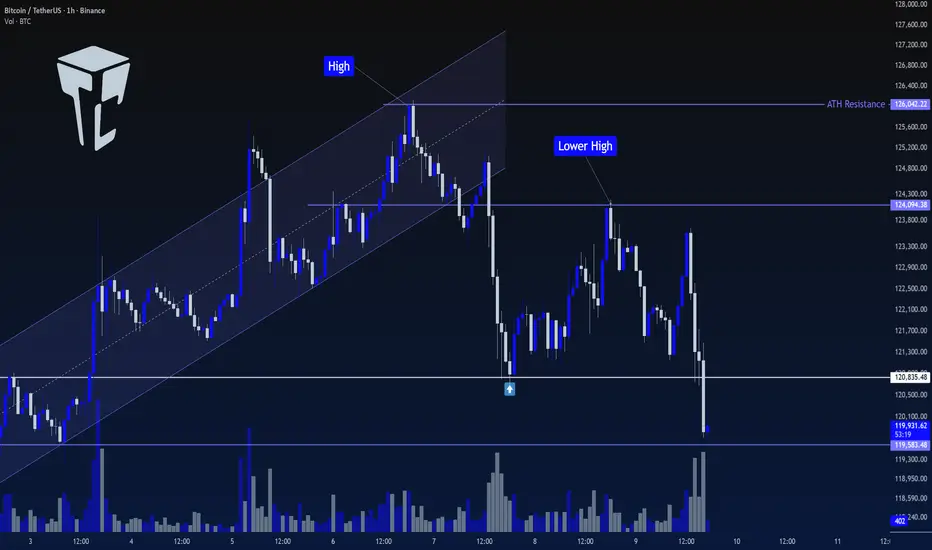
In this timeframe, Bitcoin is still consolidating and has formed a new range high around 124,094.
✔️ Right now, the price is near the bottom of the range box it has created and is on the verge of breaking below it.
✨ If the bottom of the box breaks, price could move toward lower levels.
📊 If selling volume continues to increase, the downward move could extend further, and Bitcoin may correct to even deeper zones.
🎲 However, if this move turns out to be a fake breakdown, and we see reversal structures such as a V-pattern, we could look for a long trigger.
🔑 I still don’t see Bitcoin as being in a downtrend. In my view, every correction the market makes is still healthy and supports the continuation of the broader bullish structure, helping maintain the strength of upcoming legs.
⭐ For now, since momentum has turned bearish on the lower cycles, I don’t have any new triggers to give based on my strategy. In this phase of the market, I prefer to wait until price builds more structure.
❌ Disclaimer ❌
Trading futures is highly risky and dangerous. If you're not an expert, these triggers may not be suitable for you. You should first learn risk and capital management. You can also use the educational content from this channel.
Finally, these triggers reflect my personal opinions on price action, and the market may move completely against this analysis. So, do your own research before opening any position.
TSLA BULLISH OCT 9 2025There is a lot of bullish momentum in Tesla at current price. Price action is always superior .
If you dont understand a trade then dont enter in it trusting me or any stranger as this is your hard earned money. Missing a trade is not the end of the world.
Its a trade so,
STOP LOSS means Stop my loss
Trade:
Entry- curren price
SL-$416 close
Target-$460 min

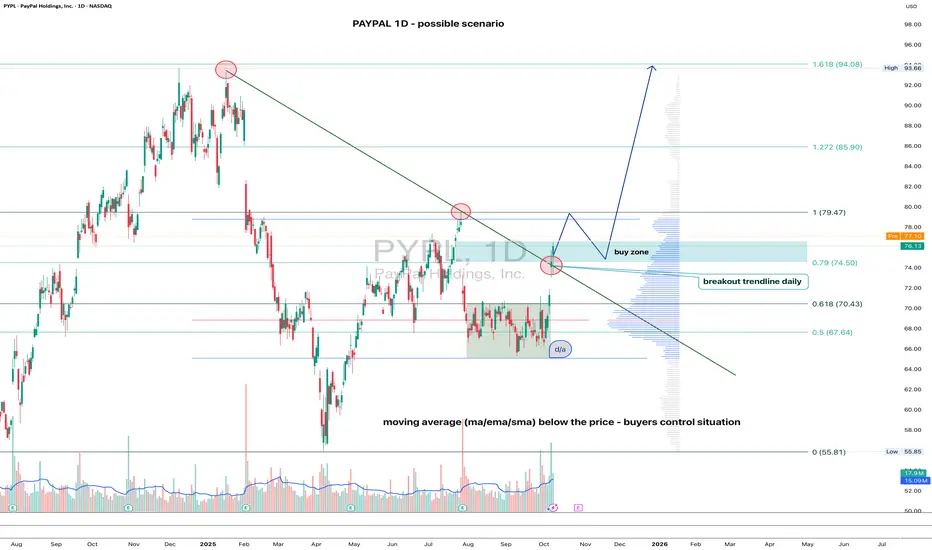
PAYPAL(PYPL) 1D - gaining traction On the daily chart, the price has confidently broken through the descending trendline — the first strong sign of a bullish shift.
All key moving averages (MA, EMA, SMA) sit below the price, showing that buyers are clearly in control.
Buy zone: 74.50.
A retest in this area (74.5–76) looks likely before another push higher.
First resistance: 79.47.
This level might trigger a short-term pullback, but a breakout above it opens the way toward targets at 85.90 and 94.00.
In short - the structure looks healthy, the breakout is done, and PayPal may be just warming up for a bigger move. Stay sharp - dips could be opportunities, not danger.
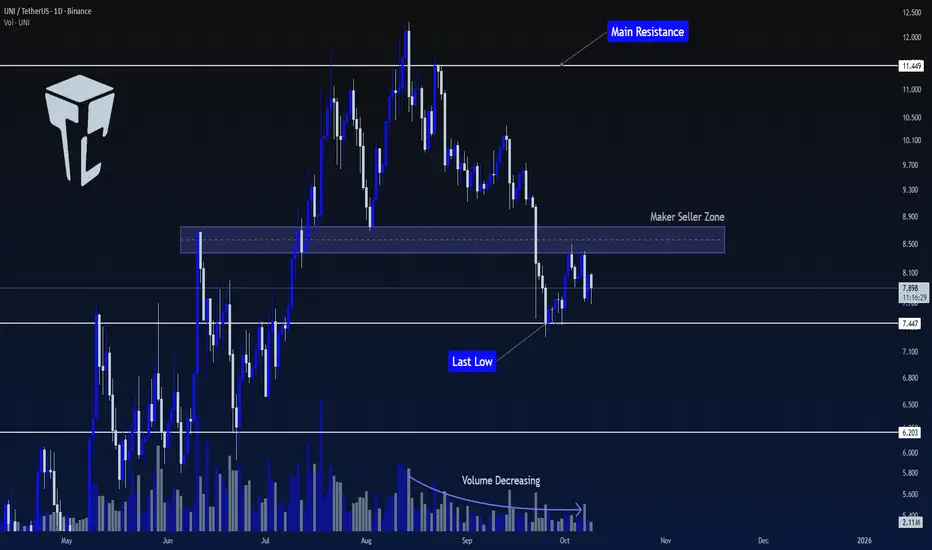
TradeCityPro | UNI: Key Levels and Bullish Continuation Setup👋 Welcome to TradeCity Pro!
In this analysis, I’m going to review UNI, one of the most popular DEX projects within the Ethereum ecosystem, with a market cap of $4.93 billion, ranking 28th on CoinMarketCap.
📅 Daily Timeframe
This coin has shown a strong upward move reaching 11.449 and then started a correction. After the failure at this level, a downward move began.
🧩 An important support zone around $8.5 has formed, which after breaking, is now acting as resistance.
✅ During this downward movement, the volume has been decreasing. Despite having two down legs so far, it can be said that the overall trend for this coin is still bullish.
📊 For a long position, the first trigger we have is the break of the Maker Seller level. Breaking this level will remove a lot of selling pressure, which could cause a sharp upward move in price.
🛒 The spot trigger for UNI is at 11.449. I recommend opening a long position after breaking the level, and using the profits from that position to buy this coin when the spot trigger is activated.
💥 For a short position, the trigger is 7.447. If the price ranges a bit longer in this area and then breaks the low, it would make a great position. However, if the price breaks the level right now, it would be a risky trigger.
📝 Final Thoughts
Stay calm, trade wisely, and let's capture the market's best opportunities!
This analysis reflects our opinions and is not financial advice.
Share your thoughts in the comments, and don’t forget to share this analysis with your friends! ❤️
Ethereum broke below the key $4,500 levelEthereum broke below the key $4,500 level
Market Overview
Altcoins appear poised for a significant breakout as market dominance gradually shifts away from Bitcoin. The Altseason Index continues to rise, signaling that a broader altcoin rally may be approaching once again.
Ethereum Market Update
Ethereum (ETH) has declined by 3.6% in the past 24 hours, breaking below the key $4,500 level. Despite this drop, current metrics suggest the move is part of a healthy market correction rather than a structural breakdown.
The correction has triggered notable withdrawals from staking pools, reflecting temporary uncertainty among holders seeking to realize profits.
Technically, ETH has tested local support at $4,330 and is showing early signs of stabilization. The RSI is near oversold territory, suggesting that selling pressure may be easing. If the price holds above this support, a potential rebound toward the $4,500–$4,760 resistance zone could follow. However, a close below $4,330 might expose ETH to deeper retracements.
Development & Ecosystem News
Ethereum co-founder Vitalik Buterin has voiced support for Kohaku’s zk-based privacy roadmap, calling it a positive step toward strengthening privacy and security across the Ethereum ecosystem.
In a post on X, Buterin emphasized that achieving full-stack privacy and data protection remains one of Ethereum’s core objectives.
Kohaku — a fork of Ambire — integrates zk-based protocols such as Railgun, designed to reduce on-chain transparency risks and encourage privacy-first wallet development. A working prototype of Kohaku will be showcased at the upcoming Ethereum Foundation Devcon, and its open-source codebase will be available for developers worldwide to build upon.
