Bitcoin Dominance Rejection and Altcoin Pump👋🏻 Hey everyone! Hope you’re doing great! Welcome to SatoshiFrame channel.
✨ Today we’re diving into the 1-Day Bitcoin Dominance analysis. Stay tuned and follow along!
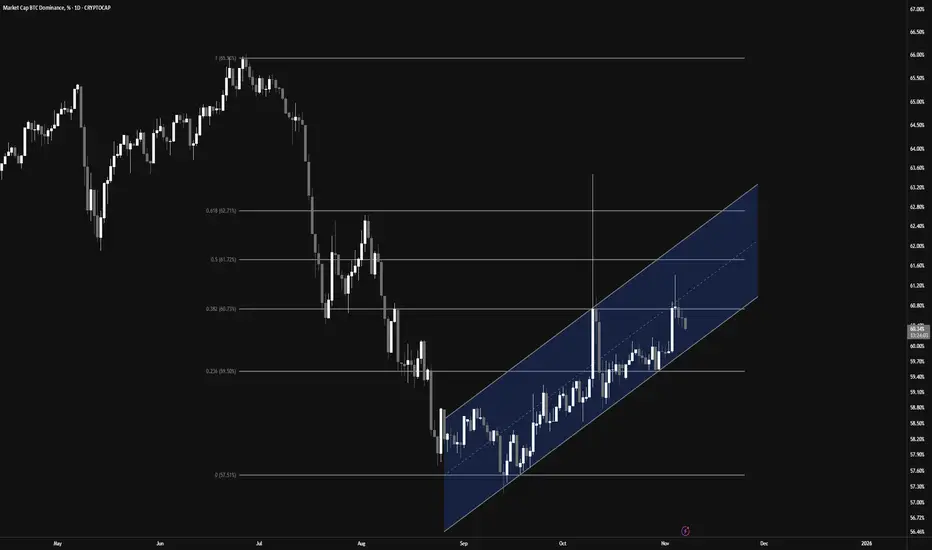
👀 On the daily timeframe, Bitcoin dominance has reached a key resistance zone at 60.73%. If this level breaks, we could see a deeper correction across altcoins. However, a rejection and move downward could trigger a strong rally for altcoins. As Bitcoin’s market weight decreases and capital flows into altcoins, we might be entering an early altseason, presenting potential profit opportunities.
🕯 From a technical perspective, Bitcoin dominance is moving within a well-structured ascending channel. The midline of the channel acts as a solid rejection point. A Fibonacci retracement from the previous downtrend shows a 38% overlap with this midline — a tough level to break. After a strong bearish candle rejection from that area, dominance is now heading lower. If the move continues, we could see a test of the channel’s lower boundary, and a confirmed breakdown would strengthen the altcoin bullish scenario.
💰 Typically, capital rotation in crypto follows this pattern: money flows into Bitcoin, then Ethereum, then the top 10 coins, and finally into smaller altcoins — before converting to USDT and exiting the market. With Bitcoin dominance currently at high levels after a solid Bitcoin season, this could signal the early stages of capital shifting toward altcoins. Traders should watch closely for these shifts to maximize profitability.
❤️ Disclaimer : This analysis is purely based on my personal opinion and I only trade if the stated triggers are activated .
Tradingview
Break of Support or Multi-Timeframe Trend Reversal ?👋🏻 Hey everyone! Hope you’re doing great! Welcome to SatoshiFrame channel.
✨ Today we’re diving into the 15-Mimutes Bitcoin analysis. Stay tuned and follow along!
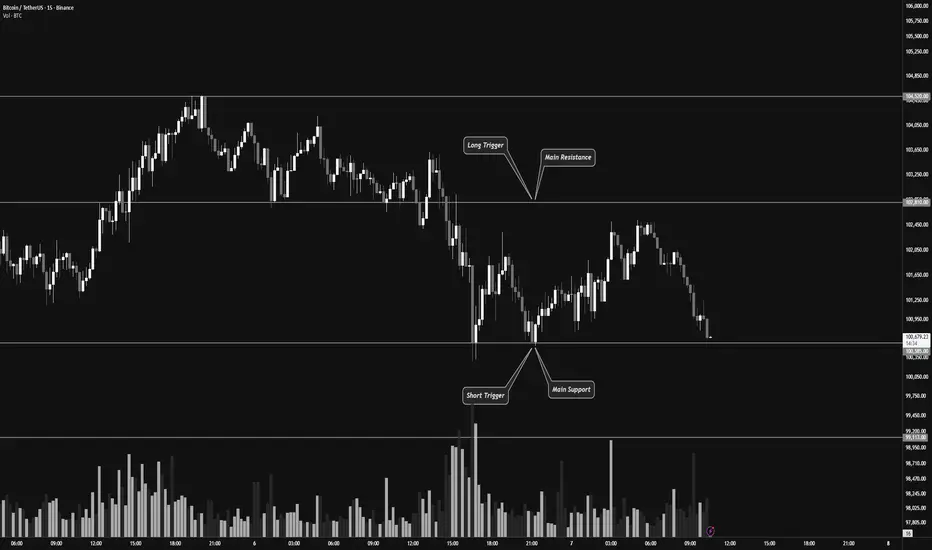
👀 On the 15-minute timeframe for Bitcoin, we can see that after breaking a multi-timeframe support, Bitcoin is currently testing its support zone around $100,585.
If this zone breaks, Bitcoin could continue its downward move and experience further decline.
However, if it moves upward and breaks the resistance zone around $102,810, it could trigger a potential trend reversal.
🕯 Pay attention to Bitcoin’s volume — the volume indicator currently shows an increase in selling pressure, suggesting that we might see a short-term volume consolidation before the price continues downward again.
✍️ The current scenarios for Bitcoin include both long and short setups, which you can use to plan your trades based on how the market reacts.
🟢 Long Position Scenario : A break above the $102,810 resistance zone, accompanied by increasing buy volume and bullish momentum, could signal a good long opportunity toward higher levels.
🟥 Short Position Scenario : A break below the $100,585 support zone, along with increasing sell pressure turning into strong selling momentum, could offer a short opportunity in line with the current trend.
❤️ Disclaimer : This analysis is purely based on my personal opinion and I only trade if the stated triggers are activated .
HUBC – Smart Money Retracement Setup| Liquidity GrabThe HUB Power Co. Ltd (PSX: HUBC) chart is developing a clean Smart Money Concept (SMC) structure — showing signs of a short-term liquidity sweep before a strong bullish continuation.
📊 Market Insights:
🔹 Equal Lows / Liquidity Zone (SSS) forming near key support
🟪 Expecting short-term pullback to sweep liquidity around 160–170 zone
🟡 Order Block (OB) remains unmitigated — potential re-entry area for Smart Money
🔻 Bearish retracement before a strong bullish reversal
🎯 Long-term target zone around 280+ levels
💡 Smart Money Outlook:
Price may first hunt liquidity below current structure to tap into discounted OB, then shift momentum bullish for the next impulsive leg up.

TradeCityPro | Bitcoin Daily Analysis #213👋 Welcome to TradeCity Pro!
Let’s dive into the Bitcoin analysis. The market has been calm for a few days, but we need to stay alert in case a new move starts, so we don’t miss out.
⏳ 1-Hour Timeframe
After reacting to the 0.382 Fibonacci level, Bitcoin started to drop again and reached the 100,308 support.
✨ Currently, after a minor bullish correction, the price is heading back towards the 100,308 support.
✅ Breaking this support still seems like a strong trigger for a short position. Even yesterday, when the price briefly reached this zone with a shadow, we saw clear buying interest in this area, with a significant increase in buying volume as the price touched the support.
🔑 The key point is that every time the price reacts to this level, the buying pressure is getting weaker. Fewer and fewer buyers are willing to buy at this level.
🎲 If this pattern continues, the psychological level of 100,000 will lose its impact, and breaking it will become easier.
⚖️ So, if the price touches this support a few more times, I anticipate a higher chance of the level breaking.
⭐ However, if the buyers show more strength at this level and can push the price above 104,000 with significant volume, we could expect Bitcoin to turn bullish.
📝 Final Thoughts
Stay calm, trade wisely, and let's capture the market's best opportunities!
This analysis reflects our opinions and is not financial advice.
Share your thoughts in the comments, and don’t forget to share this analysis with your friends! ❤️

LiamTrading – Gold compressed at the triangle peak; watch for...LiamTrading – Gold compressed at the triangle peak; watch for a break at 4020 (H2)
After a week of accumulation, the price is pressing into the triangle peak between the descending trendline (from late October) and the ascending trendline (from 11/5). The advantage will lean towards an increase if 4020 is broken and sustained.
Technical Analysis (priority H2, Volume Profile – Trendline – S/R – Fibonacci)
Trendline & Structure
The descending trendline is blocking the recovery waves; the ascending trendline supports the adjustment waves.
Closing the H2 candle above the confluence zone ~4020 will confirm a clear upward movement.
Support / Resistance (S/R)
Main support: 3970–3972 (swing low & “Key level Support”).
Decision zone: 4014–4020 (break–retest zone).
Resistance: 4045 (medium-term), 4050 (supply for scalp orders), upper band 4105–4110.
Volume Profile (recent session / composite)
POC magnet: 4015–4017 → likely to have profit-taking/fluctuations; staying above POC turns this area into a launchpad.
LVN: around 4020 → beautiful break-and-go; failing to hold often pulls back to 4015/4010.
Fibonacci Extension (H2 swing)
1.618 coincides with 4045–4050 → first upward target.
2.272/2.618 creates a liquidity zone 4095–4110 → area may weaken/strong profit-taking.
Today's Trading Scenarios
Scenario 1 – Buy on breakout
Entry: 4020–4022 after closing above trendline + retest holding 4018–4020
SL: 4014
TP: 4045 → 4070 → 4100–4110
Management: Take partial profit at 4045; move SL to break-even when reaching +1R. Staying above 4020 turns POC 4015–4017 into support.
Scenario 1b – Buy on pullback (before breakout, cautious volume)
Entry: 3998–4002 (“400x”) when there is an upward reaction at the ascending trendline
SL: 3988
TP: 4017 → 4045
Note: H2 closes below 3988 → cancel the order.
Scenario 2 – Sell scalp at resistance
Entry: 4048–4052 (confluence of Fibo 1.618 + supply zone)
SL: 4056
TP: 4040 → 4030 → 4020
Note: This is counter-trend. Ignore if H2 closes strongly above 4052.
Summary
The upward bias is confirmed when breaking–holding 4020, opening targets 4045 → 4070 → 4100+. Before that signal, trade within the range respecting POC 4015–4017 and ceiling 4045/4050. Risk per order 0.5–1%, move SL to BE when reaching +1R.

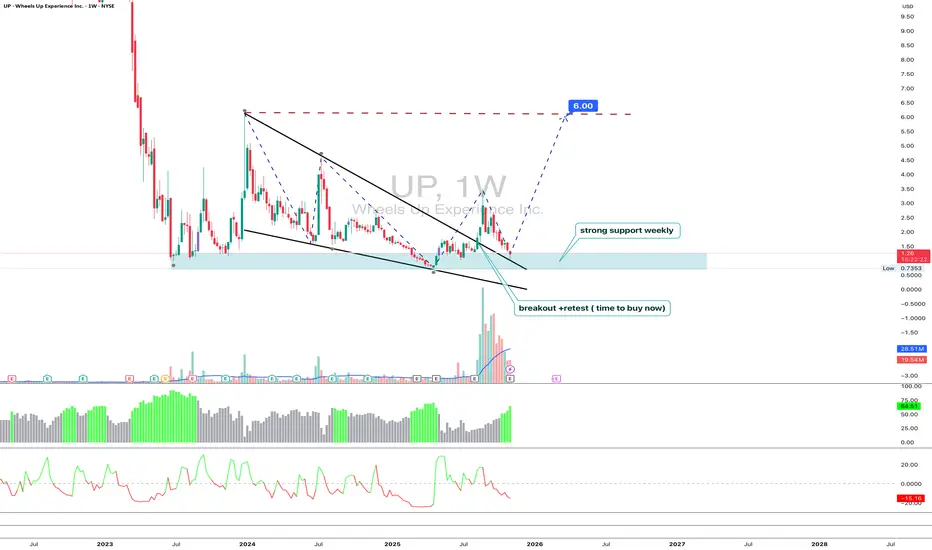
UP 1W-business jet without autopilot, but the runway looks clearTechnically, Wheels Up (UP) broke out of a long falling wedge and returned to the wide demand zone around $1.00–$1.30, where weekly support has formed. Volume expansion and bullish divergence signal that accumulation is taking shape. As long as price stays above $1.05, the structure remains constructive with initial upside targets at $1.60 and $1.80, while a breakout above $2.00 could open the door toward $6.00.
Fundamentally , the company continues its transformation after the liquidity crisis and strategic partnership with Delta Air Lines. Management has shut down unprofitable low-margin programs, refocused on high-yield corporate and frequent-flyer clients, and introduced a leaner “asset-light” model by outsourcing part of its fleet to partner operators. Q3 2025 results showed revenue near $185 million with solid gross bookings growth and improved operational efficiency - 99 % flight completion and 89 % on-time performance mark the best metrics since restructuring began. Losses and negative cash flow remain, but cost discipline is improving, and the Delta integration is slowly turning into a real commercial synergy. If corporate demand keeps strengthening and free cash flow moves toward breakeven, UP may turn into a rare small-cap comeback story in the aviation sector.
Tactically , the plan remains simple - hold above $1.05, look for movement toward $1.60 and $1.80, take partial profits near $2.00, and re-enter on retests around $1.20–$1.30 if volume confirms. A weekly close below $0.95 would invalidate the bullish scenario.
The market has heard “we’re taking off” before but this time, there’s at least a real runway under the wheels.
USDJPY – 4H Technical Analysis (Nov 7, 2025)USDJPY – 4H Technical Analysis (Nov 7, 2025)
Structure:
Price remains in a bullish structure overall, but recent BOS to the downside from the 153.6–154.0 zone indicates a short-term correction phase within the higher-timeframe uptrend.
Liquidity & Zones:
Price rejected from the premium zone (153.6–154.0) where multiple equal highs (EQH) formed — confirming liquidity grab and short-term seller pressure.
Currently trading near PDL (153.0), holding above equilibrium (≈152.0) and the 200 EMA (≈151.4) — both serving as major dynamic supports.
Below, discount zone 149.5–150.0 remains a strong buy area with prior bullish reaction.
Momentum:
Stochastic is near the oversold region, signaling potential exhaustion of sellers — early signs of a possible rebound if support holds.
Key Levels:
Resistance: 153.60 → 154.00 (supply / weak high)
Support: 152.00 → 151.40 (EMA confluence) → 149.50 (major demand)
Trading Plan:
Scenario 1: Hold above 152.0 → possible rebound toward 153.6–154.0 (retracement buy setup).
Scenario 2: Breakdown below 151.4 → deeper pullback toward 150.0–149.5.
Stop-Loss: Below 151.2 for long setups.
➡️ Bias: Bullish overall – short-term correction, looking for long re-entry from equilibrium / discount zones before next leg up.

Learn how to short Bitcoin without a sense of guilt in 4 minutesIn such conditions, where bearish momentum has heavily tipped the scales in the crypto market, traders often face a subtle psychological challenge known as “the sense of guilt” when opening short positions.
What does that mean?
After opening long positions repeatedly, our minds become conditioned to believe that shorting somehow goes against our values — even our trading “ beliefs .” This mental association can cause us to miss clear market opportunities, hesitate to enter trades, and fall into a cycle of mental paralysis and indecision.
But indecision isn’t always about fear — fear of liquidation, panic, or haste. Sometimes, it hides behind those very beliefs and rigid patterns of thought, making us feel guilty for taking trades we haven’t opened in months. These biases quietly cloud our judgment, preventing us from viewing the market with clarity and flexibility.
Today, we’re diving right into that — identifying and dismantling our biases and mental rigidities, a skill every skeptical and self-aware trader must develop.
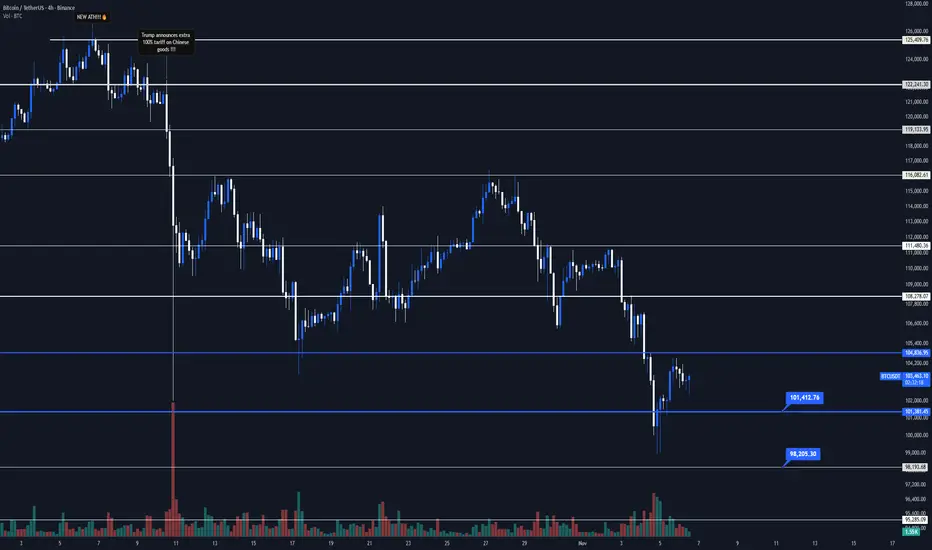
Now, shifting to the 4-hour timeframe — let’s take a closer look at the candles and volume.
The LWC (this 4H structure) is completely bearish, and the MWC also turned bearish after breaking below the 104,000 support.
Analyzing the waves: the first bearish wave had a smaller drop and a larger correction, while the second wave extended lower with more force — signaling strengthening bearish momentum. Volume confirms this: it spikes during drops and fades during corrections, which now look so weak and low-volume they’re practically meaningless.
The down candles are large and decisive, with short shadows — a clear sign of seller dominance and conviction. In contrast, the buyers’ candles are small and hesitant, almost as if begging the sellers for mercy.
Altogether, it paints an obvious picture: Bitcoin’s daily correction phase has begun. Ignoring that is exactly the kind of mental rigidity rooted in the “sense of guilt” buried deep in our conditioning.
Of course , I’m not saying upside is impossible — maybe Bitcoin suddenly jumps 10% with a single green candle. That’s fine. We’ll simply take the stop on our shorts and open longs when the setup shifts.
But on the other hand, refusing to adapt means missing numerous valid setups — trades the market is literally handing us.
The choice is yours, and you need to make it today.
Your short trigger could be the break of 101,381.45 support, or whatever entry your personal strategy defines. The point is simple: trade in the direction of the trend.
If this idea managed to soften some of your mental rigidity and prepare you for the market’s new conditions, don’t forget to boost this Idea.
Now get outta here.
Wider Range or Early Trend Reversal in Multi-Timeframe?👋🏻 Hey everyone! Hope you’re doing great! Welcome to SatoshiFrame channel.
✨ Today we’re diving into the 15-Mimutes Bitcoin analysis. Stay tuned and follow along!
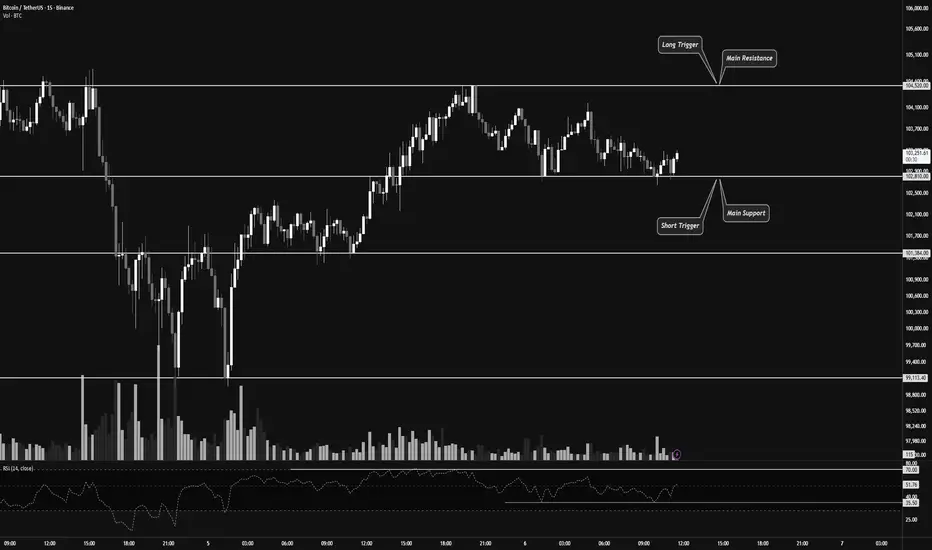
👀 On the 15-minute timeframe of Bitcoin, we can see that after recent declines, BTC has entered a 15-minute trading range. The top and bottom of this range act as our long and short triggers. Keep in mind that Bitcoin’s next move could potentially develop into a long-term directional move.
🧮 Looking at the RSI oscillator, the 70 level serves as confirmation for a long trigger, while the 35.5 level confirms a short trigger. Note that RSI confirmation based on its momentum swings can provide higher-quality trade setups.
🕯 Selling volume has increased slightly as Bitcoin approaches its resistance zone at $104,520, and we’ve seen a similar reaction when price hits resistance from below. This indicates buyer hesitation and stronger seller activity.
Meanwhile, buying volume has risen as price nears the support zone around $102,810. If this buying pressure continues, it could confirm an extended range formation in this area.
✍️ As in previous setups, Bitcoin’s potential scenarios remain straightforward. With proper RSI confirmation, we can look for entry opportunities.
🟢 Long Scenario : A breakout above the $104,520 resistance zone, accompanied by increasing buying volume and RSI exceeding the 70 level on the 15-minute multi-timeframe, could signal a long trade.
🟥 Short Scenario : A breakdown below the $102,810 support zone, with rising selling volume and RSI dropping below the 35.5 level, could trigger a short trade.
❤️ Disclaimer : This analysis is purely based on my personal opinion and I only trade if the stated triggers are activated .
LiamTrading – Gold Confirms Medium-Term UptrendLiamTrading – Gold Confirms Medium-Term Uptrend
Gold has officially broken through the descending trendline, confirming a transition to a medium-term uptrend. After a prolonged accumulation phase, the market is beginning to show clear buying strength, and the potential for an extended rally is gradually forming.
Macroeconomic – Fundamental Analysis
The latest report from the World Gold Council (WGC) shows that central banks continued to increase their gold purchases significantly in September, totaling 39 tons, the highest level since the beginning of the year.
Most notably, the Central Bank of Brazil added 15 tons of gold to its national reserves for the first time this year.
Since the beginning of the year, net purchases by central banks have reached 200 tons, clearly reflecting a shift away from the USD amidst global economic and geopolitical instability. This capital flow provides a solid foundation for gold's medium- and long-term uptrend.
Technical Analysis
On the H2 chart, gold prices have broken the descending trendline, signaling a reversal and establishing a new upward structure.
The 3985–3988 zone is acting as dynamic support, potentially serving as a retest point before prices continue to rise.
The POC of the Volume Profile at the 4015–4017 zone is a short-term resistance, where the market may see profit-taking reactions before breaking higher.
The 4046 mark is considered a decisive area; if surpassed and maintained, the medium-term uptrend will be strongly reinforced.
Today's Trading Scenarios
Scenario 1 – Buy in line with the uptrend:
Entry: 3986–3988 (may wait for retest confirmation)
SL: 3980
TP: 4020 – 4045 – 4090
Scenario 2 – Short sell at resistance:
Entry: 4015–4017
SL: 4023
TP: 4002 – 3986
Summary
Gold is signaling a clear establishment of a medium-term uptrend, supported by central bank buying flows. Traders should prioritize buying positions at strategic support zones and observe price reactions around the POC to confirm the next direction.

TradeCityPro | Bitcoin Daily Analysis #212👋 Welcome to TradeCity Pro!
Let’s dive into the Bitcoin analysis. The market has entered a corrective phase and is preparing for the next wave of movement.
⏳ 1-Hour Timeframe
On the 1-hour timeframe, Bitcoin started correcting after reaching the support at 100,308 and has now retraced to the 0.382 Fibonacci level.
📊 Market volume significantly increased around the 100,308 support, indicating that this zone is very sensitive and important, with price reacting to it.
✨ Currently, volume has decreased slightly, and the price is in a corrective phase. If this correction continues, the next resistance zones will be at the 0.5 and 0.618 Fibonacci levels.
⭐ However, if the price continues its downward movement, we can open a position with a candlestick setup when the volume increases towards 100,308, or wait for the break of the 100,308 support to open a position.
✅ For a long position, if buying volume increases, the break of the 0.382 Fibonacci level would be a good trigger for a long entry.
❌ Disclaimer ❌
Trading futures is highly risky and dangerous. If you're not an expert, these triggers may not be suitable for you. You should first learn risk and capital management. You can also use the educational content from this channel.
Finally, these triggers reflect my personal opinions on price action, and the market may move completely against this analysis. So, do your own research before opening any position.

TradeCityPro | HBAR: Support Zone and Key Resistance Levels👋 Welcome to TradeCity Pro!
In this analysis, I want to review the HBAR coin,one of the RWA (Real-World Asset) coins, with a market cap of $7.22 billion, currently ranked 19th on CoinMarketCap.
⏳ 4-Hour Timeframe
On the 4-hour timeframe, this coin is sitting on a very important support level. Unlike most altcoins that have lost their support levels, HBAR has managed to stay above its support zone.
🔔 A double top pattern formed below the 0.20789 level, and after the trigger activated at 0.19028, it made a downward move until it reached its support level and hit the pattern's target.
💥 Currently, after the price reached this zone, the market has reacted to it, showing a small bullish correction with low volume.
✨ The price has corrected to 0.17532. If the price gets rejected from this zone, we can consider entering a short position if the support breaks.
✅ If the price stabilizes above 0.17532, it may undergo deeper corrections up to 0.19028.
📊 For a long position, the 0.17532 break is not a very strong trigger because the market's momentum is still bearish. I believe the main long trigger is breaking 0.20789. We can take earlier triggers if a new structure forms.
💡 The main confirmation for a bullish trend will come with a break of 0.23093. For a short position, as mentioned, our trigger is the break of the support zone.
📝 Final Thoughts
Stay calm, trade wisely, and let's capture the market's best opportunities!
This analysis reflects our opinions and is not financial advice.
Share your thoughts in the comments, and don’t forget to share this analysis with your friends! ❤️

XAUUSD – DAILY BULLISH SCENARIO – TARGET 4050💛 XAUUSD – DAILY BULLISH SCENARIO – TARGET 4050 🎯
🌤 1. Overview
Hello everyone 💬
Although the larger trend for gold leans towards a downtrend, today I prioritize a bullish scenario in the short term.
On the M30 chart, the price structure is gradually increasing, indicating that short-term capital is shifting towards buyers.
The 3990 zone is a very important area – where a Break of Structure (BOS) has just appeared and is also a strong resistance that has reacted multiple times before.
Price needs to confirm a break above this area to continue expanding the bullish trend.
💹 2. Technical Analysis (ICT Perspective)
📈 An ascending structure (BOS) has formed on M30.
🟣 Buy Zone 3977–3979 coincides with the support trendline – a beautiful confluence point for buyers.
🔹 Resistance zone 3990–4000 is the area to confirm the main direction.
💫 Higher target: Fibonacci Extension 1.618 area around 4049–4050, coinciding with the psychological resistance at 4050.
🎯 3. Reference Trading Plan
💖 Main BUY (priority)
Entry: 3977–3979 | SL: 3970
TP: 3988 – 4000 – 4022 – 4040 – 4050
💢 Short SELL (when price reacts strongly at resistance)
Entry: 4012–4014 | SL: 4020
TP: 4002 – 3988 – 3965
⚠️ 4. Important Notes
Price needs to confirm above the 3990 area to solidify the bullish trend.
If it breaks below 3970, the ascending structure is temporarily invalidated.
Today, prioritize buying according to the capital flow, sell only when there is a clear signal at the resistance zone.
🌷 5. Conclusion & Interaction with LanaM2
Gold is showing positive signals 💛
Be patient and wait for reactions at the Buy Zone 3977–3979, this could be the starting point for a new upward move towards 4050.
This is not an investment recommendation, just a personal view according to the ICT method.
If you find it useful, please 💛 like – 💬 comment – 🔔 follow LanaM2 to update gold analysis with me every day ✨

BTCUSD – When the Whales Dump, Bitcoin Free-Falls Without BrakesHey traders,
The crypto market is once again in turmoil! Bitcoin has just dropped below $100,000 , its lowest level in months, after whales unloaded over $45 billion in positions — a powerful blow that shook the entire market.
At the same time, expectations for a Fed rate cut in December are fading , spreading a broad “risk-off” sentiment. Investors are pulling money out of risk assets, flowing instead into the USD and bonds, adding more downward pressure on crypto.
On the 4-hour chart, the bearish structure remains dominant. Price continues to move inside a descending channel , with the $104,600 area now acting as a critical short-term resistance. Every rebound has been swiftly rejected — a clear sign that the market isn’t ready for any meaningful recovery yet.
If price fails to retest and hold above $104,600, the next likely scenario is a drop toward $96,700, where the next major support zone lies.
Right now, the market looks like it’s exhaling after a leverage hangover . With both fundamental and technical pressure converging, the bearish trend remains the dominant direction for Bitcoin in the short term.

EURUSD 1D: bearish bias remains - trend break is confirmedEURUSD confirmed a break of the major daily trendline and failed to reclaim 1.1600. Buyers lost structure, every bullish bounce is absorbed. Market shows a clean shift to downside momentum.
Expect a corrective pullback into 1.1600–1.1700 (Fibo 0.382–0.5). This area remains the primary supply zone and ideal entry for continuation shorts.
Targets:
• 1.1407 — first liquidity zone
• 1.1389 — bearish continuation trigger
• 1.1150 — major demand zone and final target
Expectations vs reality: buyers hope for reversal, price structure signals continuation down. No guessing - trade what market prints.

Teva: The flag’s ready — someone just needs to hit “launch”Teva Pharmaceutical (TEVA) is setting up for a potential continuation move after a clean impulse. On the daily chart, we have a textbook bull pennant — and not just any sloppy one. Price has broken above the 200-day moving average, and all key EMAs (50/100/200) now sit below price, confirming a solid bullish structure.
Volume behavior fits the script: declining inside the pennant, signaling pressure is building. More importantly, the Volume Profile reveals a low-volume void above current levels — meaning there’s little resistance until we hit the $22+ zone. In other words, once this breaks, it could run fast.
RSI is comfortably in bullish territory without being overheated, and the flagpole projection gives us clean upside targets:
– Entry: breakout above pennant resistance
– Target: $22.80 — full flagpole height
– Support: $17.60 — confluence of 0.5 Fib + volume base
TEVA isn’t asking for confirmation anymore — it’s showing it. All systems are technically armed. Now we just wait for the market to press the button.

TradeCityPro | Bitcoin Daily Analysis #211👋 Welcome to TradeCity Pro!
Let’s dive into the Bitcoin analysis. The market is still in a downtrend and has reached its next support!
⏳ 4-Hour Timeframe
Bitcoin finally broke the important support at 106,396 yesterday, and with a very high selling volume, it managed to start its new downward wave.
💥 The RSI oscillator also entered the oversold zone at the same time as the 106,396 break, which was another reason for the market's drop.
⚡️ This downward move has reached the 100,308 support, and the price has calmed down a bit now.
✅ The psychological level of 100,000 is extremely important. Despite the massive selling volume and bearish momentum in the market, buyers haven’t allowed the price to stabilize below this level, and now the market is in a corrective phase.
🧩 After the price reacted to this zone, the volume has significantly decreased, which favors the sellers. If the buying volume remains low, the price will likely start falling again with the entrance of new selling volume.
🔔 However, since the RSI has faked the 30 level and the market momentum could turn bullish, we could see a reversal. If the volume starts to increase and considering the bullish trend on higher timeframes like the weekly chart, we could open a position.
🔍 For now, the first long trigger we have in this timeframe is 111,789. If the price can sharply recover to this level, a very strong bullish trend could begin.
💡 The main resistance zone we have is 115,771, and breaking this level will confirm the start of Bitcoin's new upward wave. We can look to enter the trend after breaking 111,789. If the price builds further structure, we can enter earlier with smaller triggers.
❌ Disclaimer ❌
Trading futures is highly risky and dangerous. If you're not an expert, these triggers may not be suitable for you. You should first learn risk and capital management. You can also use the educational content from this channel.
Finally, these triggers reflect my personal opinions on price action, and the market may move completely against this analysis. So, do your own research before opening any position.

TradeCityPro | ZEC: Bullish Trend & Key Resistance Levels👋 Welcome to TradeCity Pro!
In this analysis, I want to review the ZEC coin—one of the privacy coins, with a market cap of $7.12 billion, currently ranked 19th on CoinMarketCap.
⏳ 4-Hour Timeframe
This coin is moving completely independently from the market, and while Bitcoin and other altcoins are experiencing significant declines, ZEC continues its bullish trend.
🔔 Currently, the price is within a steep ascending channel, which was formed after breaking the 292 level.
✅ The resistance the price is currently facing is the 474.83 level, and I believe that if this level is broken, we can look for the next long position.
🎲 If this resistance is broken, a bullish leg towards the upper boundary of the channel could form.
💥 The RSI oscillator is moving within a box between 50 and 70, and the 50 level serves as a strong momentum support for this coin.
✨ As long as the RSI stays above 50, the bullish wave will continue, and we can open positions with broken triggers. If the 70 level breaks and enters the overbought zone, the bullish move will become even sharper.
📊 This coin is not suitable for short positions. There are plenty of altcoins that are in a downtrend and have short triggers, so it’s better to focus our attention on ZEC for long positions only.
📝 Final Thoughts
Stay calm, trade wisely, and let's capture the market's best opportunities!
This analysis reflects our opinions and is not financial advice.
Share your thoughts in the comments, and don’t forget to share this analysis with your friends! ❤️

XPeng 1W: cup under pressure, lid about to popTechnically , XPEV is still trading below resistance at 22–23 USD, forming a tight “cup & handle” pattern. The golden cross (MA50 > MA200) adds bullish weight, but there’s no confirmed breakout yet - only a test of the upper boundary. A weekly close above 24 USD would unlock upside targets around 35.6 and 41.6.
Fundamentally , XPeng keeps gaining momentum - October 2025 deliveries hit 42 k EVs (+76% YoY). The firm expands internationally and strengthens its China base, though profitability remains elusive due to heavy investment spending and price competition from BYD and Li Auto.
As long as price stays above 20–21 USD, the bullish structure holds. Losing that area would send the stock back into consolidation.
Sometimes the cup is ready, the handle’s forming - now all that’s missing is the boil.

Bitcoin Losing Steam – Is the $100,000 Zone Calling?Hello everyone, BTCUSDT is currently trading around $109,600, still facing strong pressure from the medium-term descending trendline . After three failed attempts to break above the $112,000 resistance, selling momentum is gradually taking control.
On the macro side, although the Fed cut rates by 0.25% , Chair Powell’s cautious remarks suggest the central bank isn’t ready for an aggressive easing cycle. This “hawkish rate cut” keeps the USD strong and weakens risk appetite — an unfavorable setup for Bitcoin in the short term.
Adding to the pressure, October — typically known as “Uptober” — closed with a sharp red candle , signaling widespread pessimism. Meanwhile, Spot Bitcoin ETFs continued to record hundreds of millions of dollars in outflows , showing that institutional investors remain on the sidelines.
From a technical perspective, the lower-high structure is clearly visible, with EMA34 and EMA89 sitting above the price, reinforcing the bearish bias. If the $105,000 support fails to hold, the next key target lies near $100,000, a level that has historically attracted strong buying interest.
Combining both fundamentals and technicals, BTCUSDT appears to be in a short-term corrective phase , and the likelihood of a retest of the $100,000 zone in the near future remains quite high.

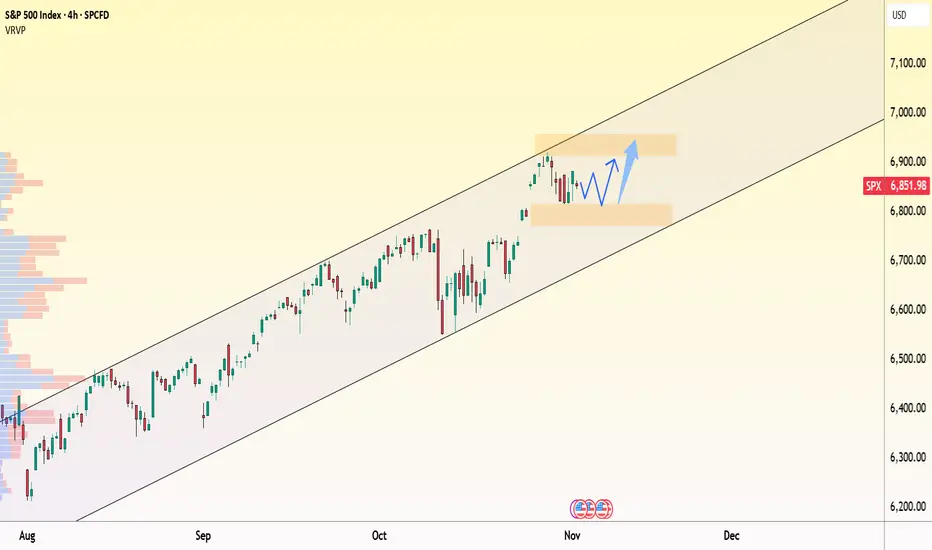
SPX:uptrend remains intact – consolidating for the next breakoutOn the 4-hour chart, the S&P 500 (SPX) continues to move firmly within its ascending channel , with the current range around 6,850–6,900 representing a healthy pause after a strong rally. The nearest support sits at 6,800, where buyers previously stepped in, while short-term resistance remains near 6,900.
From a news perspective, the rally is still being driven by tech and AI sectors , especially after the Amazon–OpenAI partnership deal , which reignited positive sentiment across the market. However, investors remain cautious ahead of upcoming U.S. ADP employment and ISM PMI data , which could influence the Fed’s next rate-cut decision.
Overall, the technical structure still supports an upward bias: SPX is consolidating between 6,800–6,900 before potentially breaking toward the 7,000-point zone , aligning with the upper boundary of the trend channel.
As long as the 6,800 support holds, the market retains room for another bullish leg in the sessions ahead, backed by renewed capital inflows into leading sectors.
BTCUSD 1D - Pause Before the Next Leg Down?On the 4H chart, Bitcoin is retesting a critical resistance area - the 111K–113K sell zone, where a descending trendline, prior support-turned-resistance, and local volume cluster converge. This confluence makes the current level a potential short-entry area.
After failing to sustain above 115K, BTC entered a corrective phase. The recent bounce looks like a retest of the broken structure, and unless bulls reclaim 113K+, the bias remains bearish with a target near 100K–101K, a key liquidity zone.
Technically, momentum is fading:
– Bearish RSI divergence at recent highs;
– Volume contraction on rallies, expansion on drops;
– Price structure forming a likely ABC correction, with wave C projection toward 100K.
Fundamentally , near-term pressure persists as traders take profits and global risk sentiment cools ahead of potential Fed guidance. However, the macro bull case remains intact - hashrate at all-time highs, growing institutional adoption, and supply tightening continue to underpin long-term support.
Tactical plan: short entries near 111K–113K, targets 100K–101K. Invalidation above 113.5K.
Even in a bull market, gravity never takes a holiday.

Grab (GRAB) – Riding the Trend WaveGrab is looking grabbingly strong 😎 — making higher highs and higher lows since 7 April 2025, up almost 95% until 23 September 2025!
The stock broke out of its downtrend line from 21 Nov 2024 with big volume on 11 Sep 2025 — strong confirmation that bulls are taking charge. After the breakout, price retested the trendline (now support) twice and also bounced right from the Fibonacci 38.2% zone. Beautiful confluence! 🎯
The uptrend line from April is still holding well — as long as this stays intact, the party’s not over yet 🕺
📈 Trade Idea:
Entry zone: 5.65 – 5.37
Targets:
TP1 👉 6.60
TP2 👉 7.10
Support / Invalidation: 5.37 zone, uptrend line, or old downtrend line turned support
Summary:
Grab is acting like a true comeback kid 💪 — breakout ✔️, retest ✔️, uptrend intact ✔️.
If momentum keeps building, we might be seeing the next leg up soon! 🚀
