MYX Update📊 MYX Update
MYX is testing the blue support level 🔵
If it breaks out, the first target will be the green line level 🟢
Potential short opportunities ⚠️
Tradingview

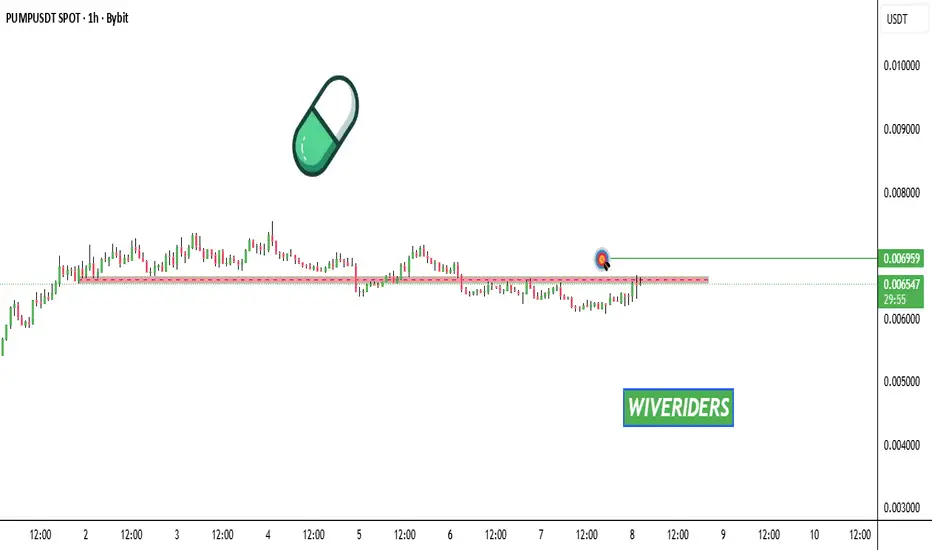
$PUMP Update📊 NYSE:PUMP Update
NYSE:PUMP is testing the red resistance zone 🔴
If it breaks out, the first target will be the green line level 🟢
S Update📊 S Update
S is testing the red resistance zone 🔴
If it breaks out, the first target will be the green line level 🟢

BNB Update📊 BNB Update
BNB is retracing now 🔄
If it keeps retracing to the green zone level 🟢, there’s potential to enter a long position — with confirmation ✅

DEXE Update📊 CRYPTOCAP:DEXE Update
CRYPTOCAP:DEXE is testing the red resistance zone 🔴
If it breaks out, the first target will be the green line level 🟢

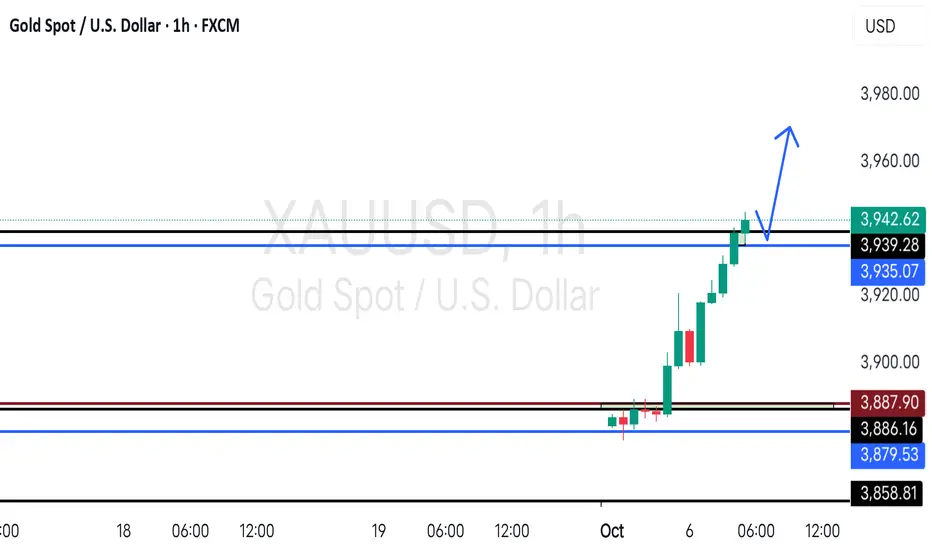
GOLD at Immediate support? What's next??#GOLD... perfect move as per our last ideas and analysis regarding gold.
Now market have immediate supporting region from 3935 to 3938
Keep close and buy above.
Good luck
Trade wisely
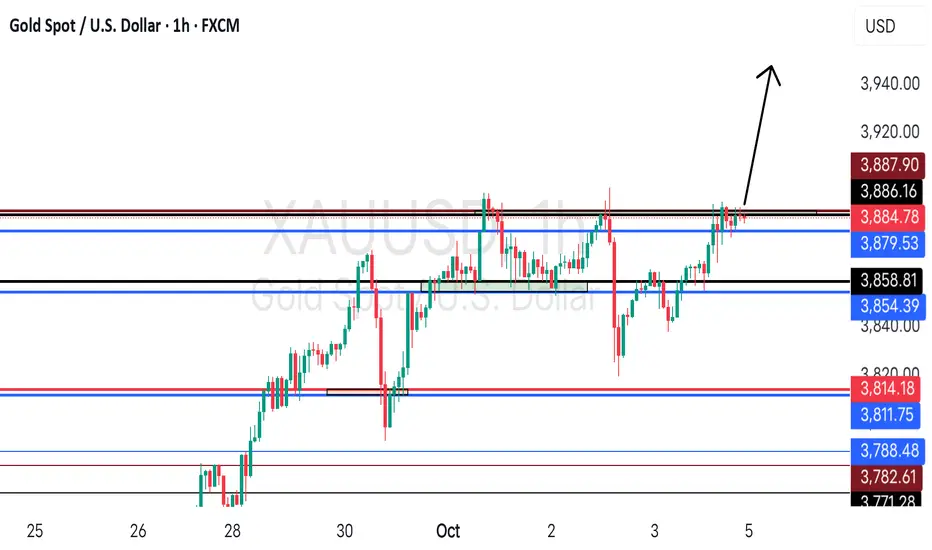
GOLD near Breakout region? What's next??#GOLD - perfect move so far as per our last ideas and analysis regarding gold.
Now market have 3887 to 3889 as immediate and breakout region for upside.
Keep close and don't hold your selling positions above that.
Good luck
Trade wisely
Wall Street pauses after record highs as investors await Fed sigWall Street pauses after record highs as investors await Fed signals
U.S. stocks were little changed Oct 7, easing after the S&P 500 and Nasdaq closed at record highs, as traders looked to upcoming Federal Reserve remarks for policy cues. Gains have slowed amid stretched valuations and uncertainty caused by the government shutdown, now in its seventh day.
Markets continue to price in a 25-basis-point Fed rate cut later this month, supported by signs of labor market softness, though the data blackout has limited visibility. Analysts say the absence of official reports leaves the Fed leaning dovish unless future labor data show improvement.
Investor focus is also shifting toward the upcoming earnings season, where forecasts and corporate commentary may play a larger role in shaping sentiment. Fed officials including Michelle Bowman, Raphael Bostic, Stephen Miran, and Neel Kashkari are set to speak this week.

Bitcoin Crushes $125K – New ATH Unlocked: Bull Run Just Started?Yo traders, Skeptic from Skeptic Lab! 🩵 Bitcoin just smashed a new ATH—your next move could set the 3-month path! In this video, we dive deep into the daily/4h analysis: from the long squeeze bounce at key support to the parabolic breakout and resistance crush. We hunt fresh long triggers (1h resistance break), skip shorts for now (bias bullish), and I share my take on your positions—hold profits if you're green (target $130K?), partial close if not. HWC/MWC/LWC all uptrend—momentum's building! Don't FOMO; money management saves the day. Like, comment your coin focus, follow for more.

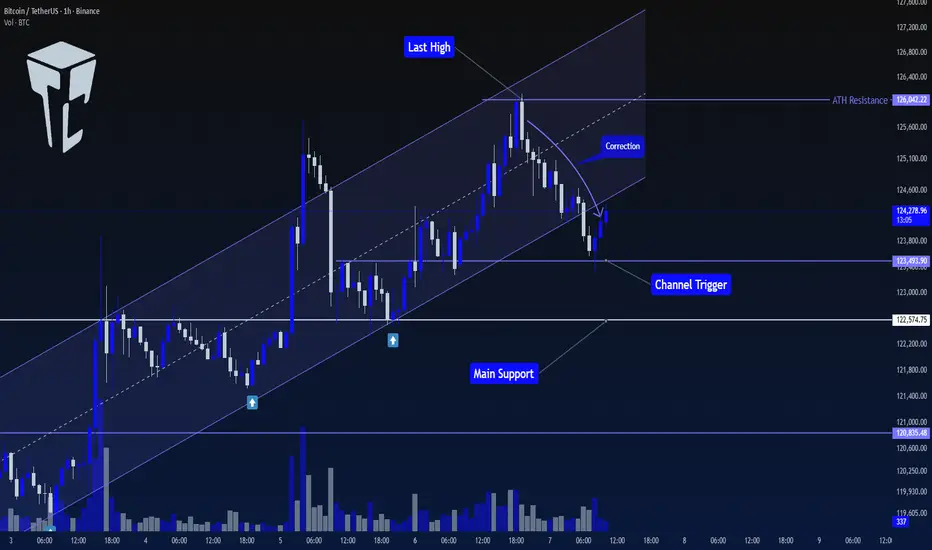
TradeCityPro | Bitcoin Daily Analysis #189👋 Welcome to TradeCity Pro!
Let’s move on to the Bitcoin analysis. Yesterday, after setting a new ATH, Bitcoin began its correction — let’s review the market together.
⏳ 1-Hour Timeframe
On the 1-hour timeframe, Bitcoin had been moving inside an ascending channel that had provided multiple supports. However, after being rejected from 126042, the price experienced a downward move and broke the channel to the downside.
⭐ The channel breakout trigger is at 123493, where the price has already reacted once, and it’s now moving slightly upward with very low volume.
📊 If this low-volume bullish movement continues, the likelihood of trigger activation will increase, and in that case, the price could move toward 122574.
🔍 For now, none of these triggers are suitable for short positions, as the market still looks too bullish to consider shorting.
✨ For long positions, the current trigger is 126042. However, if the market consolidates longer and forms a new structure, we might find an opportunity to enter earlier.
❌ Disclaimer ❌
Trading futures is highly risky and dangerous. If you're not an expert, these triggers may not be suitable for you. You should first learn risk and capital management. You can also use the educational content from this channel.
Finally, these triggers reflect my personal opinions on price action, and the market may move completely against this analysis. So, do your own research before opening any position.
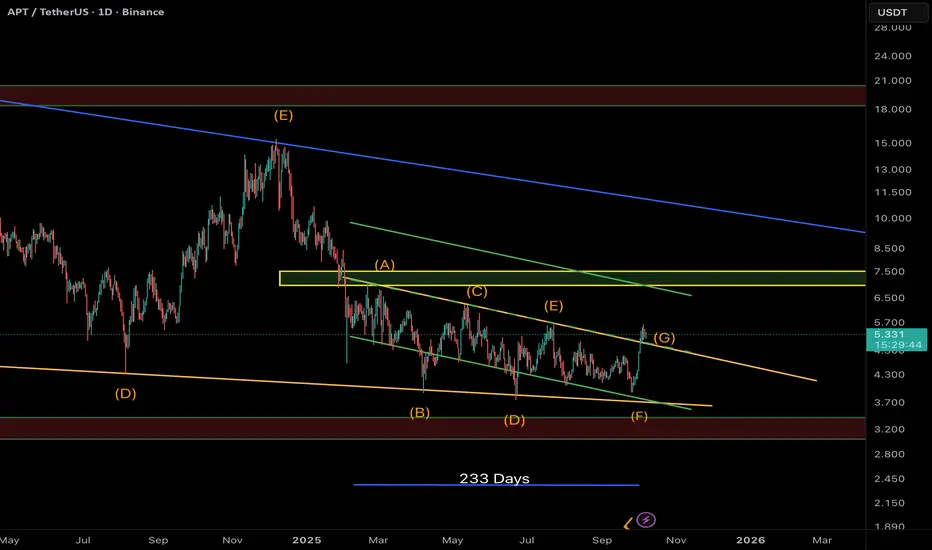
APT — Diametric Pattern Completed? Wave G in Play!APT appears to have completed a 7-leg Diametric correction (A–G) — a rare and complex Elliott structure often seen before major trend reversals.
Currently, price has broken out of the descending channel, confirming the start of Wave G, which could extend toward the $7.0 zone — aligning with the previous Wave A resistance.
Key Points:
• 🌀 Completed Diametric structure (A–G) over ~233 days
• 🟢 Breakout from the descending wedge
• 🎯 Potential target: $6.8 – $7.2
• ⚠️ Support to watch: $4.8 – $5.0 (retest area)
If momentum holds, this move could mark the first bullish leg of a larger reversal phase.
USDT.D 4H Analysis - Key Triggers Ahead☃️ Welcome to the cryptos winter , I hope you’ve started your day well.
⏰ We’re analyzing USDT Dominance on the 4-Hour timeframe .
👀 On the 4-hour timeframe, USDT Dominance has started to recover after its recent drop, bouncing from the support zone at 4.17% and now moving upward, forming a reaction to the previous bearish leg. The structure shows a steep descending trendline, and once broken and confirmed above, dominance could move toward its next resistance zones and enter a correction phase relative to its previous leg. The key resistance levels to watch are 4.33% and 4.38%.
🧮 The RSI oscillator currently faces a static resistance around 45. If volatility pushes above this level and holds, it would confirm bullish momentum and act as a signal for correction continuation.
🕯 The recent candles on Tether Dominance have shown range-bound behavior with weakening bearish pressure, while the 4.17% support has attracted buyers — causing an increase in bullish candles and momentum toward upper resistance zones. A breakout above the descending trendline could confirm a corrective move upward, which seems quite plausible given the current 4H candle structure.
🧠 For profit-taking strategies, you may consider securing partial profits from your open long positions, or moving your stop-losses into profit to protect gains. Meanwhile, start refreshing your watchlist and identifying new price triggers so that you can re-enter positions after reaction or breakout confirmations from upcoming setups.
❤️ Disclaimer : This analysis is purely based on my personal opinion and I only trade if the stated triggers are activated .

USDJPY near Resistance? Holds or not??#USDJPY.. market just reached near to his resistance area that is around 150.80-85
Keep close if market hold it in tha tcase we can expect again selling otherwise not at all.
Good luck
Trade wisely

TradeCityPro | PENDLE: Near Breakout From Descending Trendline👋 Welcome to TradeCity Pro!
In this analysis, I want to review the PENDLE coin for you — one of the projects in the Ethereum ecosystem, currently ranked 93rd on CoinMarketCap with a market cap of $858.76 million.
📅 Daily Timeframe
On the daily timeframe, this coin has formed two trendlines. The main trendline is the long-term ascending trendline that the price has respected for a long time, while the second is a continuation descending trendline — if broken, the previous bullish move can resume.
✨ Since the overall trend is bullish, the continuation trendline is currently more important for us, because breaking it would confirm the continuation of the uptrend.
🔍 This trendline formed after the price reached the 5.732 level and made a fake breakout.
📊 The breakout trigger for this trendline is currently at 5.344. Breaking this level can provide an opportunity to open a long position on PENDLE.
🛒 For spot purchases, this same 5.344 trigger can be used, but the 5.732 level would be a much safer confirmation for a spot entry.
✅ The main confirmation of bullish continuation in higher cycles will come after breaking 6.857.
🎲 It’s important to note that any bullish breakout must be accompanied by an increase in volume, otherwise the move could easily turn out to be fake.
⚡️ If the ascending trendline breaks, the trigger for this breakdown is at 4.431. Breaking this level is not an ideal short trigger, but if the price stabilizes below it, you can consider activating your stop-loss in case you’ve already bought the coin in spot.
🧩 The next support levels in case of further decline are 3.741 and 3.017.The momentum trigger on the RSI is at 39.16.
📝 Final Thoughts
Stay calm, trade wisely, and let's capture the market's best opportunities!
This analysis reflects our opinions and is not financial advice.
Share your thoughts in the comments, and don’t forget to share this analysis with your friends! ❤️

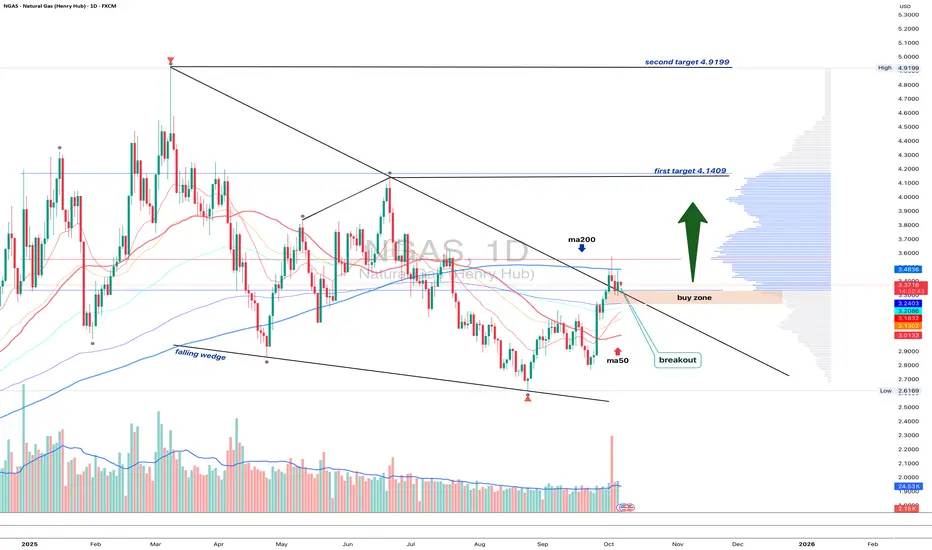
NGAS 1D - bulls waiting for the green lightOn the daily chart, Natural Gas has broken out of a falling wedge, but price remains below the MA200, while EMA still hovers above it - a mixed signal showing short-term hesitation within a longer-term downtrend.
The 3.10–3.20 buy zone remains key - that’s where the retest area aligns with short-term support. If buyers can reclaim the EMA and push above the MA200, the next upside targets are 4.14 and then 4.92.
Volume on the breakout supports growing bullish interest, while fundamentals - like rising seasonal demand - may soon add more fuel to the move.
Tactically , watch how price behaves near MA200. Once EMA flips back on top, momentum could accelerate fast. Until then, the market’s like a gas burner waiting for that click - ignition pending
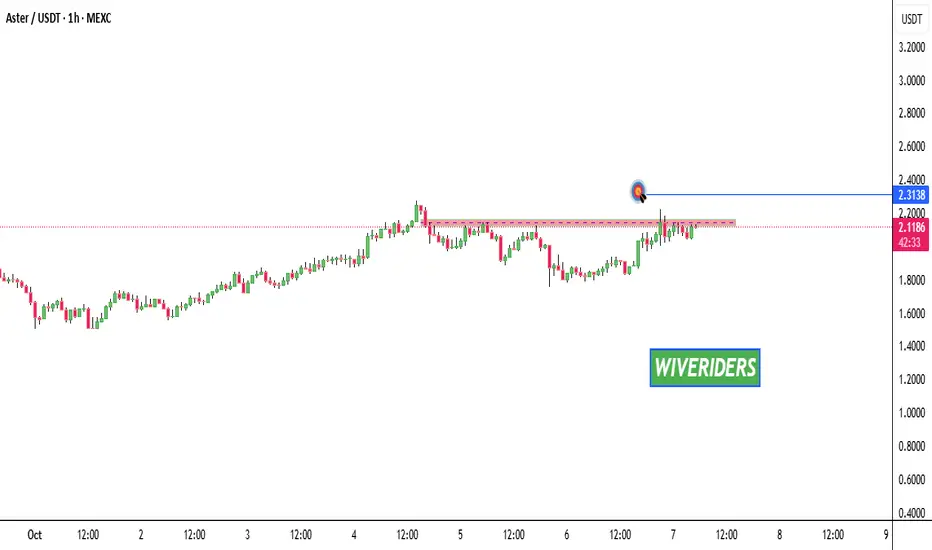
ASTER Update📊 ASTER Update
SEED_WANDERIN_JIMZIP900:ASTER is testing the red resistance zone 🔴
If it breaks out, the first target will be the blue line level 🔵
USDCNY My opinion..I have a screenshot of this that I took before, I will share it on X. Everything continues at the setting I planned. First, I will clarify my opinion and say it after a little decline.

EUR/USD The season of the Euro has arrived..The season of the Euro has come, while entering the winter months, the period when the Euro is strong again until the summer month of next year.

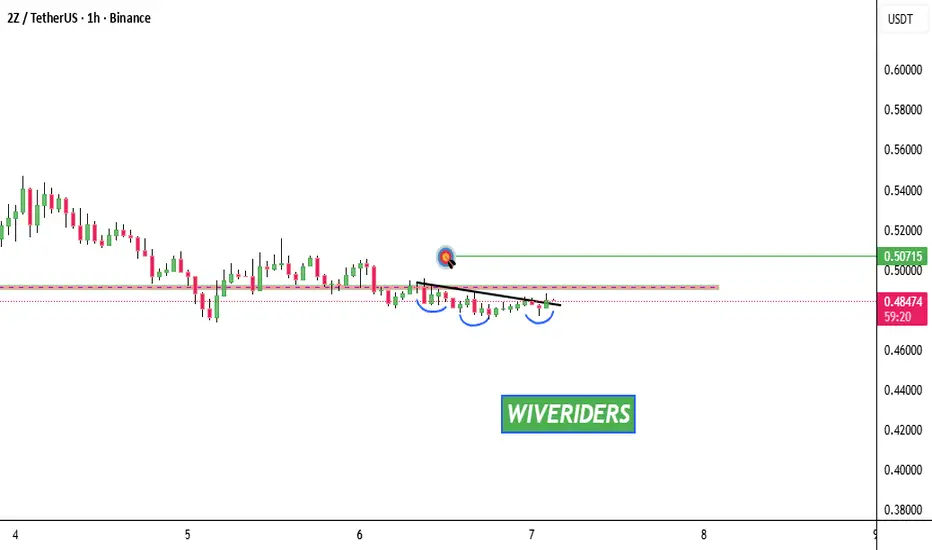
2Z Update📊 $2Z Update
$2Z is testing the red resistance zone 🔴
If it breaks out, the first target will be the green line level ✅
QNT Update📊 QNT Update
QNT is testing the red resistance zone 🔴
If it breaks out, the first target will be the green line level ✅

LINK Update📊 LINK Update
LINK has formed a bullish double bottom pattern and successfully reached the first target ✅
Now we’re waiting for the second target at the green line level 🚀

AAVE Update📊 CRYPTOCAP:AAVE Update
CRYPTOCAP:AAVE has successfully broken out of the red resistance zone 🔥
✅ First target reached — and now second target green line level also 🚀

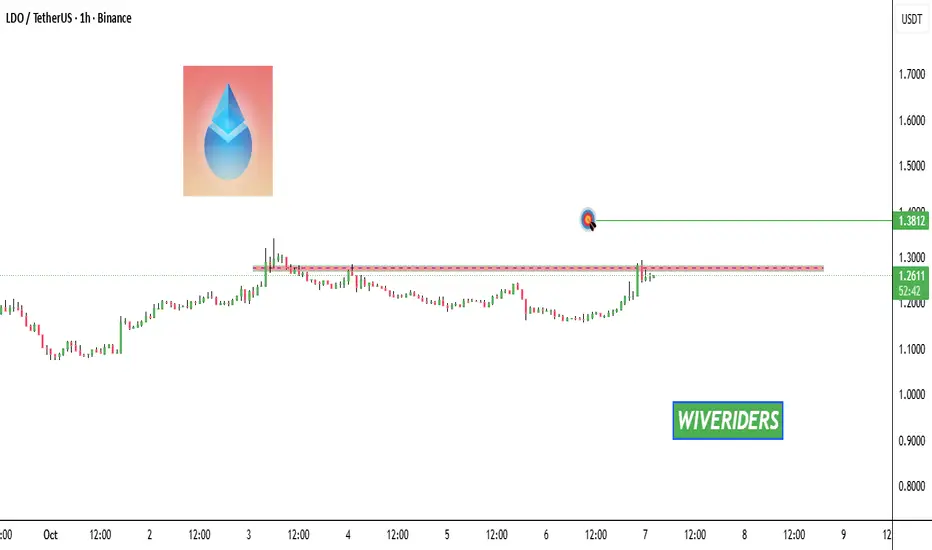
LDO Update📊 LDO Update
LDO is testing the red resistance zone — watch closely 👀
If it breaks out, the first target will be the green line level 🚀