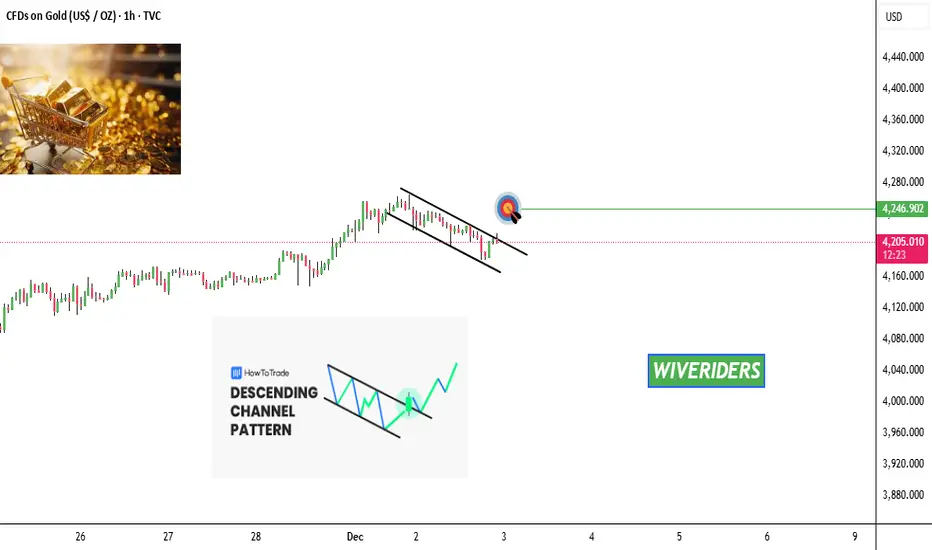
GOLD is forming a descending channel pattern 📊 GOLD Update
GOLD is forming a descending channel pattern 🔻📉 —
a structure that often leads to a strong move once price breaks out.
Right now, price is still moving inside the channel,
but if GOLD breaks above the descending trendline,
we could see momentum shift and price push toward the first target at the green line level 🟩.
Here’s the key breakdown:
Pattern: Descending Channel
Bullish signal triggers ONLY if we break out upward
A clean breakout = momentum toward the green target zone
Until breakout, sellers remain in control inside the channel
Watch for:
✔️ Strong breakout candle
✔️ Volume confirmation
✔️ Retest holding as support (optional but bullish)
If breakout happens → first target = green line level 🟩
Tradingview
TradeCityPro | Bitcoin Daily Analysis #238👋 Welcome to TradeCity Pro!
Let’s move on to today’s Bitcoin analysis. The market is currently in a correction phase after the bearish leg it experienced yesterday.
⏳ 1-Hour Timeframe
After the drop Bitcoin made, even fake-breaking the 85,220 level,
✔️ the price has started its correction, reaching up to 87,088.
🔔 During this correction, a Head & Shoulders pattern has formed, with the activation trigger being the 87,088 level.
💥 If this pattern gets activated, deeper corrections could follow.
The next resistance zone to watch is 89,082.
📊 Market volume has increased with the start of the new week, but during this correction, the volume is decreasing. This indicates that the downtrend still holds strength, and the likelihood of the trend continuing remains high.
💡 In this case, we can open a short position either after a fakeout at 89,082 or by confirming a Dow Theory breakdown.
The main short trigger right now is the 85,220 level.
📈 For a long position, breaking 89,082 is a risky trigger.
Personally, I prefer to wait for more confirmation before deciding to enter a long position on Bitcoin.
❌ Disclaimer ❌
Trading futures is highly risky and dangerous. If you're not an expert, these triggers may not be suitable for you. You should first learn risk and capital management. You can also use the educational content from this channel.
Finally, these triggers reflect my personal opinions on price action, and the market may move completely against this analysis. So, do your own research before opening any position.

a QuickScalp on #GBPUSD📌 Market Insight: {#GBPUSD }
⚠️ Risk Assessment: {High}
🚀 Approach:
Same as UJ , Not a perfect setup ... need valid LTF entry sign first .
No rush .
Just for QuickScalp
#Ash_TheTrader #Forex #GBPJPY #MarketAnalysis #TradingSetup #RiskManagement #GOLD #Scalper #NQ #EURUSD

a HighRisk QuickScalp on #USDJPY📌 Market Insight: {#USDJPY }
⚠️ Risk Assessment: {High}
🚀 Approach:
Not a Quality setup right now ... and need a valid LTF entry . without it , should skip this setup ... NO RUSH
#Ash_TheTrader #Forex #GBPJPY #MarketAnalysis #TradingSetup #RiskManagement #GOLD #Scalper #NQ #EURUSD

AAVE Update🚨📊 AAVE Update
AAVE has formed a double bottom pattern,
which is normally a strong bullish reversal signal —
but we still have a red resistance zone 🔴
sitting right above the price.
This red zone is acting as a strong ceiling,
and price must break above it
for the double bottom to fully confirm and momentum to continue higher.
Until that breakout happens,
upside stays limited and sellers remain active at this zone.

FireHoseReel | Aster DEEP ReSearch: EP2 - How Aster Was born ?🔥 Welcome To FireHoseReel !
Let's dive into Aster Deep ReSearch EP2 - How Aster Was Born ?
🏗 How It All Started
Aster DEX was launched in 2024 through the strategic merger of two DeFi projects: Astherus, a yield-focused protocol, and APX Finance, a decentralized perpetual exchange.
By combining expertise in both yield generation and derivative trading, Aster formed a comprehensive platform capable of attracting sustainable liquidity and enabling ultra-fast perpetual markets.
🚀 Boosted by Binance Chain’s infrastructure and liquidity, Aster saw explosive growth. By the end of 2025, the platform had processed over $500 billion in cumulative trading volume and onboarded more than 2 million users — a massive milestone for a newly launched DEX.
🧬 Backing from YZi Labs, a firm closely tied to Binance, played a crucial role in this success. Even CZ (Changpeng Zhao), Binance’s founder, publicly endorsed Aster during its early token launch. This strong industry support earned the trust of the community and fueled rapid tech development.
⚙️ Multi-Layered Architecture & Trading Modes
Aster DEX is designed as a modular trading ecosystem that merges high-speed derivatives, spot markets, and yield opportunities into a single platform — optimized for both newcomers and advanced traders.
🔄 Simple Mode (Up to 1001× Leverage)
Aster’s Simple Mode offers a frictionless experience with:
• No gas fees
• No MEV risk
• Direct wallet-based execution
• Trades routed through a shared liquidity pool (ALP)
Key Highlights:
• Up to 1001× leverage on BTC pairs
• 250× on ETH, 75× on altcoins
• Instant trades — no deposits needed
• Oracle-based pricing (Chainlink & Pyth)
• Dynamic funding rate updates to minimize liquidation risks
🔧 Simple Mode brings the ease of AMMs into leveraged derivatives — ideal for fast, low-friction perpetual trading.
📊 Pro Mode (On-Chain Order Book & Institutional Tools)
Pro Mode offers a full-featured, CEX-style experience on-chain — ideal for professional traders.
What it includes:
• On-chain order book with fast matching
• Market, limit, stop-loss, and trailing-stop orders
• Advanced tools like Grid Trading bots
• Position management: TP/SL, Post-Only, timed execution
• Ultra-low fees: 0.01% maker / 0.035% taker
💼 Aster Pro also introduces Hidden Orders (dark-pool-style), allowing large traders to conceal order size until after execution. This prevents front-running and reduces market impact — a rare DeFi feature.
🧾 Beyond Crypto: Perpetual Stocks
Aster DEX expands beyond crypto into traditional assets via stock perpetuals — offering 24/7 trading on blue-chip equities like Apple and Tesla.
Features:
• Up to 50× leverage
• Crypto-collateralized (e.g., USDT)
• Trade traditional assets even outside stock market hours
🏪 The platform also includes an integrated spot exchange for quick swaps between BTC, ETH, USDT, and ASTER — enabling easy onboarding for new users.

FireHoseReel | USDT Dominance at a Critical Turning Point🔥 Welcome to FireHoseReel !
Let’s dive into the USDT Dominance (USDT.D) analysis.
👀 USDT.D 1H OverView
USDT dominance moved higher after breaking our key level and is now facing a rejection near 6.491%.
⚡️ Fibbo Retracement
We have applied Fibonacci retracement from the recent low to the high, which clearly highlights the critical levels.
Forming a higher low on these zones could confirm a renewed bullish continuation in dominance.
However, a break below the 0.618 Fibonacci level and the formation of a lower low could act as an early trend reversal signal, forcing us to shift our multi-timeframe market bias.
❤️ Risk Management & Emotional Discipline
Crypto trading is highly risky. Without proper risk management and emotional control, trading is no different from gambling.
Logic must always come before emotions. Learn to manage your trades—and enjoy the process of trading with control and discipline.

FireHoseReel | TON’s Last Support of Defense🔥 Welcome to FireHoseReel !
Let’s dive into the analysis of Telegram Coin (TON).
👀 TONUSDT 4H Overview
TON has reached a very critical support zone. A clean break below this level could activate our next short trigger and lead to a deeper drop than many expect.
📊 Volume Analysis
Selling pressure during the formation of this support has been significant. With heavy market FOMO, many traders have already exited their TON positions. If this downside momentum continues, TON could enter a deeper corrective phase.
🔁 TONBTC Prespective
Meanwhile, the TON/BTC pair is also in a bearish structure, indicating that TON’s relative strength against Bitcoin is weakening.
📌 Trading Scenario
At the moment, TON presents one primary scenario, focused on the short side, which you can use alongside your own trading setup.
🔴 Short Scenario
A breakdown below the current support at $1.465, confirmed by a strong increase in sell volume, could trigger a sharp decline in TON.
❤️ Risk Management & Emotional Discipline
Crypto trading is highly risky. Without proper risk management and emotional control, trading is no different from gambling.
Logic must always come before emotions. Learn to manage your trades—and enjoy the process of trading with control and discipline.

FireHoseReel | CAKE at a Critical Support Zone🔥 Welcome To FireHoseReel !
Let's dive into Cake analysis, the native token of PancakeSwap DEX.
👀 CAKE – Short-Term Market Breakdown
After breaking its newly formed support at $2.342, CAKE moved sharply lower and formed a temporary support around $2.233.
A breakdown below $2.233 could activate the next major downside trigger.
📊 Volume Analysis
Selling pressure on CAKE has intensified aggressively.
In a single 4H candle, sellers dominated the market with heavy force.
If sell volume expands again, the current downtrend is likely to continue with momentum.
🔁 CAKE/BTC Perspective
The CAKE/BTC pair is still holding a bullish structure, but a loss of its current support could trigger a corrective phase in the BTC pair as well.
📌 Trading Scenario
This scenario can be used alongside your own trading strategy and risk management.
🔴 Short Scenario
Breakdown below the newly formed support at $2.233
Must be accompanied by a strong increase in sell volume
This could push CAKE lower and may also trigger a support breakdown on CAKE/BTC, adding further downside pressure.
❤️ Risk Management & Emotional Discipline
Crypto trading is highly risky. Without proper risk management and emotional control, trading is no different from gambling.
Logic must always come before emotions. Learn to manage your trades—and enjoy the process of trading with control and discipline.

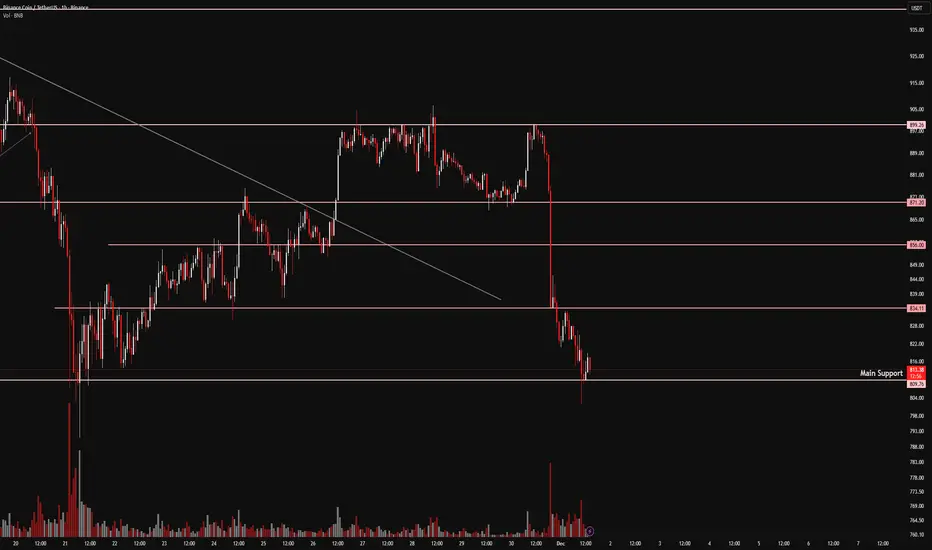
FireHoseReel | BNB Daily Analysis #12🔥 Welcom To FireHoseReel !
Let's dive into BinanceCoin (BNB) Analysis .
👀 BNB – Short-Term Breakdown Watch
After losing the $871 support, BNB experienced a sharp sell-off into the current zone since last night. We are now waiting for the next directional move.
A clean break below $810 could activate our next major trigger.
📊 Volume Behavior
Selling pressure has clearly increased during the recent drop.
During any short-term correction, buy volume is expected to stay weak, keeping pullbacks shallow.
For a valid continuation to the downside, the $810 support must break with strong sell volume.
📌 Today’s Active Scenario
For today, only one primary scenario is in focus, and it can be used alongside your own trading strategy.
🔴 Short Scenario
• Breakdown below $810
• Confirmed by a clear increase in sell volume
This would provide a solid short entry setup.
Even if market FOMO is extreme, decisions must stay strictly logic-based. A second touch after the break offers a more reliable entry.
❤️ Risk Management & Emotional Discipline
Crypto trading is highly risky. Without proper risk management and emotional control, trading is no different from gambling.
Logic must always come before emotions. Learn to manage your trades—and enjoy the process of trading with control and discipline.
FireHoseReel | BNB Daily Analysis #11🔥 Welcome To FireHoseReel !
Let's dive into BinanceCoin ( BNB ).
👀 BNB is currently attempting to break a strong support zone at $873. A confirmed breakdown of this level could activate our short trigger.
📊 BNB volume has dropped sharply. One key reason is a completed multi-timeframe distribution structure, along with the impact of the current holiday period. The first strong volume expansion will likely define the next price direction.
🧮 The RSI oscillator remains in the 36.5 range, similar to yesterday. A breakout from this range, aligned with volume expansion, would confirm momentum entering BNB’s next move.
✍️ I will update the scenarios for you, though they remain mostly unchanged from yesterday, with only minor shifts in support levels.
🔴 Short Scenario: A clean break below the marked support with rising sell volume can provide a valid short setup. However, without RSI confirmation, risk should be reduced due to the possibility of a fake breakdown.
🛞 Risk Management & Disclaimer
Please remember to always use proper risk management and position sizing. Nothing in this analysis is financial advice. The market can change quickly, so always trade based on your own strategy, research, and risk tolerance. You are fully responsible for your own trades.

FireHoseReel | LTC:When does Litecoin explode next?🔥 Welcome to FireHoseReel!
Let’s dive into the 4H Litecoin (LTC) analysis.
👀 Litecoin is currently trading below a descending curve trendline.
Each time price hits this curve, it gets rejected to the downside. Price is now approaching the end of this compression zone, while a key support has formed at $81.48 near the bottom.
📊 Litecoin volume has been declining during the recent drop and is now at very low levels.
Once volume expands again, any upcoming move in LTC is likely to become more impulsive and powerful.
✅ The LTC/BTC pair is also in a strong corrective phase, showing a noticeable decline in Litecoin’s relative strength against Bitcoin.
✍️ You can review the main Litecoin scenarios below and use them alongside your own trading strategy if needed.
🟢 Long Scenario:
A breakout above the descending curve trendline, followed by a clean pullback, and then a push toward the static resistance at $87.42 with rising buy volume, could activate our long trigger.
🔴 Short Scenario:
A breakdown below the $81.48 support with a confirmed close below this level and increasing sell volume could activate our short trigger.
❤️ Risk Management & Emotional Discipline
Crypto trading is highly risky. Without proper risk management and emotional control, trading is no different from gambling.
Logic must always come before emotions. Learn to manage your trades—and enjoy the process of trading with control and discipline.

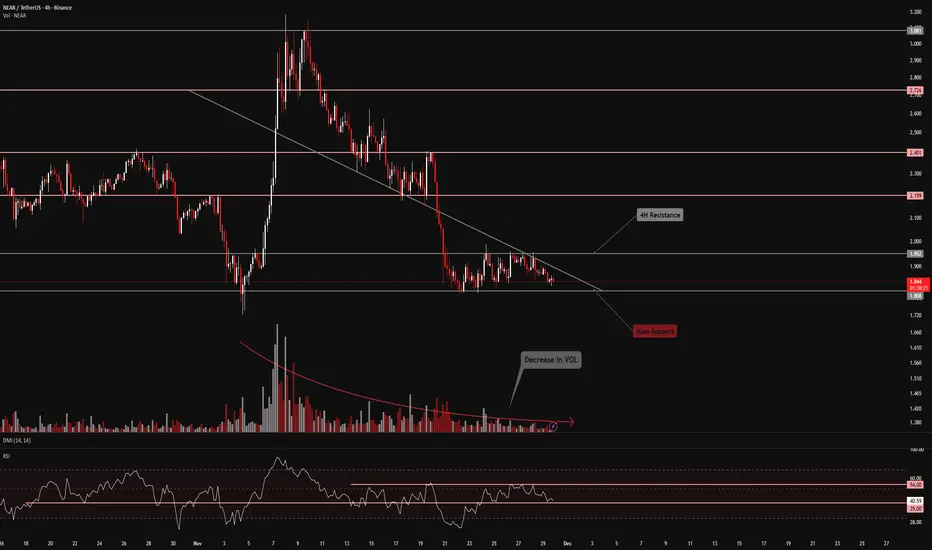
FireHoseReel | NEAR: Bulls and Bears Face Off at Key Levels🔥 Welcome to FireHoseReel !
Let’s dive into the 4H analysis of NEAR.
👀 After a sharp and powerful rally, NEAR faced a heavy rejection at the $3.081 level and entered a corrective phase.
This correction has been unusually deep and aggressive.
📉 NEAR is now sitting on a critical support at $1.808. Losing this level could activate our short trigger and open the door for further downside.
📊 NEAR’s trading volume has dropped, similar to many other coins in the market.
The first solid volume expansion will likely signal NEAR’s next directional move.
🔭 NEAR is known for making sharp moves after losing or reclaiming key support or resistance levels, which often provides excellent risk-to-reward opportunities.
✍️ Potential NEAR scenarios are outlined below.
Always make sure to use them alongside your own trading strategy.
🟢 Long Scenario:
A breakout above the major resistance at $1.952, supported by rising buy volume and an RSI break above 54, could trigger a valid long setup.
🔴 Short Scenario:
A breakdown below the critical support at $1.808, combined with increasing sell volume and RSI dropping below 39, could lead to a significant downside move.
❤️ Risk Management & Emotional Discipline
Crypto trading is highly risky. Without proper risk management and emotional control, trading becomes pure gambling.
Let logic always lead your decisions—not emotions. Trade with control and discipline.
FireHoseReel | Aster: ASTER Bears Are Taking Control🔥 Welcome to FireHoseReel !
Let’s dive into the ASTER analysis.
⚡️ ASTER was moving along a bearish curve, broke its key support, and has now printed a 4H candle close below 1.078 — which confirms the breakdown.
📊 ASTER volume has dropped significantly.
This low volume suggests that a strong expansion may be ahead, and if the next move aligns with the trend, it could offer a solid risk-to-reward setup.
🧮 The RSI oscillator is now testing the 37.5 level.
This zone represents the 4H oversold area for ASTER, which can help accelerate bearish price movement if momentum continues.
✍️ There is currently one main scenario for ASTER, detailed below.
🔴 Short Position Scenario
If ASTER continues to close below this level, accompanied by rising sell volume and RSI breaking below 37.5, the bearish trend can be considered confirmed.
🛞 Risk Management & Disclaimer
Please remember to always use proper risk management and position sizing. Nothing in this analysis is financial advice. The market can change quickly, so always trade based on your own strategy, research, and risk tolerance. You are fully responsible for your own trades.

PENGU Update🚨📊 PENGU Update
PENGU is testing the blue support level right now 🔵.
If this support breaks down,
it could become a short opportunity,
with the green line level 🟢 as the main target.
If price drops from here,
we could see PENGU fall at least 40% —
this is a critical support zone and losing it would signal strong bearish momentum.

IP Update🚨📊 IP Update
IP is testing the blue support level right now 🔵.
If this support breaks down,
there is a possibility to enter a short position,
with the green line level 🟢 as the main target —
the next major support zone on the chart.
Wait for a clear breakdown confirmation before entering any short.

TIA Update🚨📊 TIA Update
TIA has broken down below the blue support level 🔵❗
With this support now lost,
price could drop toward the green line level 🟢 —
the next major support zone on the chart.

ZEC Update🚨📊 ZEC Update
ZEC is testing an important support level in blue right now 🔵.
If this support breaks down,
we could expect ZEC to drop toward the next major support zone
around $259, which is marked at the green line level 🟢.
This is a critical area —
a clean breakdown could trigger a deeper move.

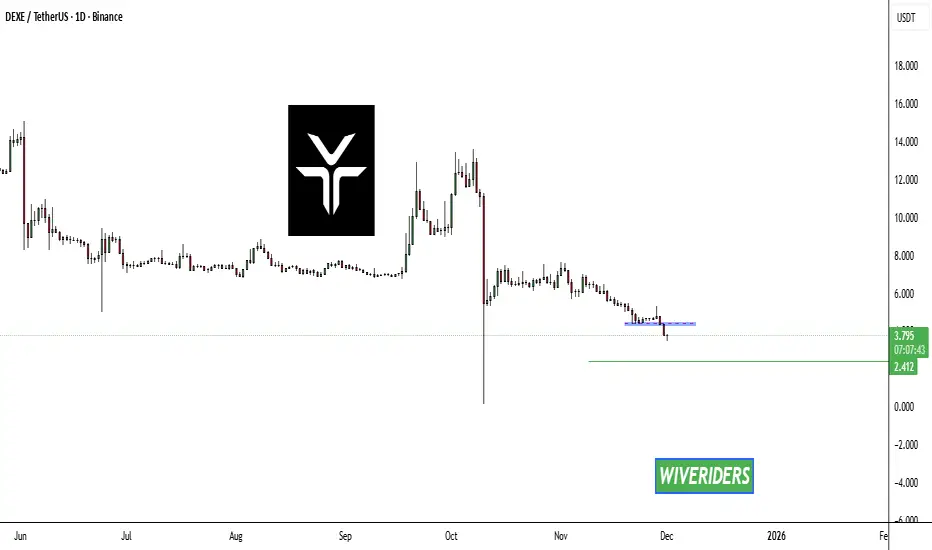
DEXE Update📊 DEXE Update
DEXE has broken down below the blue support zone 🔵❗
With this support now lost,
price could at least drop toward the green line level 🟢 —
the next major support area on the chart.
XAUUSD / GOLD trade ideaGOLD has just broken above a major level of resistance which has now turned into a support after a retest. An anticipation of a further push to the upside and possibly a push to the next key level. Waiting for the right confirmations to execute

GOLD at cut n reverse area? whats next??#GOLD - market perfectly moved as per our last idea regarding gold and now market just trade above his resistance area.
that resistance area is turned into supporting area after break above and sustain. that is 4245
keep close that area 4245 and holding of that area means we can expect further bounce otherwise not at all.
NOTE: we will go for cut n reverse below 4245 on confirmation.
good luck
trade wisely

TradeCityPro | Bitcoin Daily Analysis #237👋 Welcome to TradeCityPro!
Let’s move on to the Bitcoin analysis. The market experienced a strong drop yesterday, and with the start of a new week and a new month, a fresh trend is beginning to form.
⏳ 1-Hour Timeframe
Yesterday, we had a long trigger on Bitcoin at 91,089. After activation, the price moved upward toward 91,813.
🔔 The 91,813 level was our next long trigger, and breaking it could have pushed the price toward the main resistance at 93,555.
✔️ But that didn’t happen.
The price was rejected from 91,813, and gradually, selling pressure increased across the market.
📊 Once the price stabilized below 90,421 — which was our short trigger — the main bearish move began. Bitcoin dropped sharply with a large bearish candle all the way down to 85,770.
🔍 The support zones at 89,082 and 87,942 did not hold either, because the move was extremely sharp and the price ignored them entirely.
💥 If you remember, we also had a momentum support on the RSI at 42.11.
💫 Once RSI stabilized below that level, the bullish momentum completely disappeared. Momentum shifted fully to bearish.
⚡️ Right now, RSI is still in the oversold zone and is pulling back toward the 30 level.
⚖️ If RSI starts moving downward again from here, Bitcoin has the potential to drop much further.
💡 Today, opening a position is much riskier than yesterday, but if you missed the move, breaking 85,770 isn’t a bad option for a continuation short.
✨ Just be careful: the market today is far more risky, so take positions with smaller risk and tighter management.
❌ Disclaimer ❌
Trading futures is highly risky and dangerous. If you're not an expert, these triggers may not be suitable for you. You should first learn risk and capital management. You can also use the educational content from this channel.
Finally, these triggers reflect my personal opinions on price action, and the market may move completely against this analysis. So, do your own research before opening any position.

GOLD cut n reverse region? What's next??#GOLD.. perfect move as per our last couple of ideas regarding gold.
Now market current and immediate supporting region will be from 4205 to 4210 around
That region will be our most important supporting region and our cut n reverse region as well.
Keep close and stay sharp guys.
NOTE: we will goe for cut n reverse below 4205 on confirmation.
Good luck
Trade wisley
