BHARATFORG Breaking Out | Targets 1,400+BUY Setup 🔨
Entry: ₹1,300-1,305 (Current Level)
Target 1: ₹1,330-1,340
Target 2: ₹1,365-1,375
Target 3: ₹1,400+ (Extended)
Stop Loss: ₹1,275
Technical Rationale:
Strong bullish momentum with +4.56% gain today
Breaking above major descending trendline resistance (visible from June highs)
Consolidation breakout from 1,265-1,285 range
Good volume (3.45M) supporting the breakout
RSI around 65, showing strength with room for further upside
Price attempting to cross key resistance at 1,300 psychological level
Falling wedge pattern breakout - typically bullish
Auto sector strength supporting the move
Support established at 1,280 zone
Risk-Reward: Favorable 1:3 ratio
Pattern: Descending wedge breakout - classic bullish reversal pattern
Strategy: Positional trade - Book 40% at T1 (1,335), 30% at T2 (1,370), trail remaining with SL at 1,310 after T1
Key Levels:
Strong Resistance: 1,310, 1,340, 1,365
Support: 1,280, 1,265
Tradingview

BTCUSD – When the Whales Dump, Bitcoin Free-Falls Without BrakesHey traders,
The crypto market is once again in turmoil! Bitcoin has just dropped below $100,000 , its lowest level in months, after whales unloaded over $45 billion in positions — a powerful blow that shook the entire market.
At the same time, expectations for a Fed rate cut in December are fading , spreading a broad “risk-off” sentiment. Investors are pulling money out of risk assets, flowing instead into the USD and bonds, adding more downward pressure on crypto.
On the 4-hour chart, the bearish structure remains dominant. Price continues to move inside a descending channel , with the $104,600 area now acting as a critical short-term resistance. Every rebound has been swiftly rejected — a clear sign that the market isn’t ready for any meaningful recovery yet.
If price fails to retest and hold above $104,600, the next likely scenario is a drop toward $96,700, where the next major support zone lies.
Right now, the market looks like it’s exhaling after a leverage hangover . With both fundamental and technical pressure converging, the bearish trend remains the dominant direction for Bitcoin in the short term.

EURUSD 1D: bearish bias remains - trend break is confirmedEURUSD confirmed a break of the major daily trendline and failed to reclaim 1.1600. Buyers lost structure, every bullish bounce is absorbed. Market shows a clean shift to downside momentum.
Expect a corrective pullback into 1.1600–1.1700 (Fibo 0.382–0.5). This area remains the primary supply zone and ideal entry for continuation shorts.
Targets:
• 1.1407 — first liquidity zone
• 1.1389 — bearish continuation trigger
• 1.1150 — major demand zone and final target
Expectations vs reality: buyers hope for reversal, price structure signals continuation down. No guessing - trade what market prints.

Teva: The flag’s ready — someone just needs to hit “launch”Teva Pharmaceutical (TEVA) is setting up for a potential continuation move after a clean impulse. On the daily chart, we have a textbook bull pennant — and not just any sloppy one. Price has broken above the 200-day moving average, and all key EMAs (50/100/200) now sit below price, confirming a solid bullish structure.
Volume behavior fits the script: declining inside the pennant, signaling pressure is building. More importantly, the Volume Profile reveals a low-volume void above current levels — meaning there’s little resistance until we hit the $22+ zone. In other words, once this breaks, it could run fast.
RSI is comfortably in bullish territory without being overheated, and the flagpole projection gives us clean upside targets:
– Entry: breakout above pennant resistance
– Target: $22.80 — full flagpole height
– Support: $17.60 — confluence of 0.5 Fib + volume base
TEVA isn’t asking for confirmation anymore — it’s showing it. All systems are technically armed. Now we just wait for the market to press the button.

TradeCityPro | Bitcoin Daily Analysis #211👋 Welcome to TradeCity Pro!
Let’s dive into the Bitcoin analysis. The market is still in a downtrend and has reached its next support!
⏳ 4-Hour Timeframe
Bitcoin finally broke the important support at 106,396 yesterday, and with a very high selling volume, it managed to start its new downward wave.
💥 The RSI oscillator also entered the oversold zone at the same time as the 106,396 break, which was another reason for the market's drop.
⚡️ This downward move has reached the 100,308 support, and the price has calmed down a bit now.
✅ The psychological level of 100,000 is extremely important. Despite the massive selling volume and bearish momentum in the market, buyers haven’t allowed the price to stabilize below this level, and now the market is in a corrective phase.
🧩 After the price reacted to this zone, the volume has significantly decreased, which favors the sellers. If the buying volume remains low, the price will likely start falling again with the entrance of new selling volume.
🔔 However, since the RSI has faked the 30 level and the market momentum could turn bullish, we could see a reversal. If the volume starts to increase and considering the bullish trend on higher timeframes like the weekly chart, we could open a position.
🔍 For now, the first long trigger we have in this timeframe is 111,789. If the price can sharply recover to this level, a very strong bullish trend could begin.
💡 The main resistance zone we have is 115,771, and breaking this level will confirm the start of Bitcoin's new upward wave. We can look to enter the trend after breaking 111,789. If the price builds further structure, we can enter earlier with smaller triggers.
❌ Disclaimer ❌
Trading futures is highly risky and dangerous. If you're not an expert, these triggers may not be suitable for you. You should first learn risk and capital management. You can also use the educational content from this channel.
Finally, these triggers reflect my personal opinions on price action, and the market may move completely against this analysis. So, do your own research before opening any position.

TradeCityPro | ZEC: Bullish Trend & Key Resistance Levels👋 Welcome to TradeCity Pro!
In this analysis, I want to review the ZEC coin—one of the privacy coins, with a market cap of $7.12 billion, currently ranked 19th on CoinMarketCap.
⏳ 4-Hour Timeframe
This coin is moving completely independently from the market, and while Bitcoin and other altcoins are experiencing significant declines, ZEC continues its bullish trend.
🔔 Currently, the price is within a steep ascending channel, which was formed after breaking the 292 level.
✅ The resistance the price is currently facing is the 474.83 level, and I believe that if this level is broken, we can look for the next long position.
🎲 If this resistance is broken, a bullish leg towards the upper boundary of the channel could form.
💥 The RSI oscillator is moving within a box between 50 and 70, and the 50 level serves as a strong momentum support for this coin.
✨ As long as the RSI stays above 50, the bullish wave will continue, and we can open positions with broken triggers. If the 70 level breaks and enters the overbought zone, the bullish move will become even sharper.
📊 This coin is not suitable for short positions. There are plenty of altcoins that are in a downtrend and have short triggers, so it’s better to focus our attention on ZEC for long positions only.
📝 Final Thoughts
Stay calm, trade wisely, and let's capture the market's best opportunities!
This analysis reflects our opinions and is not financial advice.
Share your thoughts in the comments, and don’t forget to share this analysis with your friends! ❤️

XPeng 1W: cup under pressure, lid about to popTechnically , XPEV is still trading below resistance at 22–23 USD, forming a tight “cup & handle” pattern. The golden cross (MA50 > MA200) adds bullish weight, but there’s no confirmed breakout yet - only a test of the upper boundary. A weekly close above 24 USD would unlock upside targets around 35.6 and 41.6.
Fundamentally , XPeng keeps gaining momentum - October 2025 deliveries hit 42 k EVs (+76% YoY). The firm expands internationally and strengthens its China base, though profitability remains elusive due to heavy investment spending and price competition from BYD and Li Auto.
As long as price stays above 20–21 USD, the bullish structure holds. Losing that area would send the stock back into consolidation.
Sometimes the cup is ready, the handle’s forming - now all that’s missing is the boil.

Bitcoin Losing Steam – Is the $100,000 Zone Calling?Hello everyone, BTCUSDT is currently trading around $109,600, still facing strong pressure from the medium-term descending trendline . After three failed attempts to break above the $112,000 resistance, selling momentum is gradually taking control.
On the macro side, although the Fed cut rates by 0.25% , Chair Powell’s cautious remarks suggest the central bank isn’t ready for an aggressive easing cycle. This “hawkish rate cut” keeps the USD strong and weakens risk appetite — an unfavorable setup for Bitcoin in the short term.
Adding to the pressure, October — typically known as “Uptober” — closed with a sharp red candle , signaling widespread pessimism. Meanwhile, Spot Bitcoin ETFs continued to record hundreds of millions of dollars in outflows , showing that institutional investors remain on the sidelines.
From a technical perspective, the lower-high structure is clearly visible, with EMA34 and EMA89 sitting above the price, reinforcing the bearish bias. If the $105,000 support fails to hold, the next key target lies near $100,000, a level that has historically attracted strong buying interest.
Combining both fundamentals and technicals, BTCUSDT appears to be in a short-term corrective phase , and the likelihood of a retest of the $100,000 zone in the near future remains quite high.

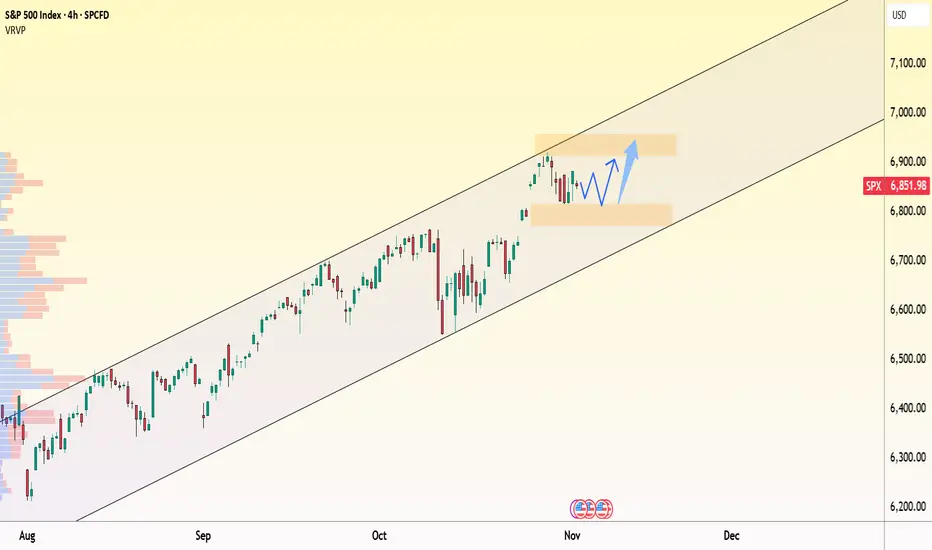
SPX:uptrend remains intact – consolidating for the next breakoutOn the 4-hour chart, the S&P 500 (SPX) continues to move firmly within its ascending channel , with the current range around 6,850–6,900 representing a healthy pause after a strong rally. The nearest support sits at 6,800, where buyers previously stepped in, while short-term resistance remains near 6,900.
From a news perspective, the rally is still being driven by tech and AI sectors , especially after the Amazon–OpenAI partnership deal , which reignited positive sentiment across the market. However, investors remain cautious ahead of upcoming U.S. ADP employment and ISM PMI data , which could influence the Fed’s next rate-cut decision.
Overall, the technical structure still supports an upward bias: SPX is consolidating between 6,800–6,900 before potentially breaking toward the 7,000-point zone , aligning with the upper boundary of the trend channel.
As long as the 6,800 support holds, the market retains room for another bullish leg in the sessions ahead, backed by renewed capital inflows into leading sectors.
BTCUSD 1D - Pause Before the Next Leg Down?On the 4H chart, Bitcoin is retesting a critical resistance area - the 111K–113K sell zone, where a descending trendline, prior support-turned-resistance, and local volume cluster converge. This confluence makes the current level a potential short-entry area.
After failing to sustain above 115K, BTC entered a corrective phase. The recent bounce looks like a retest of the broken structure, and unless bulls reclaim 113K+, the bias remains bearish with a target near 100K–101K, a key liquidity zone.
Technically, momentum is fading:
– Bearish RSI divergence at recent highs;
– Volume contraction on rallies, expansion on drops;
– Price structure forming a likely ABC correction, with wave C projection toward 100K.
Fundamentally , near-term pressure persists as traders take profits and global risk sentiment cools ahead of potential Fed guidance. However, the macro bull case remains intact - hashrate at all-time highs, growing institutional adoption, and supply tightening continue to underpin long-term support.
Tactical plan: short entries near 111K–113K, targets 100K–101K. Invalidation above 113.5K.
Even in a bull market, gravity never takes a holiday.

Grab (GRAB) – Riding the Trend WaveGrab is looking grabbingly strong 😎 — making higher highs and higher lows since 7 April 2025, up almost 95% until 23 September 2025!
The stock broke out of its downtrend line from 21 Nov 2024 with big volume on 11 Sep 2025 — strong confirmation that bulls are taking charge. After the breakout, price retested the trendline (now support) twice and also bounced right from the Fibonacci 38.2% zone. Beautiful confluence! 🎯
The uptrend line from April is still holding well — as long as this stays intact, the party’s not over yet 🕺
📈 Trade Idea:
Entry zone: 5.65 – 5.37
Targets:
TP1 👉 6.60
TP2 👉 7.10
Support / Invalidation: 5.37 zone, uptrend line, or old downtrend line turned support
Summary:
Grab is acting like a true comeback kid 💪 — breakout ✔️, retest ✔️, uptrend intact ✔️.
If momentum keeps building, we might be seeing the next leg up soon! 🚀

Choosing Your Path in Futures TradingThere’s more than one way to participate in the futures markets. Whether you're hands-on or prefer a more passive approach, selecting the right method depends on your trading goals, risk tolerance, and available time. Here’s a breakdown of the most common approaches used by active and aspiring futures traders.
1. Self-Directed Trading
If you like full control over your trades, this approach is for you. It requires staying up to date on market news, analyzing charts, and executing your own trades according to a plan and framework which can be referred to as your “strategy.” Experienced traders may prefer this model for its flexibility and transparency.
Past performance is not indicative of future results.
2. Automated Trading Systems
These systems use predefined rules to analyze data and execute trades without manual intervention. They can be ideal for traders who want to capitalize on algorithmic speed and logic while minimizing emotional decision-making, or for traders who might not have the time to dedicate to self-directed trading.
EdgeClear offers connectivity to a handful of automated programs, if you are interested in learning more please contact us.
3. Managed Futures
For a more passive route, managed futures allow you to invest in futures contracts through a Commodity Trading Advisor (CTA) or Commodity Pool Operator (CPO). The advisor handles the trading, using their expertise to manage risk and seek opportunity.
4. Broker-Assisted Trading
Prefer to have a trusted guide by your side? With broker-assisted trading, a professional helps execute trades, manage risk, and offer support—all tailored to your preferences.
Key Takeaway
Every trader’s journey in the futures markets looks different. Whether you thrive on taking full control of your trades, prefer automated systems, or rely on professional guidance, the key is to find the approach that aligns with your goals, risk tolerance, and lifestyle.
Understanding the options available self-directed, automated, managed, or broker-assisted empowers you to trade more confidently and effectively.
Call to Action
At EdgeClear, we’re dedicated to helping traders at every level find the tools, guidance, and support they need to succeed. Explore our platforms, connect with our expert brokers, or follow us on TradingView to discover more Trade Ideas and educational content to refine your edge.

US Dollar Index (DXY) – 4H Technical Analysis ( Update)US Dollar Index (DXY) – 4H Technical Analysis
Current Price: 99.77 (+0.28%)
Trend: Bullish continuation within a strong uptrend
Technical Overview
The DXY continues its bullish structure, forming a Break of Structure (BOS) above 99.60, confirming a continuation of upward momentum.
Price is trading above the 14 EMA (white) and 200 EMA (yellow), indicating strong bullish momentum and trend alignment.
The market recently tapped into a supply zone near 99.75 – 99.80, showing initial signs of short-term rejection, but the broader trend remains upward.
Key Levels
Immediate Resistance: 99.75 – 99.85 (current supply zone)
Next Resistance: 100.00 (psychological level)
Immediate Support: 99.35 (minor structure)
Major Support Zone: 98.70 – 98.30 (demand area with EMA confluence)
Indicators
Stochastic
RSI currently around 75, approaching the overbought zone, which could trigger a short-term pullback before continuation.
The momentum structure remains intact, and both moving averages are sloping upward — a bullish continuation bias remains valid unless 99.35 breaks down.
Market Context
A strong DXY typically pressures risk assets, including BTC and equities.
Combined with rising USDT Dominance, this reinforces a risk-off environment — investors are moving to safety (USD and stablecoins).
If DXY breaks above 99.80, expect further crypto weakness and possible BTC retest near 104,000 – 102,000.
Summary
Bias: Bullish
Short-Term Expectation: Minor pullback → continuation toward 100.00
Invalidation: A breakdown below 99.35 would signal a shift to neutral and potential mean reversion toward 98.70

The Pink Elephant in Bitcoin That Everyone IgnoresYes, my friends. The game is over, and sadly, it seems like only I have to point this out to you because no one else is talking about it. Let's jump straight into the total liquidity in crypto.
As you can see, it's broken its weekly support. Look, I don't want to say our HWC—or weekly—trend has turned bearish, but I can tell you that if the daily candle closes like this, we're heading into corrections and a whole lot of pain.
Let's circle back to Bitcoin. Starting with the monthly candle
there are 26 days left, so we can't judge it fully yet, but right now, it's looking very bearish: small upper and lower shadows with a full, powerful bearish body. Combine that with the previous four indecisive candles... it's like we've got a car where all the seats are full except the driver's, and suddenly some random seller jumps behind the wheel. Okay, it's done—let's prepare for the drop. But this doesn't mean the HWC has changed ; we're still in an uptrend, and we'd need to break higher highs and lower lows to confirm that. But damn, of course we'll short in its secondary trend... why not?
Moving to the weekly timeframe
as you can see, each wave is proving weaker than the last: the first wave had 180% growth, the second 100%, and the latest one just 50%.
Now, on the daily
it's breaking that key 105k support. Around 100k, we've got another super important support level. If we lose that, the next ones are 98k and 95k. So, open your short positions on the break of 100k—keep in mind, the volatility around there will be intense.
For longs, we've got two scenarios.
1: A reaction at 101k, faking out the 104k break with a reversal pattern, then going long on the break of its resistance (which could be around 108k). Scenario 2: Going long after forming higher highs and lows on the 4H timeframe. Personally, I prefer to hold onto my long bias because, as I mentioned before , Bitcoin's uptrend legs have gone parabolic in this phase. That means if you don't jump in on the first leg, finding a stop loss on the later ones gets tough, you end up with lower R/R, plus a lower win rate—which leads to more losing streaks, more frustration, brewing the worst coffee of your life, and banging your head against everything else :)) So... that's it. Get outta here.

Is a Market Correction Coming? 10 Warning Signs You Can’t Ignore🚨 Markets look euphoric… but data says otherwise.
Hello @TradingView users, hope you are doing well
Here are 10 reasons why we think a sharp pullback could be near
(Not financial advice — just signals stacking up.)
1) Record yield-curve inversion: The 10y–2y spread was negative for a record ~783 days before ending in Sept 2024; such inversions have preceded every U.S. recession in recent decades.
2) Q1 2025 GDP dipped, Q2 rebounded: BEA shows real GDP fell in Q1 2025 (revised −0.6%), then rose +3.8% in Q2 2025. One more weak quarter would meet the “technical” definition, but Q2 strength complicates that path.
3) Cuts usually come with stress: Markets are pressuring the Fed to cut; historically, rate-cut cycles often start when growth/inflation risks tilt weaker (not typically in “booming” conditions).
4) LEI turned down again: After a tiny July uptick, the Conference Board’s LEI fell −0.5% in Aug 2025 and is −2.8% over the last 6 months, pointing to softer momentum (the “15+ straight months” stat is no longer current).
5) Valuations are stretched: The Shiller CAPE > 40, the highest since the dot-com era—historically linked to weaker forward returns.
6) Labor market showing cracks at the margin: Unemployment ~4.3% (Aug 2025) and job openings ~7.2M (Aug)—down from the 2022 peak—suggest some cooling, even if not severe. (I removed the unsourced “+35% layoffs” figure.)
7) Buffett’s record cash: Berkshire now holds roughly $381–$382B in cash & T-bills, an all-time high—interpreted by many as “waiting for better prices.” (Replaces the older $347.7B figure.)
8) Government shutdown risk/drag: The U.S. is in a prolonged federal shutdown (30+ days), with credible estimates of a material GDP hit if it persists—an added macro headwind.
9) Parabolic leaders, dot-com déjà vu vibes: Today’s rally is narrow and AI-led, and valuation gauges echo late-1990s extremes—a setup that can amplify drawdown risk on disappointments.
markets.businessinsider.com
10) Clustering of risks: Yield-curve history + LEI weakness + stretched valuations + policy uncertainty = elevated correction risk, even if timing is uncertain.
Please be cautious, more signals are starting to align, suggesting a potential market drop. From Warren Buffett holding significantly more cash, to the ongoing government shutdown, and even the recent sharp rally that mirrors patterns seen right before the dot-com bubble, the puzzle pieces are starting to fit together.
This message isn’t to cause panic, but rather to remind you to trade carefully and stay prepared either by keeping some cash ready to invest if the market drops, or by simply sticking to your existing long-term investment plan if you have any.
Comment below what YOU think, is this a healthy dip incoming or the start of something bigger?
@TradingView Appreciate it if you guys can feature this post so more traders and investors get the warning and stay safe if the drop happens.
Thank you
Alain M(Coach)
WTW Team
NYSE:DOW NASDAQ:NDX SP:SPX

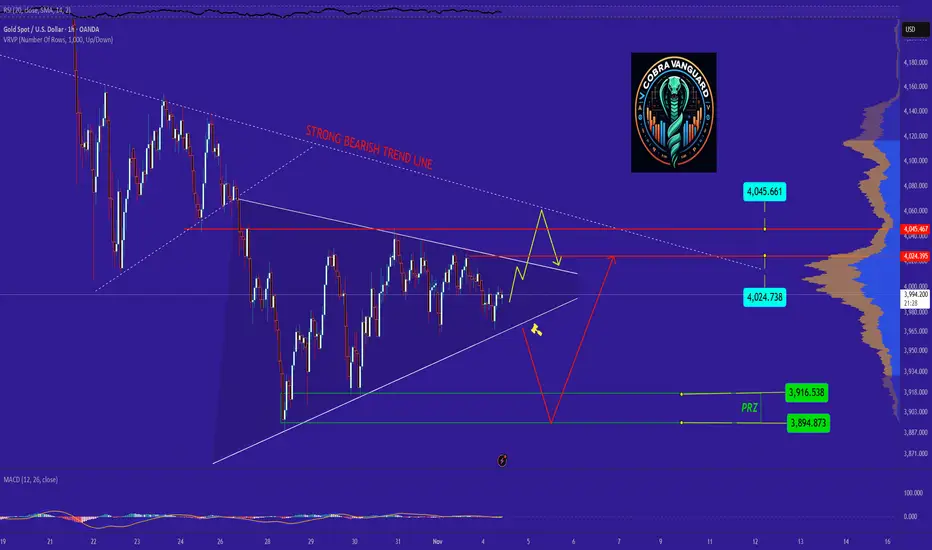
GOLD at the Brink Breakdown or Breakout?GOLD at the BrinkBreakdown or Breakout? —if the triangle breaks downward, it could fall toward the bearish PRZ zone. But if new positive news or rising Middle East tensions emerge, there's hope for a bullish move. For now, the news remains neutral.
What do you think—will GOLD fall or rise?
TradeCityPro | Bitcoin Daily Analysis #210👋 Welcome to TradeCity Pro!
Let's dive into the Bitcoin analysis. The bearish movement of Bitcoin has begun, so it's best to analyze the market together.
⏳ 1-Hour Timeframe
On the 1-hour timeframe, Bitcoin is in a downtrend, and after breaking the 105,780 level yesterday, it continues its downward movement.
📈 The next low point the price reached was 104,488, which has also been broken, and the price is still moving downward.
💥 The RSI oscillator is at a very important support level around 30, and from both a momentum and candlestick perspective, we can say there is no weakness in the trend.
✨ Therefore, a break below the 30 level and into the oversold zone significantly increases the likelihood of a sharp downward move.
✔️ Currently, we don’t have a short trigger because the price has moved very sharply, and no specific trigger has been formed. However, once RSI enters the oversold zone, we can use candlestick setups for entries.
🎲 As long as the price doesn’t create a lower low and lower high below 104,488, I won’t consider the break of this level valid, and there’s a possibility of this bearish move being a fakeout.
🧮 If the price stabilizes above 105,780, it would confirm the fakeout. However, if the price stabilizes below 104,488, the next wave of the drop will begin.
❌ Disclaimer ❌
Trading futures is highly risky and dangerous. If you're not an expert, these triggers may not be suitable for you. You should first learn risk and capital management. You can also use the educational content from this channel.
Finally, these triggers reflect my personal opinions on price action, and the market may move completely against this analysis. So, do your own research before opening any position.

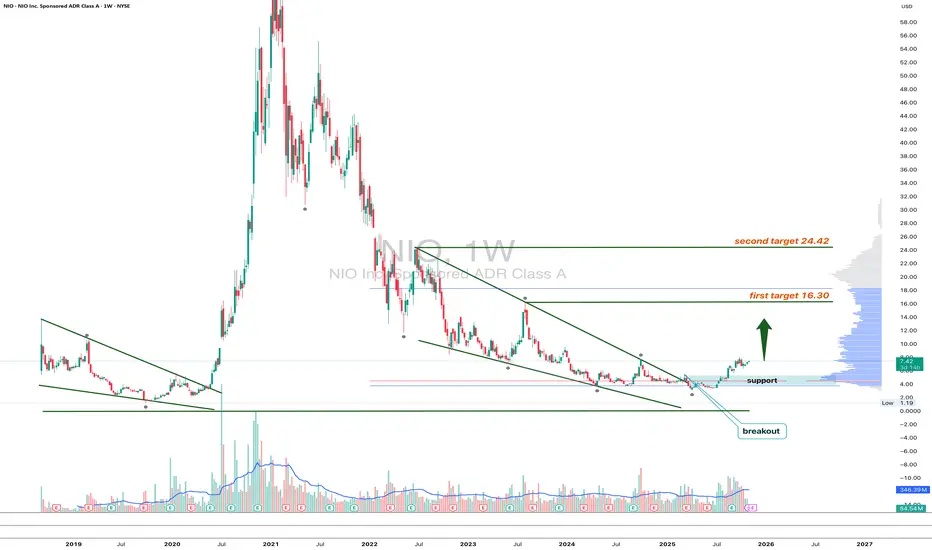
NIO 1W - engine on or just market noise?Technically, NIO has broken out of a long downtrend and is holding above the key $7.4 support. On the weekly chart this looks like the first sign of a long-awaited reversal. Fundamentally, however, the story is still mixed.
The company reported record October deliveries above 40 k units, up roughly 93% year-on-year - strong momentum that shows NIO is expanding its market share in China and entering a new growth phase. Still, free cash flow remains negative and profitability elusive due to heavy investments in battery-swap infrastructure and R&D.
Overall, sales growth and improving brand position support a bullish outlook. As long as price holds above $7.0–7.5, targets at $16.3 and $24.4 remain realistic. A breakdown below $6.5 would invalidate the setup.
Even electric dreams need a full charge - let’s see if this one can make it up the hill.
Bitcoin’s price is at one of its most critical moments yet!👋🏻 Hey everyone! Hope you’re doing great! Welcome to SatoshiFrame channel.
✨ Today we’re diving into the 4-Hour Bitcoin analysis. Stay tuned and follow along!
👀 On the 1-hour timeframe of Bitcoin, we can observe that after failing to break above its key resistance zone, BTC moved toward the multi-timeframe lows. Losing those lows created a selling pressure, pushing the price to retest its fundamental support levels. Currently, I’ve identified two critical zones in my analysis — a breakout from either one could provide a solid trading opportunity.
⌛ Bitcoin’s volume shows a strong bias toward sell positions, to the point where buyers are barely preventing the higher timeframes from entering oversold conditions. However, if this selling pressure and volume persist, Bitcoin could break the lower boundary of its recent daily range and continue downward. Volume data gives us the best insight into market behavior, allowing us to build effective scenarios.
✍️ There are two potential scenarios for Bitcoin that I’ll briefly summarize below — both can be used as setups for positioning.
🟢 Long Scenario: If Bitcoin breaks above the resistance zone at $108,072, completes a pullback, and shows an increase in buying volume with momentum entering the market, we can open a long position. This setup looks somewhat risky, so it’s better to enter with a smaller position size. The best trigger for a long entry is located around $111,180.
🔴 Short Scenario: If Bitcoin breaks below the key support level at $105,732, it could offer a short position setup — provided that selling pressure and bearish momentum continue. After the breakdown, we’ll need to wait for a pullback before entering the trade.
❤️ Disclaimer : This analysis is purely based on my personal opinion and I only trade if the stated triggers are activated .

TradeCityPro | Bitcoin Daily Analysis #209👋 Welcome to TradeCity Pro!
Let's dive into the Bitcoin analysis. The market momentum is bearish, so it's better we make a proper price analysis together.
⏳ 1-Hour Timeframe
Yesterday, Bitcoin made a downward move and was rejected from the peak it created at the 111,365 zone.
📈 The long trigger we had at 111,365 didn’t get activated, and now the price has started its downward movement after breaking the 108,844 level.
🔔 The support level that the price has reacted to is 105,780. The price has hit this level with a very large volume and is reacting to it.
💥 If this level breaks, a huge sell volume will enter the market, and a new downward wave could start.
✨ We will confirm the start of this new wave with a break below the 104,488 level. We can also use the 105,780 and 104,488 triggers as entry points for positions.
✔️ As for a long position, I am currently waiting for this bearish momentum to dissipate before looking for a long trigger.
❌ Disclaimer ❌
Trading futures is highly risky and dangerous. If you're not an expert, these triggers may not be suitable for you. You should first learn risk and capital management. You can also use the educational content from this channel.
Finally, these triggers reflect my personal opinions on price action, and the market may move completely against this analysis. So, do your own research before opening any position.

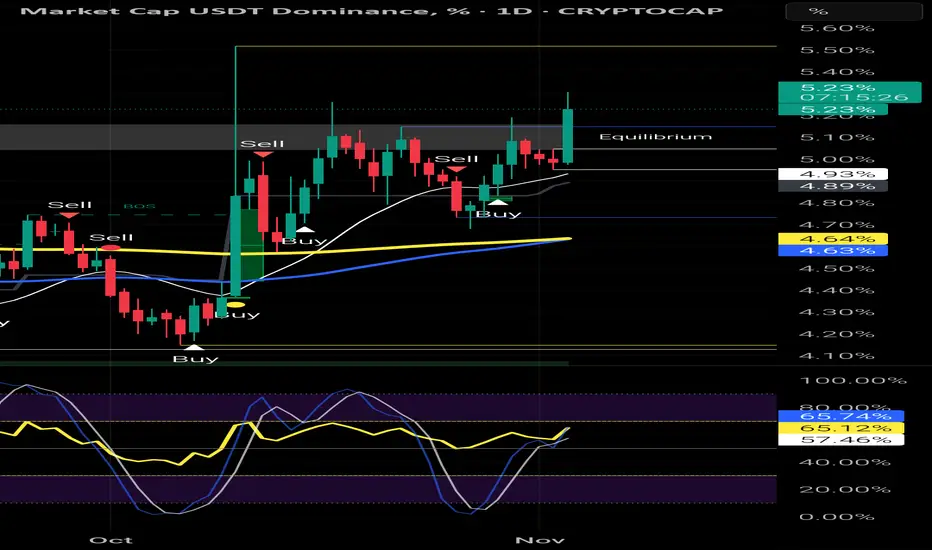
USDT Dominance (USDT.D) – Daily Timeframe AnalysisUSDT Dominance (USDT.D) – Daily Timeframe Analysis
Current Value: 5.23%
Trend: Bullish breakout – Risk-off sentiment increasing
Technical Overview
USDT dominance has broken above the equilibrium zone (~5.00%), signaling capital flow into stablecoins — typically a bearish signal for BTC and the broader crypto market.
The strong bullish candle closing above both the 50 EMA (white) and 200 EMA (yellow) confirms the risk aversion among traders.
This aligns with the recent BTC/USDT drop toward the 106,500 USDT area, showing that money is rotating out of volatile assets (like BTC) into USDT.
Key Levels
Resistance Zone: 5.30% – 5.40% (recent highs / potential supply area)
Support Zone: 4.90% – 5.00% (former resistance turned support)
Major Support: 4.60% (EMA confluence + structure base)
Indicators
The Stochastic RSI is rising but not yet overbought (≈65%), suggesting there’s room for further upside in dominance.
Momentum favors USDT, meaning cryptocurrency prices may continue facing pressure until dominance peaks.
Market Implications
Rising USDT dominance → Bearish for BTC, ETH, and alts.
If USDT.D reaches 5.40% or higher, expect BTC to test the 104,000 – 102,000 USDT zone.
A rejection near 5.40% with a return below 5.00% could signal a relief rally for BTC.
Summary
USDT dominance is showing strong bullish momentum, reinforcing the current risk-off sentiment in the crypto market.
As long as dominance holds above 5.00%, expect continued downward pressure on BTC and altcoins.
Watch closely for exhaustion signals around 5.35% – 5.40% — that could be the first clue of a potential BTC rebound
BTC/USDT Analysis – Daily TimeframeBTC/USDT Analysis – Daily Timeframe (Updated)
Current Price: 106,500 USDT
Trend: Bearish continuation
Technical Overview
BTC has continued to decline after rejecting from the supply zone (125,000 – 127,000 USDT) marked as PMH / Weak High.
The structure shows a clear Break of Structure (BOS) and Change of Character (CHoCH) to the downside — confirming sellers remain in control.
Price is trading below both the 89 EMA (blue) and 200 EMA (yellow), which reinforces the bearish bias.
Momentum indicators (Stochastic RSI) are hovering near the oversold zone, suggesting that while a short-term rebound is possible, the overall trend remains weak.
Key Levels
Resistance: 110,900 → 112,600 USDT (PDH / PWH zone)
Immediate Support: 106,200 USDT (PWL)
Major Support: 102,500 – 100,000 USDT (Equilibrium / PML zone)
Trade Setup
Bias: Sell on retracement
Entry Zone: 109,500 – 111,000 USDT (near previous CHoCH / EMA confluence)
Stop Loss: Above 112,800 USDT
Take Profit Targets:
TP1 → 106,200 USDT
TP2 → 103,000 USDT
TP3 → 100,000 USDT
Summary
BTC/USDT remains bearish with momentum favoring sellers. The current price near 106,500 USDT is close to short-term support, so minor bounces may occur — but unless the market reclaims 112,600 USDT, the next leg down toward 100,000 USDT remains likely

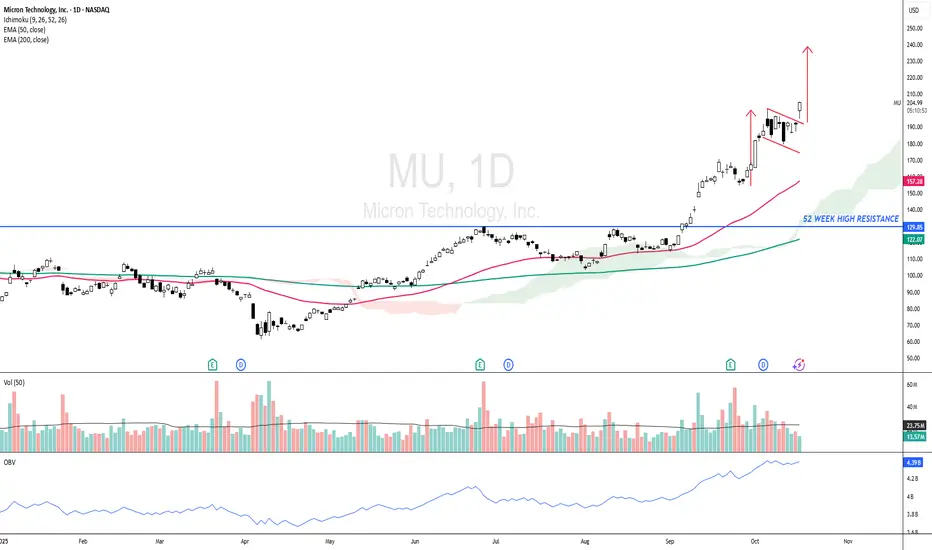
MU - Bullish Continuation Pattern ?MU - CURRENT PRICE : 204.00 - 205.00
The stock has surged nearly 70% since my previous buy call, demonstrating strong bullish momentum. I shared the link of my previous trading idea for reading purpose.
Currently, the price has broken out of a bullish flag pattern, indicating the potential for another leg higher. Estimate target of this bullish flag pattern is around 237.00. Support level is 179.00 (the low of 10 October 2025 candle).
Take note also this ascending in prices is also supported by rising in On Balance Volume (OBV) readings. (Look at the blue line at bottom of chart)
ENTRY PRICE : 203.00 - 205.00
TARGET : 237.00
SUPPORT : 179.00