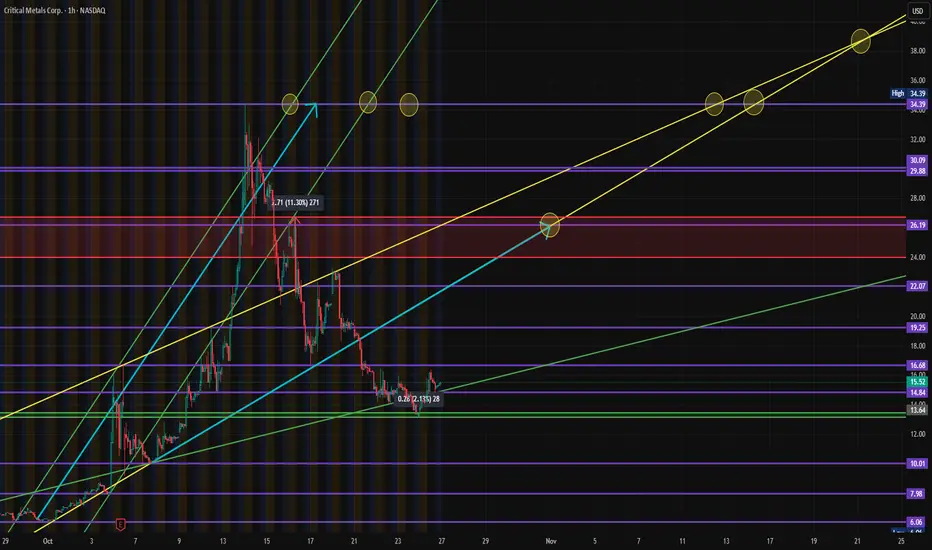
$CRML - Critical Metals - $16.08 Breakout | $26.19 RetestNASDAQ:CRML has been one of the most explosive rare-earth plays of 2025 — rallying from the single digits to a 52-week high of $34.39 before pulling back sharply to consolidate around the $13.64 support zone.
After cooling off from that massive run, price action has now begun compressing between $13.64 and $16.08, with early signs of base-building before another potential leg up.
🧩 Technical Outlook
Strong rally → deep correction → accumulation structure forming.
Support Levels: $13.64 (core zone), $10.01 (strong confluence), and $7.98 (long-term floor).
Resistance Zones: $19.25 → $22.07 → $26.19.
Channel projection shows potential for re-test of $26.19 by November if current momentum continues.
Higher timeframe targets extend to $30.09 and $34.39 in Q1 2026 if the bullish structure holds.
The setup favors accumulation entries below $16.08, with a short-term target to retest $22.07 and potentially $26.19 once momentum returns.
📰 Recent News & Fundamentals
Critical Metals shares have been volatile following major financing announcements:
📉 Announced offering of 18.03 million shares triggered a short-term selloff.
💰 Confirmed $50 million PIPE financing, strengthening capital for expansion.
🌍 Broader rare-earth momentum continues as China tightens export restrictions and JPMorgan initiates new investments into critical mineral supply chains.
Despite the correction, the sector tailwinds remain strong — and NASDAQ:CRML ’s European lithium and rare-earth projects (Tanbreez and Wolfsberg) position it strategically for the energy transition theme dominating the next decade.
📊 Sentiment Snapshot (from Schwab QORE Analytics)
Rating: F (Strongly Underperform) – percentile rank 100
26-week price change: +834%
Beta: 1.14
Sector: Materials / Diversified Metals & Mining
High volatility + weak sentiment ratings often precede large technical reversals — a setup that speculative traders should be watching closely.
💡 My Plan
I’m watching for clean accumulation below $16.08 for a potential re-entry swing trade.
Stop: under $13.50
Targets: $22.07 → $26.19 (swing)
Longer-term projections: $30 → $34 if the bullish trend resumes into 2026.
Tradingview
Understanding Margin & Mechanics in Futures MarketsBefore you trade Futures, it’s essential to understand how these markets operate, especially how margin, leverage, and settlement work. This insight helps you manage risk, stay capital-efficient, and avoid unnecessary surprises.
Margin Basics
Every future position requires margin. It’s important to note margin is not an added cost per contract, margin is a good-faith deposit or can be thought of as a “performance bond” to ensure you can meet your obligations. There are three main types:
Initial Margin: The exchange sets this as a percentage of the contract’s notional value based on a wide variety of factors including volatility, size of the contract, and average market movement.
Maintenance Margin: The minimum balance required to keep your position open. If your balance drops below this, you’ll get a margin call.
Day Trading Margin: Set by your broker, often a fraction of the exchanges Initial Margin. Day Trading margins can provide more leverage, but in turn this comes with more risk.
Leverage in Action
Futures are leveraged products. With just a small amount of capital, you can control a much larger position. For example, with the E-mini S&P 500 trading at 6800, one contract has a notional value of $50 x 6800 = $340,000. We illustrate this below using initial margin and day margins examples.
Leverage using Initial Margin:
Leverage = Notional Value / Initial margin required
Example:
For 1 Long ES contract, with initial margin $23429.
Leverage = 340,000 /23429
Leverage = 14.5x
Leverage using Day Trading Margin:
Leverage = Notional Value / Day margin required
For 1 Long ES contract, with day margin at $1000.
Leverage = 340,000/1000
Leverage = 340x
**As the notional value rises or falls, so does leverage. Leverage is a double-edged sword it can work for you and against you. Higher leverage increases the risk of gains as well as losses.
Depending on your margin, you might only need a few thousand dollars to take that trade. While this enhances your buying power, it also increases risk, as losses could exceed your initial deposit.
Mark-to-Market & Daily Settlements
Futures are marked to market daily. This means your P&L is updated at the end of each session based on the day’s closing price. Gains are credited to your account, and losses are debited, helping to ensure real-time risk management and capital adequacy.
Physical vs. Cash Settlement
When a contract expires, there are two possible outcomes:
Physical Delivery: You receive or deliver the actual commodity.
Example: An oil producer secures a price of $62.00 per barrel through a long futures position. At contract expiration, the producer is obligated to take delivery of 1,000 barrels, which represents $62,000 in total value. If market prices rise to $80.00 per barrel, the producer can sell the physical oil at an $18.00 per barrel gain (before accounting for commissions and futures and other related fees).
Cash Settlement: No goods change hands, and your account is adjusted based on the final settlement price set by the exchange. This is common in financial contracts like the E-mini S&P 500 (ES).
Understanding margin and leverage is fundamental to trading futures effectively. These mechanics define how much risk you’re taking, how your capital is allocated, and how your account is managed daily.
At EdgeClear, our mission is to help traders develop a deeper understanding of the markets and the tools that move them. Follow us on TradingView for more Trade Ideas like this one, or connect with our team to learn how you can trade futures with confidence, precision, and the right guidance.

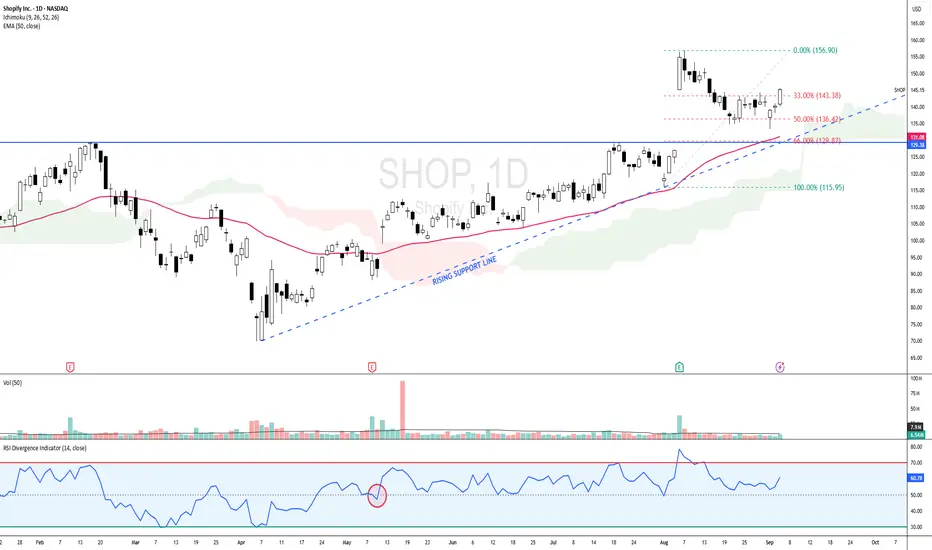
SHOP - BULLISH SCENARIO since 12 MAY 2025 SHOP - CURRENT PRICE : 145.15
SHOP is bullish as the share price is above 50-day EMA. Price action on 12 MAY 2025 is considered starting of bullish scenario because supported by several key indicators :
Share price gap up
Price broke out 50-day EMA
Price moving above ICHIMOKU CLOUD
RSI moving above 50
From 1 August (near 50-day EMA support) to 6 August, the stock recorded a strong upward rally. Following this advance, prices entered a corrective phase and retraced approximately 50% of the prior upswing. According to Dow Theory, such a retracement is considered a normal and healthy correction within an ongoing uptrend. Retracements in the range of one-third to two-thirds of the prior move are typical, with the 50% level often serving as a natural equilibrium point where buyers re-enter the market. Sustaining above the 50% retracement level would reinforce the bullish structure, while a recovery from this zone could pave the way for a retest of the recent highs. However, a decisive break below the 61.8% retracement may imply weakening momentum and a deeper corrective phase.
Take note that until now the share price is still above 50-day EMA and ICHIMOKU CLOUD while RSI also moving steadily above 50 level. There is also rising support line - strengthening bullish outlook.
ENTRY PRICE : 141.00 - 145.50
TARGET : 159.00 and 175.00
SUPPORT : 50-day EMA (CUTLOSS below 50-day EMA on closing basis)
USDT Dominance Breakdown and Market Rally !!!👋🏻 Hey everyone! Hope you’re doing great! Welcome to SatoshiFrame channel.
✨ Today we’re diving into the 4-Hour USDT.D analysis. Stay tuned and follow along.
👀 On the 4-hour timeframe, USDT dominance was rejected downward as it approached its seller-taker zone. With heavy USDT selling, it lost its key support at 4.89%, giving us a confirmation signal for long positions. USDT dominance is now sitting on a key support at 4.74%, with another close support at 4.61%. If these two key levels are broken, the prices of coins can become significantly more expensive.
🔍 Which support zone currently acts as the key one? The 4.74% level can create a short-term pullback in the market, but if you look closely, it has not yet shown any sign of weakening the downtrend or stopping the heavy USDT sell-off. Sellers are not interested in holding USDT in their wallets, and over the past weeks, we have also seen large USDT minting from the issuing company.
Regarding the 4.61% level: breaking this zone will likely require a whale liquidation move, clearing many short positions and large sell orders, which could then trigger a price rally.
🧮 On the 4-hour timeframe, the RSI oscillator is currently in the OverSell zone. Since we cannot rely only on this, we look at the daily timeframe. On the daily chart, USDT dominance is pushing below the 50 level, indicating continued broad selling pressure of USDT — a behavior usually aligned with breakouts in the crypto market.
⁉️ So what information is USDT dominance giving us now? If we observe dominance behavior on the 4-hour chart and compare it with the daily structure, we can identify the beginning of a strong bullish leg in the market, where the prerequisites are the breakdown of the multi-timeframe support zones mentioned in the first paragraph.
❤️ Disclaimer : This analysis is purely based on my personal opinion and I only trade if the stated triggers are activated .

Second Leg Incoming? Ethereum Needs Volume.👋🏻 Hey everyone! Hope you’re doing great! Welcome to SatoshiFrame channel.
✨ Today we’re diving into the 4-Hour Ethereum analysis. Stay tuned and follow along.
👀 Looking at Ethereum on the 4-hour timeframe, we can see that just like Bitcoin, Ethereum began a strong bullish leg yesterday, breaking several of its multi-timeframe resistances. With this price jump, it has now reached its resistance area at $4,252. Keep in mind that the market may take a short rest at this level, and price may experience a brief pullback to the downside.
🧮 The RSI oscillator is currently exiting the OverBuy zone, which is a sign that a multi-timeframe correction may begin for Ethereum.
🕯 During this bullish leg, Ethereum’s volume has increased slightly. However, since sell orders have been lower than before, this volume increase does not appear very strong on the 4-hour chart. Therefore, if Ethereum intends to form its second bullish leg upward, we will likely need to see a more noticeable increase in buying volume.
✍️ The scenario ahead for Ethereum, like Bitcoin, is independent of any trade or position, and it simply helps us better understand Ethereum’s corrective price behavior.
🛡 Ethereum, similar to Bitcoin, is entering a price resting phase. This rest can extend down toward support levels, and if a stronger bullish continuation wants to form, we may see a reversal reaction near these zones. If such a move occurs, the analysis and scenarios will be updated for you.
❤️ Disclaimer : This analysis is purely based on my personal opinion and I only trade if the stated triggers are activated .

Will Bitcoin on 4H Push Higher or Take a Breath? | BTC 11👋🏻 Hey everyone! Hope you’re doing great! Welcome to SatoshiFrame channel.
✨ Today we’re diving into the 4-Hour Bitcoin analysis. Stay tuned and follow along!
👀 Looking at Bitcoin on the 4-hour timeframe, we can see that after breaking its multi-timeframe resistances, it is currently located near the price resistance of $115,793. If Bitcoin breaks this area, it can move toward its next resistance at $121,000.
🧮 Observing the RSI oscillator, we can see that it is currently in its OverBuy zone, and the important point here is to wait for it to exit the overbought area and form a new oscillation structure.
🎇 Pay attention to Bitcoin’s volume, which has been increasing up to this point. Even as it reaches the current resistance, buying volume is still rising and buyers are trying to push prices higher. But since there’s potential for selling pressure, we wait for volume to decrease a bit and allow the market to rest.
✍️ The scenario ahead for Bitcoin is independent of any trade or position, but we can use it to better understand Bitcoin’s corrective or resting behavior.
🛡 Bitcoin has just experienced a beautiful bullish leg across multi-timeframes, and the effects of this upward wave have also extended into higher timeframes such as the 4-hour and daily charts. Price, in a multi-timeframe structure, now requires a short-term correction and a pullback to fill lower buy orders. Keep in mind that traders typically take profit in such zones.
❤️ Disclaimer : This analysis is purely based on my personal opinion and I only trade if the stated triggers are activated .

GOLD at Cut n reverse region? What's next??#GOLD... market perfectly place a low in region.
That is our most important region and our key region for next move.
Keep close and if market holds then buying expected otherwise not at all.
I repeat it again that is full n final region..
NOTE: we will go for cut n reverse below region on confirmation.
Good luck
Trade wisley

Bitcoin Rises After the Trade Storm?Bitcoin/USDT has surged strongly after confirmation of a high-level meeting between the U.S. and Chinese leaders, easing concerns over tariffs and trade tensions. At the same time, U.S. CPI data for September came in below expectations, reinforcing the possibility that the Federal Reserve may soon cut interest rates — creating a favorable environment for risk assets like Bitcoin.
On the chart, the price has rebounded from the 107,000 USD support zone and is now testing the 111,000 USD level — a clear sign that the bullish structure remains intact. If the support holds and the price breaks above nearby resistance, the next target could lie around 120,000 USD or higher.
Current strategy: prioritize buying on minor pullbacks around 108,000–110,000 USD while aiming for higher targets. However, if the 107,000 USD support breaks, it would signal the need for a more cautious approach.

PEGA - New 52-Week High, Next Stop All-Time High?PEGA - CURRENT PRICE : 66.27
PEGA has shown strong bullish momentum after breaking above its 52-week high resistance at USD 61.00. The breakout was followed by a successful retest, confirming strong buying interest and trend continuation.
RSI (45) remains steady above the 50 level, indicating a healthy and sustained uptrend with no signs of overbought pressure yet. Take note also that there is a rising support line - indicating demand is getting higher. If momentum continues, the stock has potential to retest its all-time high at around USD 74.40, representing strong upside potential. The stock’s immediate support lies at USD 57.66, aligning with the gap zone (rising window) formed earlier, which is expected to serve as a strong support area.
ENTRY PRICE : 64.00 - 67.00
FIRST TARGET : 74.30 (slightly below actual all time high resistance)
SECOND TARGET : 80.00
SUPPORT : 57.66

Weekly Market Outlook | Nifty, BankNifty & S&P 500 AnalysisNifty closed the week at 25,795, up 86 points from last week’s close — marking another week of resilience within my projected range of 26,200–25,250.
This week’s candle looks weak and indecisive, forming near the all-time high zone — a potential signal of short-term fatigue. A break below 25,718 could trigger selling pressure toward support zones at 25,450 / 25,350 / 25,300.
However, as long as 25,300 holds, the broader structure remains healthy.
On the flip side, if Nifty sustains above 25,900, bulls may once again attempt to test the all-time high resistance at 26,277.
👉 Expected range for next week: 26,250 – 25,350.
BankNifty Update:
BankNifty delivered a record-breaking all-time high close at 57,699!
If it slips below 57,482, it could correct toward 57,000 / 56,750, which may also drag Nifty slightly lower.
But a sustained move above 57,900 could fuel another rally toward 58,577 (ATH), providing crucial support for Nifty’s next breakout attempt.
S&P 500 (US Markets):
The S&P 500 once again posted a new all-time high weekly close at 6,791, perfectly following last week’s outlook where it cleared 6,715 and achieved both upside targets 6,760 / 6,780.
Next key levels to watch:
Above 6,780 → potential move to 6,930 / 6,959 (important Fibonacci zone)
Below 6,750 → watch for pullback toward 6,689 / 6,666 / 6,650
Investors in US equities can now trail their stop-loss near 6,580 and keep adjusting to protect profits as the trend extends.
🎯 Summary:
Nifty range: 26,250–25,350
BankNifty: All-time high close, watch 57,900 breakout
S&P 500: Bullish momentum intact, eyes on 6,930–6,959
Markets are at crucial inflection levels — next week could decide whether we see fresh breakouts or short-term consolidation.

TradeCityPro | Bitcoin Daily Analysis #206👋 Welcome to TradeCity Pro!
Let’s move on to Bitcoin’s analysis, the market is still moving upward, so let’s review it together.
⏳ 1-Hour Timeframe
Yesterday, Bitcoin formed a resistance zone around 111463, which it touched once, and on the next attempt, it managed to break through this level.
⭐ In this bullish leg that started after the fake-out of 107486, the RSI is strongly supporting the trend and is now close to the Overbought area.
✔️ However, volume is still very low and doesn’t confirm the trend, which isn’t ideal. Since today is Saturday, overall market volume is weak, and there’s a high chance that with the start of the new weekly candle, this entire upward move could turn out to be a fake-out in the next couple of days.
✨ Still, I believe it’s worth the risk to keep the positions open that were entered at 108943 and 111463, because if the 113429 level breaks, price could start a very strong bullish move.
💥 If this upward move turns out to be fake and price stabilizes below 111463, we can consider that as a temporary bearish confirmation — in that case, price could again drop back down toward the 107486 level
📝 Final Thoughts
Stay calm, trade wisely, and let's capture the market's best opportunities!
This analysis reflects our opinions and is not financial advice.
Share your thoughts in the comments, and don’t forget to share this analysis with your friends! ❤️

Ethereum weakened or holding structure? | ETH 1H Analysis👋🏻 Hey everyone! Hope you’re doing great! Welcome to SatoshiFrame channel.
✨ Today we’re diving into the 1-Hour Ethereum analysis. Stay tuned and follow along.
👀 We observe Ethereum on the 1-hour timeframe. After breaking and stabilizing at the $3,889 zone, Ethereum formed a higher low on this area and is now moving along a trendline (dynamic support), with an important static resistance at $3,982.50. Price has reacted to this level once but has not succeeded in breaking it!!!
🧮 Using the RSI oscillator is a reasonable approach in this situation. Since Ethereum is currently in a box/trading range, a breakout requires entering overbuy territory and surpassing the 70 level. Note that there is a significant oscillation support below the average, at the 44.5 zone, which holds strong validity and represents our swing low.
🐷 Pay attention to Ethereum’s volume. To break the specified zone, Ethereum needs to show a strong reaction, fill sell orders, and liquidate futures contracts. Therefore, we need buyer market makers to support the breakout, causing volume to increase through a price jump.
✍️ The scenario forming for Ethereum may require some patience and could play out differently, because we are now facing the second touch of this level, so the win rate of this scenario may be slightly lower.
🟢 Long Position Scenario
Breaking Ethereum’s resistance at $3,982.50 along with surpassing the 70 RSI level and seeing a significant increase in buying volume and price squeeze can form a good long position scenario on Ethereum.
❤️ Disclaimer : This analysis is purely based on my personal opinion and I only trade if the stated triggers are activated .

Bitcoin is now positioned below its main resistance! | Day 10👋🏻 Hey everyone! Hope you’re doing great! Welcome to SatoshiFrame channel.
✨ Today we’re diving into the 1-Hour Bitcoin analysis. Stay tuned and follow along!
👀 Bitcoin has still not succeeded in breaking the resistance zone at $111,458. However, Bitcoin formed a higher low compared to its previous low, which increases the probability of breaking this resistance and gives it a higher win rate for a breakout.
🧮 Pay attention to the RSI oscillator. The 70 zone has maintained its overlap with Bitcoin just like yesterday, with the difference that the RSI support zone is now in the 45 range, which also overlaps with the newly formed higher low.
💰 Bitcoin’s volume in the 1-hour time frame has increased after forming a higher low, meaning this low is being respected by buyers, and the desire to break multi-timeframe resistances has increased. Breaking the current resistance zone requires strong buying volume so that sell orders are filled and some futures orders get liquidated.
✍️ The expected scenario for Bitcoin does not differ significantly from yesterday’s scenario.
🟢 Long Position Scenario
Break the key resistance at $111,458, surpass the 70 level on RSI and enter overbuy territory, accompanied by increased buying volume and a price squeeze.
❤️ Disclaimer : This analysis is purely based on my personal opinion and I only trade if the stated triggers are activated .

BTCUSD – When the rebound is just a trapAfter a short technical rebound around 111–113k, Bitcoin is now facing a strong resistance zone — where both EMA 34 & EMA 89 converge, along with a key supply area that triggered the mid-October selloff.
Structurally, the chart is forming a series of lower highs , while the recovery momentum remains weak and buying volume keeps fading — clear signs that bulls are losing strength. If BTC fails to break above the 113k–115k zone, the price could turn lower toward 107k support , or even retest the long-term ascending trendline.
Although recent news shows continued ETF inflows, their impact seems to be diminishing. With the USD showing mild strength and market sentiment still cautious after the earlier crash, bears are gradually taking control in the short term.
Scenario to watch
Resistance zone: 113k – 115k
Target zone: 107k – 105k
Upcoming trend: mild downside or support retest

US30: Price fails to break high, sellers step inSPREADEX:DJI – Price Rejects Previous High, Possible Pullback Ahead
🕒 Timeframe: 30-Minute Chart
📊 Data Source: Spreadex
💵 Currency: USD
________________________________________
🧠 Short Summary (SEO Preview)
US30 (Dow Jones) has rejected its previous swing high near 47,100 after a strong bullish recovery. Price action now shows early signs of weakness from the supply zone, suggesting a potential short-term correction before the next directional move.
#US30 #DowJones #WallStreet #PriceAction #SupplyAndDemand #TechnicalAnalysis #TradingViewIdeas
________________________________________
📈 Market Overview
After forming a solid base around 46,250 – 46,300, the Wall Street Index (US30) has staged a strong V-shaped recovery.
However, recent candles show that price was rejected at the previous high around 47,100, indicating that buying momentum may be fading as the market hits a strong supply zone.
________________________________________
🔍 Key Technical Zones
Supply Zone (Resistance):
47,000 – 47,150
This zone aligns with the previous swing high where strong selling pressure emerged.
The rejection from this level signals potential exhaustion of buyers in the short term.
Demand Zone (Support):
46,750 – 46,850
This is a former resistance area turned support. A retest here could trigger a short-term bullish reaction before the market decides its next move.
________________________________________
🎯 Trading Scenarios
Scenario 1 – Rejection from Supply Zone (Main Bias)
1. Price has tested the 47,000 – 47,150 zone and rejected the previous high.
2. If sellers remain in control, a pullback toward 46,750 – 46,850 is likely.
3. A deeper correction could extend toward 46,600 – 46,650 if momentum builds.
Scenario 2 – Breakout Above Supply Zone
1. A confirmed candle close above 47,150 would invalidate the short-term bearish bias.
2. In that case, 47,150 may flip into support, opening room for 47,300 – 47,400 as the next bullish targets.
________________________________________
🧭 Technical Outlook
• The rejection of the previous high at 47,100 confirms a key resistance zone.
• Momentum is slowing, suggesting a likely short-term pullback before any new highs.
• Potential strategy: Wait for bearish confirmation (e.g., rejection candle, lower-high formation) around 47,000 – 47,150 before making any decision.
________________________________________
Disclaimer
This analysis is for educational and technical purposes only — not financial advice.
Always manage risk and follow your own trading plan before taking any trades.
Please like and comment below to support our traders. Your reactions will motivate us to do more analysis in the future 🙏✨
Harry Andrew @ ZuperView

TradeCityPro | Bitcoin Daily Analysis #205👋 Welcome to TradeCity Pro!
Let’s analyze Bitcoin today, as the market is making an upward move, so it's important to have a solid analysis to stay ahead of future movements.
⏳ 1-Hour Timeframe
Bitcoin's upward movement continues, and after yesterday's correction, the price is now moving upwards again toward the 111645 level.
This movement is accompanied by weak momentum, and the volume is decreasing, so opening a long position right now is a bit risky.
However, if 111645 breaks, we can open a long position with a very low risk. The break of this level will be our next trigger for a long position.
The main long trigger is 113429. Breaking this resistance can initiate the next upward movement for Bitcoin.
But the volume needs to increase. Any movement accompanied by decreasing volume is a strong sign of trend weakness and won’t last long.
If you already have a long position from 108943, you can take profits if the trend confirms and the price gets rejected at 111645.
For short positions, we should wait for the market structure to change and for a short trigger to appear.
❌ Disclaimer ❌
Trading futures is highly risky and dangerous. If you're not an expert, these triggers may not be suitable for you. You should first learn risk and capital management. You can also use the educational content from this channel.
Finally, these triggers reflect my personal opinions on price action, and the market may move completely against this analysis. So, do your own research before opening any position.

TradeCityPro | CAKE: Range Squeeze, Breakout Imminent👋 Welcome to TradeCity Pro!
In this analysis, I want to review the CAKE coin, one of the DeFi projects active on the BNB network with a market cap of 916 million USD, ranked 74th on CoinMarketCap.
⏳ 1-Hour Timeframe
This coin is currently in a small range box on the 1-hour timeframe, and this tight range has reduced its price fluctuation.
✨ This compression indicates that, if the box is broken, price could make a sharp move.
⭐ Currently, price is at the bottom of this compression and has entered a key support zone.
✔️ If the support zone breaks, the downward move for CAKE will resume, so we can open a short position if the level is broken.
📊 However, if price finds support at this level and moves upward, we can open a long position once 2.785 is broken.
💥 Both triggers for long and short are highly risky. For more reliable triggers, for a long position, we should wait for the break of 3.017, and for a short, we would look for a lower high and low below the support zone.
📝 Final Thoughts
Stay calm, trade wisely, and let's capture the market's best opportunities!
This analysis reflects our opinions and is not financial advice.
Share your thoughts in the comments, and don’t forget to share this analysis with your friends! ❤️

Can BTC Break $111,458 resistance ? - BTC 1H Analysis | Day 9👋🏻 Hey everyone! Hope you’re doing great! Welcome to SatoshiFrame channel.
✨ Today we’re diving into the 1-Hour Bitcoin analysis. Stay tuned and follow along!
👀 On the 1-hour timeframe, we see that Bitcoin is currently below its resistance zone at $111,458. If this level is broken, Bitcoin can move upward toward its next resistance levels.
🧮 The RSI oscillator is currently below the static resistance near level 70, which overlaps with the $111,458 resistance. If the RSI breaks above this zone, Bitcoin can enter overbought territory, making it easier to move toward the next resistance.
🕯 Looking at Bitcoin’s volume, we can see that volume has decreased, and this decline is clearly visible. With the first increase in buying or selling volume, Bitcoin can begin its next move with stronger momentum and potentially cause a price spike.
💵 Today we will also take a look at USDT dominance. The 4.91% support level on USDT dominance overlaps with Bitcoin’s current resistance. If this level is broken, Bitcoin can start its move upward with strong confirmation.
✍️ A complete and clear scenario is now formed for a Bitcoin position, which you can use for your trades in the continuation of this analysis.
🟢 Scenario for Bitcoin resistance breakout 👇🏻
If Bitcoin breaks the $111,458 price level along with RSI crossing above 70 and an increase in buying volume, it can move toward higher price levels.
For this scenario, we also need confirmation from USDT dominance, meaning a break below the 4.91% support zone.
❤️ Disclaimer : This analysis is purely based on my personal opinion and I only trade if the stated triggers are activated .

GOLD at Immediate support ? Holds or not??#GOLD... well guys market just make a supporting area that is around 4110-11
Keep close and sustain above means another rise expected.
So stay sharp.
Good luck
Trade wisely

TradeCityPro BNBUSDT Heading Toward a New ATH?👋 Welcome to TradeCityPro Channel!
Let’s dive into the BNB (Binance Coin) analysis — one of the strongest and most bullish charts in the market. Currently, after correcting from its All-Time High (ATH), the price is consolidating within a sideways range, showing that buyers and sellers are in a tug-of-war.
🌐 Overview of Bitcoin
Before we begin, note that we’ve moved the Bitcoin analysis to a dedicated daily report for deeper insights into its market behavior, dominance, and trend structure:
👉 TradeCityPro Bitcoin Daily Analysis
📊 Technical Overview (4H Timeframe)
After facing a heavy rejection from its ATH, BNB once again attempted to retest that level. However, a fake breakout (false move above resistance) led to another sharp correction, pushing the price back down into the range.
Interestingly, this correction bounced exactly from the $1054 support zone, the same level that previously acted as a strong reversal point. This repeated reaction confirms how critical this support is — not only because it aligns with the 50% Fibonacci retracement level, but also due to its importance in the Dow Theory structure as a mid-wave equilibrium.
📈 Long Setup (Bullish Scenario)
If price breaks above $1129, it could trigger an early long position setup — signaling that buyers are regaining control before another major leg up. This move would likely be the early breakout signal ahead of a potential new ATH attempt.
📉 Short Setup (Bearish Scenario)
For short positions, the $1054 level remains the key trigger. A clean breakdown below this zone would indicate the loss of a major support and could open the way for a deeper retracement.
However, keep in mind — this is a high-impact support zone, so avoid placing tight stop-losses or over-leveraged entries. Price volatility is expected to increase around this level.
🎯 Conclusion
BNB remains one of the strongest altcoins structurally, and as long as it holds above the $1050 region, the bullish structure remains valid. The next few sessions will be crucial — watch the $1129 breakout for confirmation of renewed bullish momentum, or the $1054 breakdown for signs of weakness.
📝 Final Thoughts
Stay calm, trade wisely, and let's capture the market's best opportunities!
This analysis reflects our opinions and is not financial advice.

TradeCityPro | Bitcoin Daily Analysis #204👋 Welcome to TradeCity Pro!
Let’s go over today’s Bitcoin analysis, Bitcoin is still ranging, so let’s take a close look at the market together.
⏳ 1-Hour Timeframe
Yesterday, Bitcoin had a short position trigger at the 107,486 zone, which was activated.
🔔 The break of this level created a short-term bearish move, and if you had opened a position on Bitcoin, you probably hit your stop-loss by now.
✨ However, considering the dominance charts, short positions on altcoins made more sense — and if you had opened them, they likely hit their targets.
✔️ Currently, after the fake-out of this zone and the breakout above 108,943, price has made a bullish move up to the next resistance area at 110,213.
💥 Now, price has returned again to the 108,943 level. Volume has decreased along this move, and overall, this drop in volume shows that the market isn’t in a great condition — so the best move for now is to stay without a position.
📊 For short-term trades, if price breaks 110,213, we can open a continuation long position.
💡 For short positions, the current trigger is still 107,486, but since this level has already been faked once, we should wait for another reaction to it — and only open a position if it breaks again on the next attempt.
❌ Disclaimer ❌
Trading futures is highly risky and dangerous. If you're not an expert, these triggers may not be suitable for you. You should first learn risk and capital management. You can also use the educational content from this channel.
Finally, these triggers reflect my personal opinions on price action, and the market may move completely against this analysis. So, do your own research before opening any position.

TradeCityPro | AAVE: Trendline Squeeze, Breakout Loading👋 Welcome to TradeCity Pro!
In this analysis, I want to review the AAVE coin for you—one of the lending projects in the Ethereum ecosystem, currently ranked 32 on CoinMarketCap with a market cap of $3.36 billion.
⏳ 4H Timeframe
On the 4-hour timeframe, this coin started a downtrend after being rejected from the 301.39 zone and, together with a descending trendline, has been moving downward.
✔️ Price has now reached it again, faked it once, and is still ranging around this trendline.
✨ If the trendline is broken and price holds above its trigger, it can begin an upward move.
⚡️ The trigger we have to confirm the start of this move is the 234.24 zone. With the break of this trigger, we can also use it to open a long position.
📊 The next resistance levels this coin has are 261.25 and 302.18, each of which can be used as the next trigger for a long position.
💥 For a short position, the main floor that has formed is 202.86. A break of this level will be a very good trigger for a short position.
📝 Final Thoughts
Stay calm, trade wisely, and let's capture the market's best opportunities!
This analysis reflects our opinions and is not financial advice.
Share your thoughts in the comments, and don’t forget to share this analysis with your friends! ❤️

Bitcoin: Strong Downtrend – Don’t Miss the Sell Chance!Hello traders,
Although Bitcoin showed a slight recovery on Wednesday, the crypto market is still struggling after the sharp decline in early October. Selling pressure remains strong, as the market hovers near recent lows with no clear signs of recovery.
With uncertainty surrounding the U.S. economy and ongoing trade tensions with China, investors are avoiding risk – further weighing on risky assets like Bitcoin. In addition, the drop in gold prices hasn’t provided enough buying momentum for the crypto market to rebound.
The BTC/USDT chart clearly shows a strong downtrend with a steep descending trendline, and resistance around $112,000 has already been pushed back. The price is expected to continue falling, with the next support area around $102,000.
A great opportunity to sell Bitcoin and take advantage of this downtrend!
