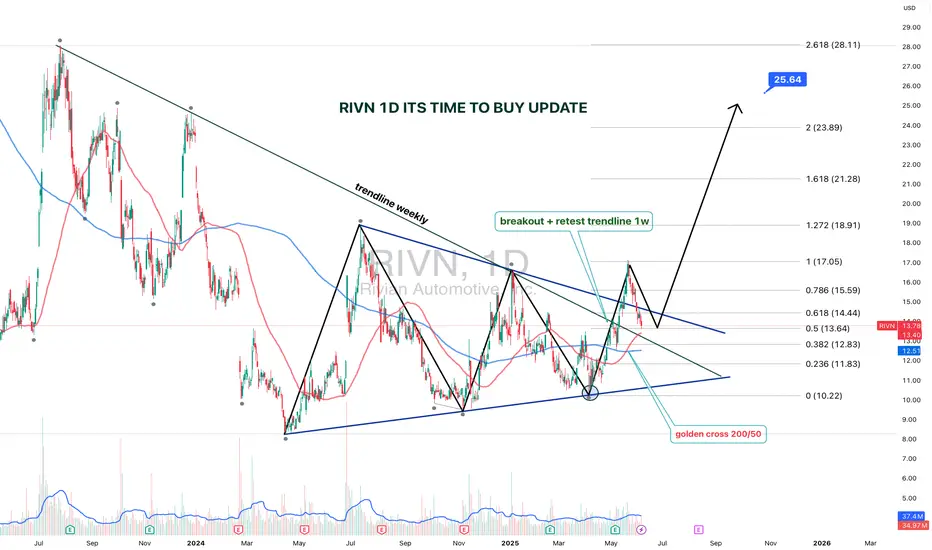
RIVN 1D — It’s Time to Buy: Setup UpdateThe setup on Rivian (RIVN) just got upgraded from “interesting” to “strategically significant.” We’re looking at a textbook symmetrical triangle that’s been developing since July 2023, with a clean breakout and retest on the weekly trendline.
The breakout was followed by a bullish retest, right at the intersection of the triangle base and the key trendline. Volume kicked in, price held — and that’s what smart money calls confirmation.
Now, the Golden Cross is live: the 50-day MA just crossed the 200-day MA from below. Price is confidently holding above both — momentum is shifting hard. Fibs from the bottom (10.22) to the last local top (17.05) project the first target at $17, and the extended Fibonacci confluence gives us $25.64 as a long-range goal (2.618 extension).
The weekly trendline — which acted as resistance for over a year — has flipped to support. Price action respects it, bulls are loading, and structure is clean.
This is not just a bounce. It’s a technical rotation from accumulation to expansion.
The time to talk about potential is over — price action has spoken.
Trainglebreakout
XRP 4H Breakout?XRP has been forming a triangle pattern with a flat low and lower highs compressing into a point.
Generally this suggests that the bulls are willing to buy at a strong level but with declining strength, the bears on the other hand are repeatedly pushing price back down from lower points each time which leaves two possible scenarios that are actionable:
Bullish - A breakout above the downtrend line with significant volume, I think BTC will have a large part to play in this. Following the breakout a flip in structure with new highs and new lows would give the signal XRP is ready to go higher.
Bearish - This chart pattern generally does lead to continuation of selling off, the trigger would be a loss of the green box/equal lows. Should price break below a lot of the previous rally would look to be infilled, target price would be $2.35
Two good triggers and plans for each, anything in between is not actionable to me as I have no strategy that I am confident could produce a profitable outcome in the mean time, I'll be patient instead.

MINDACORPNSE:MINDACORP
Note :
1. One should go long with a Stop Loss, below the Trendline or the Previous Swing Low.
2. Risk :Reward ratio should be minimum 1:2.
3. Plan your trade as per the Money Management and Risk Appetite.
Disclaimer :
>You are responsible for your profits and loss.
>The idea shared here is purely for Educational purpose.
>Follow back, for more ideas and their notifications on your email.
>Support and Like incase the idea works for you.

SOLARINDSNSE:SOLARINDS
Note :
1. One should go long with a Stop Loss, below the Trendline or the Previous Swing Low.
2. Risk :Reward ratio should be minimum 1:2.
3. Plan your trade as per the Money Management and Risk Appetite.
Disclaimer :
>You are responsible for your profits and loss.
>The idea shared here is purely for Educational purpose.
>Follow back, for more ideas and their notifications on your email.
>Support and Like incase the idea works for you.

LTC/USDT Descending Triangle Breakout with Retest OppurtunityKey Observations
1. The chart illustrates a Descending Triangle breakout, where the price has successfully moved above the descending trendline, confirming a bullish continuation.
2. The breakout has brought the price above the horizontal resistance zone at $115, which now acts as support.
3. A retest of the breakout zone ($115–$116) could provide an ideal entry opportunity for buyers.
Strategic Implications
Monitor the price action closely around the $115–$116 level for signs of a successful retest. If the support holds, it may lead to further upside, with the next target zone around $130–$140, aligning with previous highs. Use a stop-loss below $110 to manage risk effectively, as a breakdown below this level would invalidate the bullish setup. Look for volume confirmation during the retest to reinforce the strength of the breakout.

HCL Technologies Ltd Daily Chart Analysis
The daily chart of HCL Technologies Ltd illustrates an upward trend with strong support levels and clear resistance areas, showcasing both bullish momentum and potential pullback scenarios.
Key Observations:
1.Trend Analysis: The stock price is in an overall uptrend, consistently making higher highs and higher lows. It is supported by a well-defined ascending trendline and is trading above the 200 EMA, which is a bullish indicator.
2.EMA Levels: The 13, 48, and 200 EMAs are aligned in a bullish configuration, indicating continued strength. The price’s proximity to the EMAs will be a key indicator of short-term trends.
3.Volume Behavior: There is a healthy volume trend with spikes during up moves, suggesting interest and accumulation during bullish days.
4.Resistance and Support Zones:
• Resistance: The resistance zone around ₹1,888.50 - ₹1,889.30 represents a key hurdle. A sustained move above this level, accompanied by strong volume, could confirm a bullish breakout and indicate further upside potential.
• Support: The primary support level lies around ₹1,719.00. A breakdown below this level could lead to a more significant pullback, possibly retesting previous lows or consolidating around the 200 EMA.
5.RSI Indicator: The RSI is currently around 55.27, indicating mild bullish momentum without being overbought. An upward move in the RSI beyond 60 could further validate any price strength and potential for breakout scenarios.
Potential Scenarios:
• Bullish Scenario: A breakout above the ₹1,889 resistance zone with strong volume could propel the stock higher, targeting further resistance levels around ₹2,000 and beyond.
• Bearish Scenario: If the price is unable to break above resistance and reverses, it may test support around ₹1,719. A breakdown below this level could signal a potential trend reversal or consolidation phase.
Impact of Macro Events (e.g., US Elections):
The outcome of significant macroeconomic events, such as the US elections, could influence IT sector stocks, including HCL Technologies. Favorable policies, market stability, and global business sentiment may drive higher demand for IT services and lead to a bullish impact. Conversely, any policy uncertainty, geopolitical tensions, or economic disruptions could lead to increased volatility, potentially affecting the stock’s upward momentum.
Summary: HCL Technologies is currently at a key resistance level. A breakout above ₹1,889 may signal further bullishness, while a rejection and breakdown below ₹1,719 could prompt caution. Traders should watch volume and price action closely, along with any macroeconomic news that might impact the broader market sentiment.
Disclaimer: This analysis is for educational purposes only and should not be construed as financial advice. Always conduct your own research or consult with a financial advisor before making any trading or investment decisions.

Voltas comes out of the Bullish TriangleVoltas NSE:VOLTAS comes out of the Bullish Triangle. You can buy at the current Price 1621. First Target would be 1740 and 2nd Target would be 1930( which you can achieve using GTT, if you are ready to take Risk)


🚀 *Bitxer Signal Premium ID#284-3 Target Done🚀 *Bitxer Signal Premium ID# 284-3
ZIL/USDT on Binance Futures (10x Cross)*
📈 *Trade Direction:* Long ⬆️
📈 *Entry Point:* 0.01652
🎯 *Targets:*
🎯 Target 1: 0.01720 🚀
🎯 Target 2: 0.01764 🚀
🚀🚀🚀🚀🚀
🛡️ *Stop Loss:* 0.01627
💰 *Risk Management:* Wallet Size - 3-4% (Protect those funds!)
🚀🚀 Ready to blast off with Bitxer signals! We've got our sights on those targets! 🌠🛸

LTTS Triangle pattern and double bottomTriangle pattern and double bottom pattern there .
Double bottom neck line place now market.
We can expect bullish.

{ NELCAST } SWING TRADE take trade when nifty turns bullish swing trade perfect symmetrical triangle short term opportunity for upside take trade after breakout from the trendline according to own risk this is not call just a analysis.

Aarti industries Aarti industries
The share of aarti industries have been falling since long now it's looks good to buy for a trading and investment purposes because of discounted factor on a daily tf it has made a triangle pattern above 556 can show a good upmove
Tgts will be 600 660 710
Ask your financial advisor before buying
Only for educational purposes
Guys do follow me on trading view like post your comment is my motivation

STOCK NAME { GODREJ PROPERTIES } SWING TRADEperfect symmetrical triangle short term opportunity for upside take trade after breakout from the trendline according to own risk this is not call just a analysis..

symmetrical triangle short term opportunity for upside trainglesymmetrical triangle short term opportunity for upside take trade after breakout from the trendline according to own risk this is not call just a analysis..

symmetrical triangle short term opportunity for upside traingle#HINDUJA GLOBAL symmetrical triangle short term opportunity for upside traingle with small SL

symmetrical triangle short term opportunity for upsidesymmetrical triangle short term opportunity for upside

swing trade
Ascending triangle short term opportunity for upside take trade after breakout from the trendline according to own risk this is not call just a analysis..

symmetrical triangle short term opportunity for upsidesymmetrical triangle short term opportunity for upside take trade after breakout from the trendline according to own risk this is not call just a analysis..

symmetrical triangle short term opportunity for upsidesymmetrical triangle short term opportunity for upside take trade according to ur own analysis

XAUUSD TRIANGLE PATTERNHello pepps!
Gold has formed a triangle pattern, since the structure is buliish it could possibly breakout to the upside which aligns with my previous analysis. Commet your idea.
Cheers!

NAS100 bullish scenarioHello pepps! Nas has formed symmetrical triangle there is high probability it will break to the upside which goes in line with yesterday trade idea on the pair. Looking to attack from the bottom as the structure has turned bullish for the moment. You are welcome to discuss this idea in the comment section. Enjoy!🚀

NAS100 bullish setup 🚀Nasdaq has finally broke the h4 triangle on friday, a pullback to around 10908 will be cake setup to ride it all the way to 11260, lets see how it plays.
NLong

NDX has a formed a nice decsending triangleThere is two possiblities in this trade. The first 1 good chance it could break to the upside since it is a descending triangle we expect the price to break to the upside. The 2nd scenario, since there is a big gap or imbalance from 10870. If the triangle breaks to the downside there is a good chance it will fill the gap at least 50 %. Good luck!
U
