A Beautiful Bull TrapPerfect retest of monthly resistance zone midpoint. Targeting minimum $2500 assuming that 2019 supports won't be able to contain the sell off.
Welcome to bear market part 2
TRAP

False breakout ??....False breakout ??....
I will short the structure until there is a real break out....

Everything under control. Was it trap? I warned!Come on.
Everything under control.
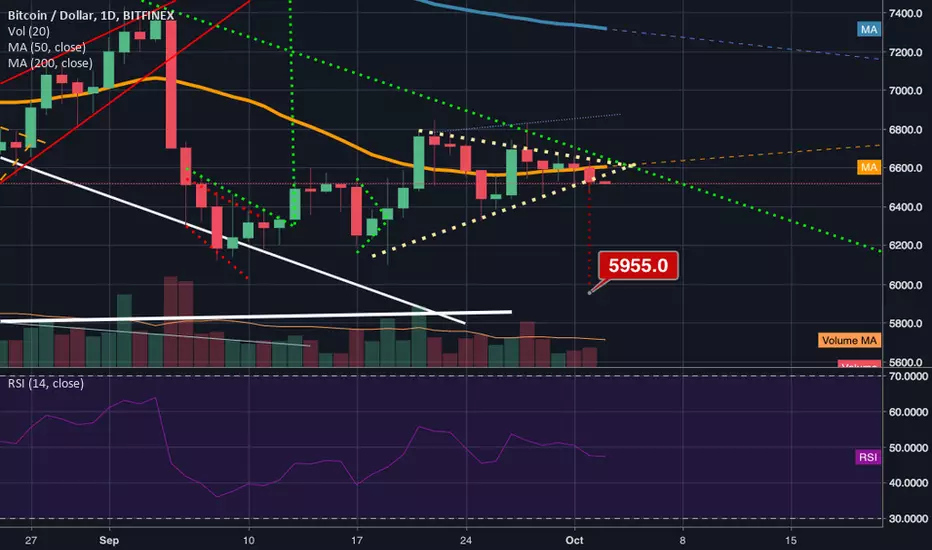
Broadening WEDGE enabled.
It was a beautiful BULL TRAP coming out of a large Falling Wedge followed by a False BULL FLAG. Great move. Great trap. Bears are still in control, are not they?
Take a look at my previous STUDIES and they will prove the armed farce. You were warned.
I'M NOT TOP TRADINGVIEW
I'm not a FAMOUS
I do not want your MONEY
I'm here to help you
And in the end I'm the CRAZY!
It was a BEAUTIFUL SHORT SQUEEZE

Short squeeze! Thank youWhat is a Short Squeeze
A short squeeze is a situation in which a heavily shorted stock or commodity moves sharply higher, forcing more short sellers to close out their short positions and adding to the upward pressure on the stock. It implies that short sellers are being squeezed out of their short positions, usually at a loss, and is generally triggered by a positive development that suggests the stock may be embarking on a turnaround. Although the turnaround in the stock’s fortunes may only prove to be temporary, few short sellers can afford to risk runaway losses on their short positions and may prefer to close them out even if it means taking a substantial loss.
I WARNED! SARDINES BOUGHT

Bull Trap is comingCome on TOP TRADINGVIEW!
I will help you. No, wait. Know how to read candles? Or do you copy ideas to sell your signals?
Better start finding another service. This market is dead! Did you understand Without regulation no money will enter here! What is the 700 billionth of the marketcap? Where are they? Why did they run away?
The bottom is farther than you can imagine.
Better not post ideas like ZERO.
Bitcoin goes from 0 USD and goes to 20k is this normal! Blockchain is revolutionary !!!!! LMAO! Now get out of 20 and go to 0 is crazy? OK!

#BTC compare of the fall and its correctionSo, we see a drop to Fib 0.786, but if you look at the entire history of the Bitcoin price movement, you can see larger plums:
in 2011, the price rolled back to -94% (from $ 35 to $ 2),
also this year there is a drain to -83% (from $ 12 to $ 2),
then draining in 2013 to -82% (from $ 259 to $ 45),
then there was a drop in 2015 to -86% (from $ 1140 to $ 150),
and now they have fallen just to -78% (from 19,900 to 4,300), corresponding to the Fibonacci resistance level.
Therefore, to go below the chances are quite real. Level 3000, for example, corresponds to a decrease of -84.9%, and 2000 is equal to -89.9%. Thus, the downtrend may continue, but not without corrections of such drops! The now formed symmetrical triangle from the past post is a warning rather than a further expected forecast. In general, now the picture is bullish, we need a rebound, we need a correction of the fall. Most indicators look positive, we can get an increase to the levels from which we began to fall, but a break above may be a bull trap, after which the price will continue to follow the downward trend.


Careful with this fakeout on the 1hCould be forming the longarmed wojack fomo fakeout, careful when buyin g :III

Ripple, failed breakoutXRP with a nice trap set, will short 9485 sats if we see a return: order block, HVN & breakout failure confluence
XShort

Where is Bitcoin Headed and is this the Ultimate Bear Trap?It is not for certain where the Bitcoin 0.12% market is headed in the long-term, but it is scary to think that we could go as low as 1300. If this recent drop causes enough panic among HODLers and early investors of Bitcoin 0.12% , this possibility would not bewilder me. Some may see this as a terrible thing, but I see this as a very fortunate thing for the future adoption of Cryptocurrency. Without the dilution of Bitcoin 0.12% , it would be almost impossible for adoption to take place as the centralization of large wallets would easily disrupt the stability of Bitcoin 0.12% as a currency itself. Sir Warren Buffet once said, buy when there is blood on the streets and as traders or investors, we must look at all possibility side of the different scenarios. I see this massive drop as certainly possible, however it would be ignorant to assume outright that this is where we're headed. I wanted to follow up on my update from my previous idea about this dump being the ultimate bear trap because I certainly do believe this dump is a shakeout in order to fuel the start of a massive Bull rally. The only question is, how low will market makers be able to drive this down to and when they will decide that they've done enough shaking?
Looking at the possibilities here and low liquidity, I see this as a possibility of a liquidity run below the yearly lows to cause panic because "support has been broken! OH NO!!" If we look at past history of every major bull run which I've circled on the chart published, we get a massive drop (liquidity run) before ever pumping into new all time highs. The reason for this is that large players want to buy in cheap so they deflate the price of the markets in order to make a greater profit when they decide to inflate the price in the future by sparking FOMO. In the past, we had a deviation of breaking above the 7800 level in our trading range (which trapped a lot of bulls), I would not be surprised if this dump here is a deviation as well to liquidate longs, trap bears, and get long-term bag holders to sell. Given that we have a lot of bullish events in the upcoming future (BAKKT and ETF ), it only makes sense for market makers to want their low fills.
In my chart above I've circled the points of where bull runs began. As you can see, we get a major drop in price right before the rally. I've also made note of deviations of the trading range. I believe this current drop is a deviation as well, and that we will correct back up to 6.2 like this drop had never happened. So is this a shakeout before the breakout? I believe so, however it would be ignorant to ignore the possible downside if my theory happens to be incorrect. Being a trader is not about being right or wrong, but about the probabilities. Today's momentum will not be the same as the momentum tomorrow. We must understand that the market is dynamic and what is forecast on the chart is not absolute, just as weather predictions are not always 100% certain.
I will begin my bear analysis first to examine the worst case scenarios:
Analyzing the weekly chart, we can see that there are huge volume gaps at each support level. This is an extremely dangerous level to be in because if Bitcoin decides to break down further, then expect another 1100 point drop down to the 4400-4600 area as the next layer of support.
Currently Bitcoin is sitting just barely above a gap while holding onto dear life while trading in a 434 dollar range. From what I observe, we are currently holding quite well above the 5416 EQ (equilibrium) of this trading range. In order for the likely probability of seeing a buyback correction up to 5.8 - 6k and possibly even further back up to 6.2, we must hold and continue to close daily above this 5416 EQ level at all costs. If we are to fall below this level, then bears have taken control and we will likely begin to see the drop to my bearish 4400-4600 target.
For the bullish analysis:
If this drop is indeed a deviation from the trading range (shown on the published chart at the very beginning), then we will likely see this correct itself back up above the 6.2 - 6.5 level for an upside breakout further like the drop had never happened. The Dow Theory states that: "The manipulation of the primary trend is not possible. When large amounts of money are at stake, the temptation to manipulate is bound to be present. These short movements, from a few hours to a few weeks, could be subject to manipulation by large institutions, speculators, breaking news or rumors. Manipulation usually end the same way: the security runs down and then falls back up and continues the current trend." If my Ultimate Bear Trap theory is correct, then this manipulation will correct itself and we will see our previous trading levels.
On the daily chart, we closed yesterday with a spinning top candle and the previous day as a TD9 with a qualified previous TD8 candle on the Thomas Demark Sequential indicator. I see this as a very good chance of a reversal incoming or at least a bounce to the upside to test the broken 5.8 - 6k support level. My private indicator, the "Tommy Oscillator" is also beginning to generate rounded buy signals indicating that this is a good time to begin accumulating.
Conclusion: I will remain bullish on the theory that this drop is manipulation until the 4400 support is broken, in which I believe is a level that would be very difficult for institutions to manipulate because of the large demand at that level.
If you enjoyed reading my analysis and found it helpful, remember to click the like button and follow my TradingView for future updates. :)

Bull trap around 11K, then 3K (not without dead cats)Bull trap around 11K, then 3K (not without additional dead cats), 3K in 2019, like in second half of 2019. Then Slowly up. Next ATH in BTC will be like in 2022-2023. and will be around 160K - 250K (not really sure about the ATH high exactly). Cheers.
The Arrows timming is not correct, i think 3K will be achiaved somewhere in second half of 2019.

Do you even...Pinbar?Can you figure out the differences in the three pinbars highlighted...bearing in mind that the shape, length, or colour of the pinbar does not matter in this case.
Pinbars occur in the market as a result of two scenarios:
1) When institutional traders place large positions in order to reverse what we call a "trend"
2) When institutional traders take profit off existing trades, this action reduces the "volume" within a candle...hence the wick.
Comment if you have questions about pin bars.

So far btc has boucned beautifully up from the bottom trendline We can see here on the 1 day chart that BTC has bounced with strong support up from the bottom trendline of the symmetrical triangle. Symmetrical triangles usually are more valid by candle bodies than candle wicks but just in case I have found the wick top and bottom trendlines as well. For now I m still long on this. Of course whatever you choose is your own doing as this is not financial advice and simply my own strategy but I still think a break up from this triangle could take us to 6.8-6.9. Thanks for reading!

If BTC triggers breakdown here we are going back to 5.9kneed to wait on confirmation and bear volume surge to sell/short but very good probability we will see it. Bear trap also still a possibility to consider but lower probability.
More shorts than longs. Reverse market or trap ?My ideal still wake up, but we are getting more longs than shorts, a signal to a reverse market or a trap ?

NQ testing important resistance NQ1!See chart for summary.
I don't think the market has topped here, but I do think there's an opportunity for short term shorts to nail a momentum move down AFTER a fail at the zone. I included the EMA's here because they provide a good visual tool...a pullback to the 25 EMA + zone + price action fail....that's essentially what I'm looking for. Ideally I'd like to see it developing on the H1 and execute on the 5m tomorrow.
That's very specific, and like I said before, I've been burned by the NQ many times on technical setups. This is a algo heavy instrument that's perfected the art of the fakeout + trap.
If I'm completely wrong and price busts up through the level, this is still a chart worth studying.
Why?
Two reasons:
1. Momentum will come into the market here. First step in good trading is to identify when/where opportunities will present themselves.
2. The second step is knowing which direction to pick. I'm a discretionary technical trader...and if I'm clearly trapped, it's a chance to study how the NQ will set up attractively to one side and then slam the other way at the last minute.
Either way, watch for the move that's coming.

NQ major test coming up (NQ1!)The NQ is one of the trappiest contracts out there, so watch what happens at this level. It's worth zooming in to the 15m just to study the aftereffects in a few days.
The longer it builds up near the High WITHOUT breaking it, the more I'll be biased long. If we probe it overnight, I'll be back to cautiously looking.
Ideally I either want a naked attack in the morning WITHOUT a preceding spring --> that's mean a short, expecting a trap and a major drop in the market.
OR I'd like to see price come down a bit at the open, scoop, and re-attack the High --> that's grounds for a breakout trade.
Remember, D1 analysis and shorter time frame execution means different things for different people. Do NOT trade the NQ unless you are experienced...

Do NOT Be Fooled By the H & S Pattern Until the Support Breaks !Sure all of the world is noticing is the H & S pattern forming and today is already seems likely that the neckline has been violated and many traders would enter a SHORT position for this pair. However beware of the crucial support that lies just beneath the neckline of this pattern, the crucial 1.14500 level!. Many traders might just get caught out if the price bounces off this crucial support level and therefore being cautious and patience is the only wise choice for many traders.
So how to be cautious you ask? well first of all this is just my personal analytical opinion and therefore before taking any rough action please make your own analysis based on your strategy.
So the analyzing this pair on the daily chart will provide a lot of noise to make accurate decisions and therefore weekly timeframe suits here as the noise would be greatly minimized. First of all the weekly candles should well close below the 1.14500 crucial support, i doubt it will happen this week and so next week could be vital for this to happen. After the weekly candle has closed well below the 1.14500 level it can be confirmed that the support has been violated and the price is ready to break down further.
To make a timed entry into this pair, a slight retracement needs to take place on the daily timeframe so as we can enter the trade. Our SL will always be above the right shoulder. The TP level on this will most likely be at 1.04 level where the next crucial support lies.
Overall its a great set up but caution is necessary in this case. If you are already LONG on the USD (swing trade) then i suggest you do not double your risk by going short here as well. I am already SHORT on the NZDUSD (swing trade) and i would not be taking this trade as i do not want double my risks. For those of you who are willing to take this trade please be advised to take caution and be patient. DONT GET CAUGHT IN THE HYPE!
Cheers. Follow me if you like the analysis and for FX signals

This is an obvious Bull TrapCome on guys, Isn't this obvious?
All top traders telling you to go long remember do exactly opposite of what they're telling you

ETH: Three reasons why the descending wedge failedGood morning all. Some people may have gotten excited about the large descending wedge on the daily. I personally ran an awesome short and here's why: 1) We formed an ascending wedge with four solid points of contact. 2) Volume continued to decline, even at breakout point. 3) The daily printed a shooting star candle at the point of breakout. This is a clear example of why we must wait for confirmation before entering a trade.

BTC, Is it a Trap!? Calling Admiral Ackbar!Updated chart to remove bearish channel, as we have broken out of that, but drew a new down trend line that we will have to cross out of, in order to start a new bull run. I still like buying in the gold area, if we can get there. As time marches on, we will eventually enter the green long term bullish channel which should eventually force a new rally, but it's almost too perfect, so I continue to watch, wait, and see what happens here.
Something to consider is these upcoming battles are really telegraphed and so lots of people are preparing for some kind of action in the coming months. I don't have a good feeling about this. Why? I have no data to show you, but just experience in life tells me that when everything is lining up perfectly and you think it's a given, usually things don't work that way. That's when you get clubbed. So this is the alarm that is going off while I am watching this.
Part of me does want to try to place some orders at the bottom of the green channel, just in case you can be lucky and catch a surprise drop down around those levels.
still is it a trap?
Where is Admiral Ackbar when you need him.. i.imgur.com

Evening update Bulltrap Bitcoin. H1 H1 Chart got a failure breakthrough bottom which was bought back very quickly. But the flag (bearflag) is still aktiv. So we have to take care with our next turns. Maybe a small position for breakout is possible. If u watch H4 the Bearflag is also forming...
As you can see, we need the double volume for the green flag that for the red flag. thats not really bullish.
