Ethereum Breaks Descending Structure — Is a Fresh Bullish Leg UnEthereum (ETHUSD) on the H1 timeframe is showing a notable shift in short-term structure after breaking cleanly above a well-defined descending trendline. This trendline had capped price throughout the recent corrective phase, so the breakout signals that bearish momentum is fading and buyers are beginning to regain control.
The prior move down now appears corrective within a broader bullish context rather than the start of a trend reversal. Price has formed a higher low after the breakout and is stabilizing above the 3,080–3,100 support zone, confirming this area as a key demand base and structural pivot.
With the trendline broken, the market is transitioning from sell-the-rally behavior into a potential buy-the-dip environment, provided price continues to hold above the breakout area.
Overhead, ETH faces a sequence of clear resistance levels that will define the strength of any continuation:
- 3,180 – first reaction and intraday structure resistance
- 3,260 – prior consolidation high and liquidity magnet
- 3,300–3,320 – major resistance and key upside objective
Bullish: As long as price holds above 3,080–3,100 and respects the broken trendline, continuation toward 3,180, then 3,260, becomes likely. Acceptance above these levels opens the path toward 3,300+.
Bearish: A failure to hold above the breakout zone and a sustained move back below 3,080 would invalidate the bullish shift and suggest a return to range or deeper correction.
At this stage, Ethereum is at a post-breakout validation phase. Patience is key the highest-probability opportunities come from holding above the broken trendline or clean continuation through resistance, not from chasing price mid-structure.
Trend-analysis

EURUSD Breaks Support — Sellers Target Deeper LiquidityPrice has cleanly broken and closed below the 1.1645 support, confirming a continuation of the bearish market structure with lower highs and lower lows firmly in place. Selling pressure remains dominant, and recent pullbacks are being sold aggressively.
As long as price stays below 1.1650, any short-term bounce is likely corrective and vulnerable to renewed downside pressure.
A sustained move lower opens the path toward 1.1620, followed by the major liquidity target near 1.1590. Only a strong reclaim back above 1.1680 would invalidate the bearish continuation scenario and signal a potential shift in short-term momentum.

Are Lower Highs Setting Up a Deeper Sell-Off?Hello traders! Here’s a clear technical breakdown of ETHUSD (1H) based on the current chart structure.
Ethereum has transitioned from a previously bullish environment into a clear bearish market structure, defined by a sequence of lower highs (LH) and lower lows (LL). After failing to sustain price above the recent swing highs, sellers stepped in aggressively, forcing a breakdown through multiple structure levels.
The sharp impulsive move lower confirms bearish momentum, while subsequent pullbacks have remained corrective, consistently forming lower highs beneath prior support now acting as resistance. This price behavior reflects a market that has shifted control decisively to sellers.
Key Supply / Structure Resistance:
The 3,130–3,150 region now acts as a critical supply zone, where previous support was broken and sellers have defended retracement attempts. This area is also aligned with the EMA, reinforcing bearish pressure.
Intermediate Resistance:
The 3,090–3,100 level represents a minor structure cap. Any pullback into this zone that fails would likely form another lower high.
Major Downside Demand / Liquidity Target:
The 3,020 area is the next significant demand zone, aligning with projected structure continuation and liquidity resting below recent lows.
Currently, ETH is trading after printing a fresh lower low, placing the market in continuation mode rather than exhaustion. Price is attempting a minor bounce, but as long as retracements remain capped below supply, this move should be treated as bearish corrective price action.
Momentum remains with sellers unless structure is reclaimed.
As long as Ethereum remains below the 3,130–3,150 supply zone, the bearish structure stays valid. Any pullback that stalls below this area is likely to form a lower high, opening the door for continuation toward the 3,020 demand zone and potentially lower if sell-side momentum accelerates.
A structural invalidation would only occur if price reclaims and holds above the broken resistance with strong bullish acceptance. Until then, rallies should be viewed as sell-side corrective moves, not reversals.
For now, the trend is down and controlled by sellers.

xauusd 2026-2027As of January 2026, the XAU/USD (Gold/USD) pair is coming off an extraordinary performance in 2025, where it saw gains of over 60%, the highest since 1979.The consensus among major financial institutions like J.P. Morgan, UBS, and Goldman Sachs is that the bullish momentum will carry through 2026, though the pace may become more volatile as it reaches new psychological milestones.
📊 Market Price Forecasts
Most analysts have significantly revised their targets upward following the record-breaking surge in late 2025.
Institution2026 Target (Year-End)Primary Outlook
J.P. Morgan $5,055 /ozBullish; driven by investor diversification.
Goldman Sachs $4,900 /ozBullish; structural demand from central banks.
UBS $5,000 /ozBullish; lower real yields and policy uncertainty.
Bank of America $5,000 /ozBullish; safe-haven demand remains high.
🔍 Fundamental Analysis
The 2026 outlook is anchored by several structural shifts in the global economy:1. De-dollarization & Central Bank DemandCentral banks—particularly in Poland, Kazakhstan, Brazil, and China—are no longer just "opportunistic" buyers; they are strategic diversifiers. While 2026 demand might not hit the 1,000-tonne-per-year peak of the previous three years, it is expected to remain high (averaging 750+ tonnes), providing a solid price floor.2. Monetary Policy & Real YieldsAs the Federal Reserve's easing cycle matures in 2026, real yields are expected to drift lower. Historically, gold thrives in the 4–6 months following initial rate cuts. Investors are increasingly viewing gold not just as a hedge against inflation, but as a hedge against rising global debt levels.3. Geopolitical Risk PremiumOngoing tensions in the Middle East and Eastern Europe, combined with new trade uncertainties (tariffs and domestic policy shifts in the U.S.), continue to drive "flight-to-safety" flows into XAU/USD.
📈 Technical Analysis
(XAU/USD)As of early January 2026, gold is trading near $4,400.The Bullish Channel: The weekly chart shows Gold moving within a well-defined ascending channel. A sustained break above $4,655 would confirm a move toward the $5,000 psychological barrier.Key Support Levels: If a correction occurs, the first major support sits near $4,255. A deeper correction could see a test of the $4,150 – $4,175 zone, which represents a strong "buy the dip" area for long-term investors.Momentum Indicators: The RSI is currently in overbought territory on higher timeframes. While this suggests strength, it also signals the potential for a "blow-out" phase or a sharp, healthy distribution (correction) before the next leg up.⚠️ Key Risks to the Bullish CaseWhile the trend is upward, traders should watch for:Strong Economic Rebound: If the U.S. achieves 6–7% growth with low inflation, the need for a safe haven diminishes.Policy Reversal: A "higher for longer" stance on interest rates by major central banks would increase the opportunity cost of holding non-yielding gold.Liquidity Squeeze: Sharp corrections in the equity markets can sometimes lead to temporary gold sell-offs as investors cover margin calls

ETH — [2D] WEEK 49 TREND REPORT | 12/05/2025ETH — WEEK 49 TREND REPORT | 12/05/2025
Ticker: BINANCE:ETHUSDT
Timeframe: 2D
This is a reactive structural classification of ETH based on the weekly chart as of this timestamp. Price conditions are evaluated as they stand — nothing here is predictive or forward-assumptive.
⸻
1) Current Trend Condition [ Numbers to Watch ]
Current Price @ 3,030
• Trend Duration @ +70 Days ( Bearish )
• Trend Reversal Level ( Bullish ) @ 3,689
• Trend Reversal Level ( Bullish Confirmation ) @ 3,534$
• Pullback Resistance @ 3,914
• Correction Support @ 3,096$
• Structural Support @ 1,946$
⸻
2) Structure Health
• Retracement Phase:
Testing Structure (approaching 38.2%)
• Position Status:
Unstable (price below both structural layers)
⸻
3) Temperature :
Cooling Phase
⸻
4) Momentum :
Bearish
⸻
Author’s Note
DOWNWARD STRUCTURAL ALIGNMENT
This mark identifies a moment where the market showed clearer alignment with downside direction. It does not predict future movement, but acknowledges where weakness became more evident within the prevailing structure. Its relevance remains only while price continues to hold beneath key structural boundaries.
⸻
Methodology Overview
This classification framework evaluates directional conditions using internal trend-interpretation logic that references price behavior relative to its structural layers. These relationships are used to identify when price movement aligns with the framework’s criteria for directional phases, transition points, or regime shifts. Visual elements or structural labels reflect these internal interpretations, rather than explicit trading signals or preset indicator crossovers. This framework is observational only and does not imply future outcomes.

Exxon Mobil Exxon Mobil is going up strong to the all time high,
Expecting strong reaction from that area,
Volume is going down in the last 2 3 weeks witch means bulls are getting weaker,
If we look into the valuation ratios , the company is getting overvalued,
If we look at the 10 Ma on weekly we can see that price is getting away from MA fast witch indicates that the company is getting overvalued quickly,
It will be interesting to see how price will react from that area when it goes up, But overall trend is bullish,

XAUUSD: The decline has stopped, continue to buyAs the talks between Trump and Putin achieved results on Saturday, risk aversion decreased, gold fell rapidly at the opening, and after briefly breaking through 3330, it found support again and rebounded strongly, reaching a high of 3358. Subsequently, the price of gold entered a slow decline, mainly because the market was waiting for the results of the talks between Trump, Zelensky and several European leaders, which was the main factor affecting the subsequent rise and fall of gold prices.
Personally, I think it is unlikely that this meeting will completely resolve the situation between Russia and Ukraine. Since it cannot be resolved, the geopolitical risks still exist, and the market's risk aversion is unlikely to decline, so gold will continue to rise.
Today's focus is on 3340. If support is found, consider buying.
🏆Trade setup:
📈Buy at 3340
✅Target 1 - 3355
✅Target 2 - 3370
🛑Stop Loss - 3330
📣If you have different opinions, please leave a message below to discuss

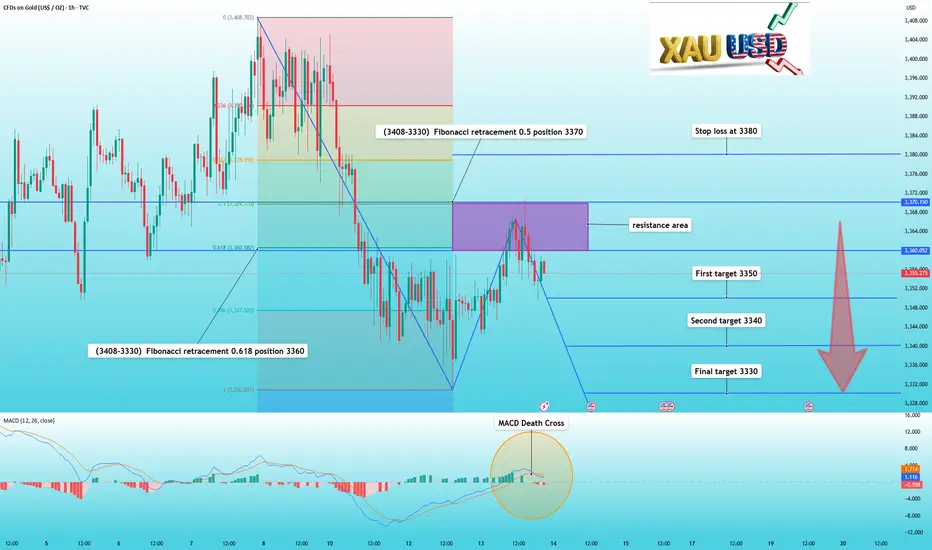
Gold pulls back as expected, you can continue to sellIn my previous trading strategy, I reiterated my view that gold prices would continue to fall if they couldn't break through 3370 in the short term.
And indeed, gold's performance behaved as expected. After hitting 3370, it fell again, reaching a low of 3350.
Technically, the current correction in gold prices hasn't concluded. The Fibonacci retracement indicator for the 3408-3330 trend shows that 3370 is at 0.5, and 3360 is at 0.618, representing resistance. Meanwhile, the MACD indicator has formed a death cross.
Therefore, we do not need to make any changes to our trading strategy. As long as 3370 is not effectively broken, we can continue to short based on the resistance range.
Trade setup is as follows:
Sell near the 3360-3370 area
First target 3350
Second target 3340
Final target 3330
Stop loss at 3380
📣If you have different opinions, please leave a message below to discuss
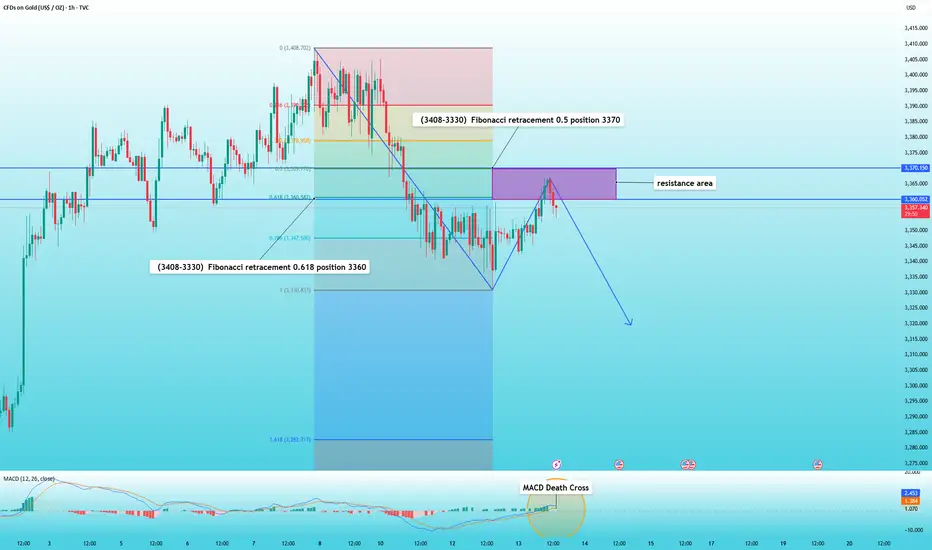
Gold rebounds and is facing resistance, waiting for a declineIn the previous article, I said that if the gold price cannot hold above 3370 in the short term, then the gold price will continue to fall.
Today's rebound in the Asian and European sessions shows mixed gains and losses on the K-line chart, indicating a weak rebound. After rebounding to 3367, gold prices turned downward again.
Meanwhile, the 1-hour MACD indicator also shows signs of forming a death cross. The Fibonacci retracement indicator from 3408 to 3330 indicates that the 0.618 level is at 3360, and the 0.5 level is at 3370. Therefore, the 3360-3370 range is currently a resistance zone.
Therefore, I still maintain my previous view that as long as it cannot hold 3370, you can short in the resistance area.
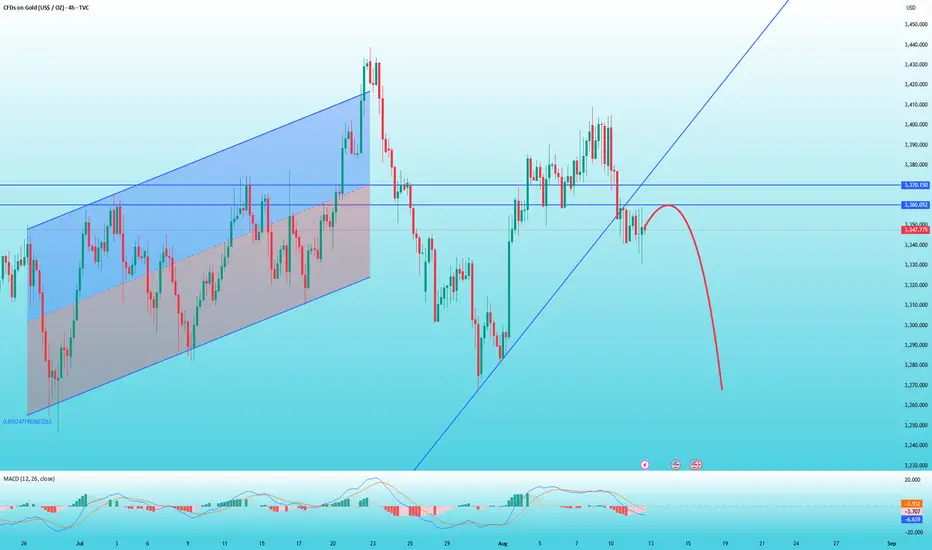
Gold rebound is weak, beware of further declineThe CPI data released this week was lower than market expectations, which is considered positive news. However, since it was the same as the previous reading, gold prices only rebounded briefly before entering another period of volatile consolidation.
From the 4-hour chart, gold prices have already broken through support levels. If they fail to break back above 3370 in the short term, they may continue to test the bottom.
Gold's rebound is weak in the short term, and it's trending downward. The K-line indicator is showing a bearish pattern, and the MACD indicator has formed a death cross.
Therefore, if you want to trade short, wait for a rebound around 3360. Set a stop-loss at 3370, with a target of 3340 and then 3330.
Gold support has been confirmed, buy with confidenceThe most anticipated outcome for the gold market this week is tomorrow's CPI data. After today's pullback during the Asian and European trading sessions, the current price has reached support levels. Before the CPI release, I believe volatility will be minimal, with a high probability of limited fluctuations.
The chart shows that 3350 is a key support level. After several hours of testing, 3350 has stabilized, so we can buy at this level, with the initial target being 3360, followed by 3380.
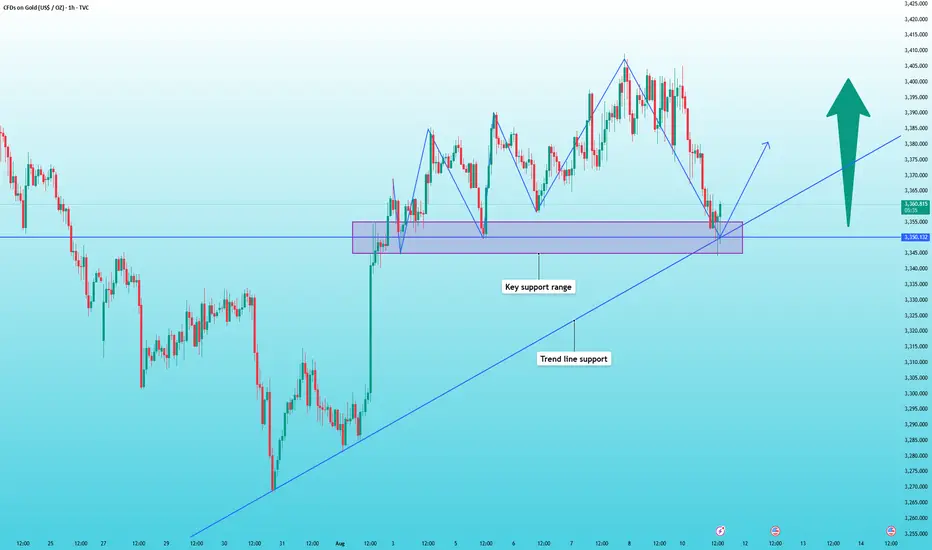
GOLD- XAU-USD Hello Traders! The GOLD MARKET is on fire! 🚨🔥
XAUUSD has officially broken above the key resistance zone — this is not just a move, this could be the start of something BIG! 💥📈
Is this the golden breakout we’ve been waiting for, or just a short-lived spike?
Are we heading toward the next major target, or is a pullback on the horizon? 🎯🔍
Your insights matter — comment below with your analysis and let’s decode this golden move together!
Stay sharp, stay golden! ⚔️💰
#XAUUSD #GoldBreakout #ForexTraders #MarketMomentum #GoldAnalysis #TradeSmart

SWDY Trend AnaylsisSWDY stock is in a downward trend. In case of falling, it's expected to break the first support line at 78.025 points, till it reaches the second support line at 76.249 points. In case of rising, it's expected to reach the first support line 78.687, the second support line 78.928, and the third support line at 79.019, which is highly anticipated due to its latest acquisition.

BTC at a Critical Inflection Point – Bulls vs. BearsBitcoin is currently trading around $77,644, sitting right between two major trendlines:
🟢 Long-Term Bullish Support – This green ascending trendline has held since late 2023, providing key support throughout BTC’s macro uptrend.
🔴 Medium-Term Bearish Resistance – The red descending trendline has capped price since the 2025 highs, forming a clear structure of lower highs.
We're now at a pivotal confluence zone where these two trendlines intersect. Price recently bounced off the green support, but it's struggling to decisively break above the red resistance.
🔍 Key Scenarios:
✅ Bullish Breakout:
A strong daily close above the red trendline could confirm bullish continuation.
Targets: $84K, GETTEX:92K , and potentially ATH breakout above $100K.
❌ Bearish Rejection:
Rejection at resistance may lead to a retest of the green trendline (~$74K).
A breakdown from there opens the door to GETTEX:64K –$60K, or even deeper pullbacks.

Hedge against the Bears by buying Agnic Eagle Mines LimitedWatch the video, I basically used technical analysis of MA, RSI and TTM Squuze to determine that the direction is bullish on the daily, weekly, and monthly charts. Then coupled that with a 1.66 R:R ratio according to Gabriel's Kelly-based Risk to Reward Ratio. You can use levearge here such as option since the Implied Volatility is still around the 30% level, for futures you could use 2x etf if there is one I haven't check. Seasonality supports AEM until May 8 so there is a wind to fall back out if it falls with a bullish engulfing candle this Monday.

ETH - Super bullish inverse H&SCould we be looking at a super bullish scenario of an inverse head and shoulders for ETH? It looks ugly, but could work if the neckline is decisively breached. If it is, we could be looking at some serious gains for ETH. This isn't meant to be fake news or an attempt to gain followers, it's all on the pile of possibles until made improbable. So, we'll keep our fingers crossed and look for higher highs. Until then, follow for more.

SOL/USDT: Are We Gearing Up for a Big Move?Take a step back and look at the big picture for SOL/USDT. There's a long-term head and shoulders pattern forming that could redefine where Solana is headed. Pair that with the Hurst cycles, and we have a cocktail of signals that just… works.
If this plays out, we might see a week-long breach of the upper trend line in the next 18 months—a move that would confirm higher highs are on the horizon.
This is the kind of setup that rewards patience. Do you see it breaking out, or is this just wishful thinking? Follow and share your thoughts below—let’s see how this one plays out. 🚀

BTC is looking like more down, but a great buy opportunity Head and shoulders for BTC was invalidated recently leaving a short term play that looks like some more downside than up, for the very short term in any case. It looks like the green trend line was broken of late. Typically when there's a break, the price action comes back down to buffet on it for a short while before taking off agian. Let's see what happens, it looks like a great buying opportunity though. Cycles in green semi circles also pervail to there being more down than up to go. Follow and share for more.

AIXBT set for one more push before correctingThis new coin looks as though it could be on wave 4 of 5. The volume looks strong inferring that the big green bars of late were in fact wave 3, so starting with there it fits really nicely. I'd put a trade on if the trend line is broken to complete wave 4, which would mean the wave 5 has the room to complete. But, the inevitable ABC is absolutely unmistakable after wave 5 is in so watch out for that. I wont be placing any trades as the liquidity is so low. But, you make your own decision. Follow for more.

XRP, much more to goLooking back at the fractal I created a few months ago, it's playing out really well. Looking at the 5 waves that were put in within the first fractal, there could be an opportunity for the same 5 waves to play out within the second fractal. So, hold firm and keep XRP close and look forward to the eye watering upswide that we'll see within the next 6-7 months. Follow for more.

Bearish Setup on EUR/USD After Rejection at Key ResistanceTrading Idea on 1-Hour Chart (H1):
The EUR/USD pair is showing signs of a potential bearish continuation after testing a key resistance zone around 1.0540 - 1.0544, which aligns with a previously broken downward trendline.
The market structure on the H1 timeframe indicates lower highs, suggesting sellers are regaining control.
Technical Confirmation:
Key Resistance Zone:
The 1.0540 - 1.0544 area acts as a significant rejection point where bullish momentum appears to be weakening.
Break-Retest Pattern:
The price broke below a descending trendline and is now retesting the zone, showing clear signs of rejection.
RSI Indicator:
The RSI is currently near 60, reflecting recent bullish movement but remaining below overbought levels, which signals potential exhaustion in the upward move.
Summary:
This idea is based on a bearish continuation pattern following rejection at a key resistance zone, supported by trendline retest and weakening bullish momentum. Confirmation on lower timeframes (e.g., M15) is recommended before entry.

Bitcoin through next halving - on the cusp of a new cycleIf BTC makes a corrective move up and re-tests this region as support - this is what we think could happen. The tops/bottoms are never 100% accurate and change as market dynamics change - but this should give us a rough idea.

Bitcoin through next halving - on the cusp of a new cycle pt. 2Adding another view to my previous idea removing the volatility between the move. Please see for an idea of what the volatility could look like:
Key areas:
Keep an eye on RSI momentum
Keep an eye on major support levels which will be added as time goes on
Use pre-established profit points - and DON'T fomo when the time comes. Pick your sell points and COMMIT to them - put a post-it on your monitor.
