DCR - The Calm Before the Next Impulse!📈DCR has recently surged in a parabolic manner, posting one of its strongest rallies in months. However, after such a vertical move, a correction phase was inevitable, and that’s exactly what we’re seeing now.
📉At the moment, price is retracing within a clear descending channel, approaching a massive confluence zone marked by the demand area and the lower red trendline. This intersection represents a key area of interest to look for potential long setups.
⚔️If buyers manage to defend this zone, DCR could soon resume its next impulsive leg upward, potentially breaking out of the correction structure and extending the broader bullish momentum.
⚠️ Disclaimer: This is not financial advice. Always do your own research and manage risk properly.
📊All Strategies Are Good; If Managed Properly!
~Richard Nasr
Trend-reversal

Potential BUY Trade Idea GOLD (xauusd) 15mins TFLooking forward to go Long as a trend reversal trade setup.
Counter Trade- Highly Risk but tradable as long as we get the green light
Will update you soon when trade executed or becomes invalid.

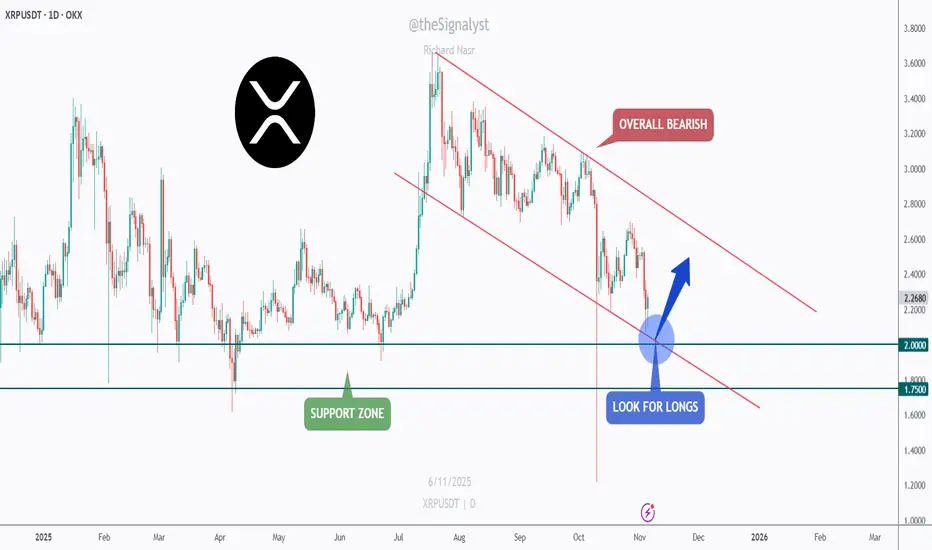
XRP - Watching the Confluence Zone for a Bullish Rebound!📉XRP has been in a clear bearish channel for months , forming consistent lower highs and lower lows.
However, the current structure is approaching a critical confluence zone, where the lower bound of the red channel meets the major green support area between $1.75 and $2.00.
⚔️As long as this intersection holds, I’ll be looking for potential long opportunities, anticipating a short-term bullish correction toward the upper boundary of the channel.
This setup offers a clean risk-to-reward opportunity if the bulls manage to defend the zone and regain momentum.
If the support gives way, further downside could follow, but for now, this area remains a key decision point for XRP’s next move.
⚠️ Disclaimer: This is not financial advice. Always do your own research and manage risk properly.
📊All Strategies Are Good; If Managed Properly!
~Richard Nasr
EURCAD - Buy the Bounce at Confluence!📈EURCAD remains in a steady rising channel on the daily. Price has pulled back into a strong support zone that perfectly aligns with the channel’s lower bound and the base of the recent micro wedge.
🏹As long as this confluence holds, I’ll be looking for trend-following longs from here, aiming first for the recent highs, then the channel top.
⚠️ Disclaimer: This is not financial advice. Always do your own research and manage risk properly.
📊All Strategies Are Good; If Managed Properly!
~Richard Nasr

EURCAD - Bounce Play at the Rail!EURCAD has been respecting its ascending channel beautifully , bouncing between the rails like clockwork. And right now, price is once again retesting the lower trendline, where buyers have consistently stepped in before launching new bullish waves.
🏹As long as this trendline and minor support around 1.62 hold firm, I’ll be watching closely for bullish rejections or reversal patterns to confirm a fresh leg upward. A clean bounce from here could send price back toward the orange structure zone around 1.6350, followed by a potential push toward 1.64+ if momentum builds up.
⚔️However, a break and close below 1.6180 would invalidate the setup and could shift control back to the bears — but until that happens, the path of least resistance remains to the upside.
In short, I’m expecting EURCAD to trap late sellers and fuel another rebound from the channel’s base, the kind of move that rewards patience and precision.
📊 All Strategies Are Good; If Managed Properly!
~Richard Nasr

BTC – Bounce Off Daily Support, Eyes on Supply!Bitcoin has bounced from the daily support area (the broad green zone around $110K–$112K), reclaiming the intraday breakdown zone near $114K and turning it into support on lower timeframes.
As long as price holds above $112K–$113K, the short-term bias remains constructive and I am looking for continuation toward $118K, followed by the $121K–$122K supply zone highlighted on the chart.
The bulls will remain in control as long as the $107,500 mark holds as support.
⚠️ Disclaimer: This is not financial advice. Do your own research and manage risk.
All Strategies Are Good; If Managed Properly!
~Richard Nasr.

NEAR – Post-Breakout Impulse in Play!NEAR has already broken out of its accumulation phase, confirming the end of its consolidation and the start of a fresh impulsive leg within the macro falling channel.
As long as price holds above the $2.80–$3.00 breakout zone, the bullish structure remains intact, with the next targets at $4.20–$4.80 and potentially $6.00–$7.00 — the upper boundary of the channel and a key confluence zone.
If price slips back below $2.80, it would signal a failed breakout and a possible retest of the previous lows.
⚠️ Disclaimer: This is not financial advice. Always do your own research and manage risk properly.
📚 Stick to your trading plan regarding entries, risk, and management.
Good luck! 🍀
All Strategies Are Good; If Managed Properly!
~Richard Nasr

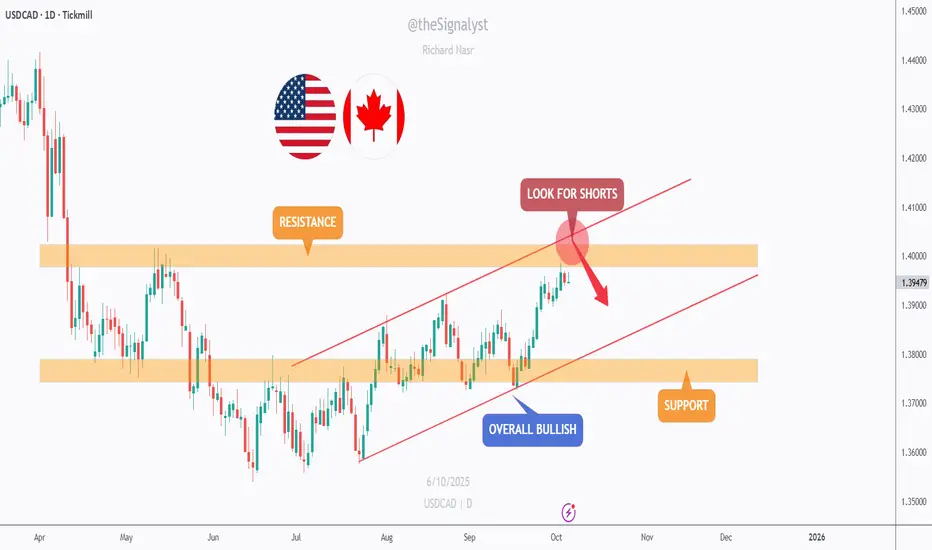
USDCAD – Testing a Major Resistance ZoneUSDCAD remains overall bullish, trading within a rising channel.
However, price is now approaching a key intersection between the upper trendline and a major resistance zone around 1.4000.
As price nears this confluence area, we’ll be looking for potential short opportunities, anticipating a possible rejection before any continuation higher.
The next support zone sits near 1.3750, where buyers might step back in if a pullback occurs.
⚠️ Disclaimer: This is not financial advice. Always do your own research and manage risk properly.
📚 Stick to your trading plan regarding entries, risk, and management.
Good luck! 🍀
All Strategies Are Good; If Managed Properly!
~Richard Nasr
USDJPY - Support Holding Strong!📈USDJPY has been overall bullish trading within the rising channel marked in blue.
This week, USDJPY has been bearish trading within the falling red wedge and it is currently rejecting the lower bound of it!
Moreover, the orange zone is a strong support.
🏹 Thus, the highlighted blue circle is a strong area to look for buy setups as it is the intersection of the lower red trendline and orange support.
📚 As per my trading style:
As #USDJPY is around the blue circle zone, I will be looking for trend-following bullish reversal setups (like a double bottom pattern, trendline break , and so on...)
📚 Always follow your trading plan regarding entry, risk management, and trade management.
Good luck!
All Strategies Are Good; If Managed Properly!
~Richard Nasr

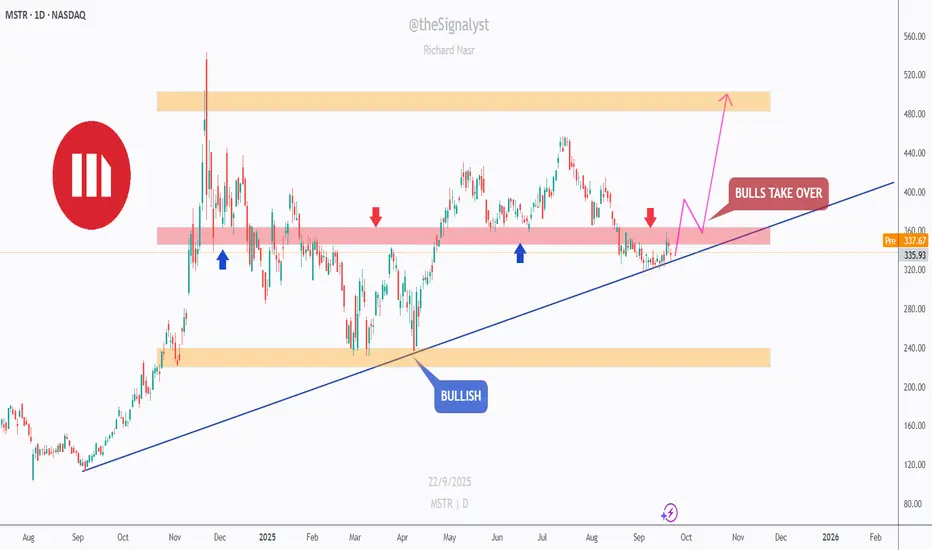
MSTR - Trendline Support vs. Supply Cap!MSTR has been overall bullish on the daily, respecting a rising trendline since last year. Price is coiling right beneath the 330–350 supply band after multiple rejections.
This area is key 🔑. It overlaps prior supply and the rising trendline—clean confluence. If bulls defend the trendline and we see a clean daily close above 350, momentum could extend toward 400 first, then 470–520 inside the broader range 🚀.
If the trendline gives way, I’ll look for a deeper dip toward 260–240 demand before bulls try again. Until then, structure favors the upside while the line holds.
What’s your plan => buy strength above 350 or wait for a retest on the trendline first? 🤔
⚠️ Disclaimer: This is not financial advice. Always do your own research and manage risk properly.
📚 Stick to your trading plan regarding entries, risk, and management.
Good luck! 🍀
All Strategies Are Good; If Managed Properly!
~Richard Nasr
XRP - Triangle Breakout, Eyes on 3.2?XRP broke out of its descending triangle on the daily and shifted the structure bullish. Price is now trading inside the 3.00–3.20 resistance band.
This zone is key 🔑. It’s prior supply and the top of the range. A clean daily close above 3.20 would open 3.40, then 3.60+ inside a fresh markup leg.
If buyers fail to clear it, I’ll watch for a healthy dip toward 2.80–2.90 (triangle base + demand) to reload. Bias stays bullish while the 2.70–2.80 floor holds.
What’s your plan - buy the break above 3.20 or wait for a retest into 2.80–2.90? 🤔
⚠️ Disclaimer: This is not financial advice. Always do your own research and manage risk properly.
📚 Stick to your trading plan regarding entries, risk, and management.
Good luck! 🍀
All Strategies Are Good; If Managed Properly!
~Richard Nasr

NZDUSD - Follow The Bulls AGAIN!Hello TradingView Family / Fellow Traders. This is Richard, also known as theSignalyst.
📈NZDUSD has been overall bullish trading within the rising broadening wedge marked in blue.
This week, NZDUSD has been retesting the lower bound of the wedge.
Moreover, the green zone is a strong structure.
🏹 Thus, the highlighted blue circle is a strong area to look for buy setups as it is the intersection of the lower blue trendline and green structure.
📚 As per my trading style:
As #NZDUSD approaches the blue circle zone, I will be looking for trend-following bullish reversal setups (like a double bottom pattern, trendline break , and so on...)
📚 Always follow your trading plan regarding entry, risk management, and trade management.
Good luck!
All Strategies Are Good; If Managed Properly!
~Richard Nasr

EURAUD – Channeling the Bears!EURAUD has been overall bearish 📉, trading inside a clear descending channel.
Price recently bounced and is now retesting the 1.7800 structure zone, which aligns with the upper bound of the channel. This area is acting as a strong confluence 🔑, making it a potential spot to look for short opportunities.
As long as price remains below this structure, sellers 🐻 are likely to stay in control, with downside continuation toward the channel’s lower bound.
Patience ⏳ is key here — waiting for bearish confirmation can provide a cleaner entry and reduce risk.
⚠️ Disclaimer: This is not financial advice. Always do your own research and manage risk properly.
📚 Stick to your trading plan regarding entry, risk, and trade management.
Good luck!
All Strategies Are Good; If Managed Properly!
~Richard Nasr

UDS – Bulls on the Move!Hello TradingView Family / Fellow Traders. This is Richard, also known as theSignalyst.
📈UDS has been overall bullish trading within the rising channel marked in blue.
This week, UDS has been retesting the lower bound of the channel.
Moreover, the green zone is a strong structure.
🏹 Thus, the highlighted blue circle is a strong area to look for buy setups as it is the intersection of the lower blue trendline and green structure.
📚 As per my trading style:
As #UDS approaches the blue circle zone, I will be looking for trend-following bullish reversal setups (like a double bottom pattern, trendline break , and so on...)
📚 Always follow your trading plan regarding entry, risk management, and trade management.
Good luck!
All Strategies Are Good; If Managed Properly!
~Richard Nasr
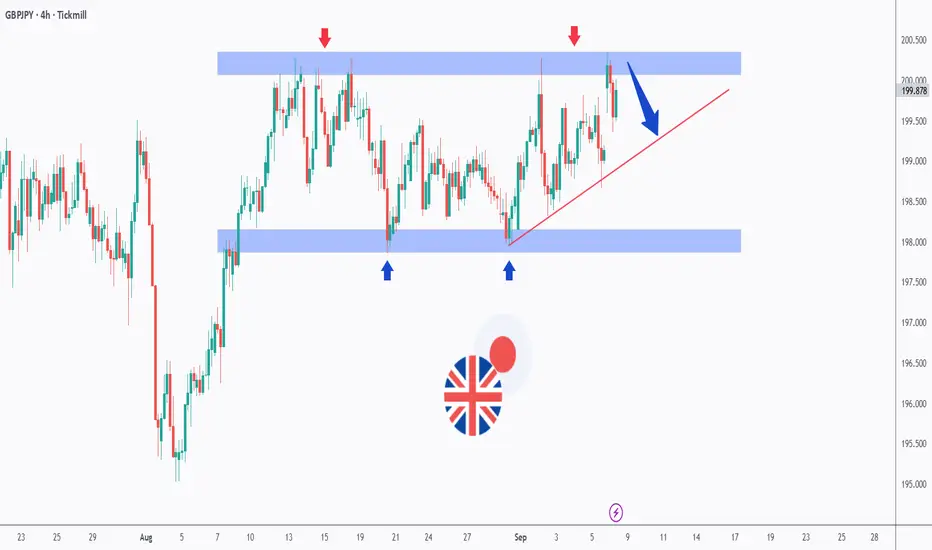
GBPJPY – Testing the Range Once AgainGBPJPY has been stuck in a wide range between 198.00 (support) and 200.50 (resistance) for several weeks now.
🔻 Sellers continue to defend the upper boundary (red arrows).
🔹 Buyers are stepping in around the 198.00 demand zone (blue arrows).
📈 Price is currently rejecting the resistance area once more while also sitting above the rising trendline (red).
If the resistance holds, we could see a rejection toward the lower bound of the range. On the other hand, a clean breakout above 200.50 would be needed for bulls to take full control. 🚀
This setup makes GBPJPY one of the key pairs to watch in the coming days.
Disclaimer:
This analysis is for educational purposes only and does not constitute financial advice. Always do your own research and follow your trading plan before making any investment decisions.
📚 Stick to your trading plan regarding entries, risk management, and trade execution.
Good luck!
All Strategies Are Good; If Managed Properly!
~Richard Nasr
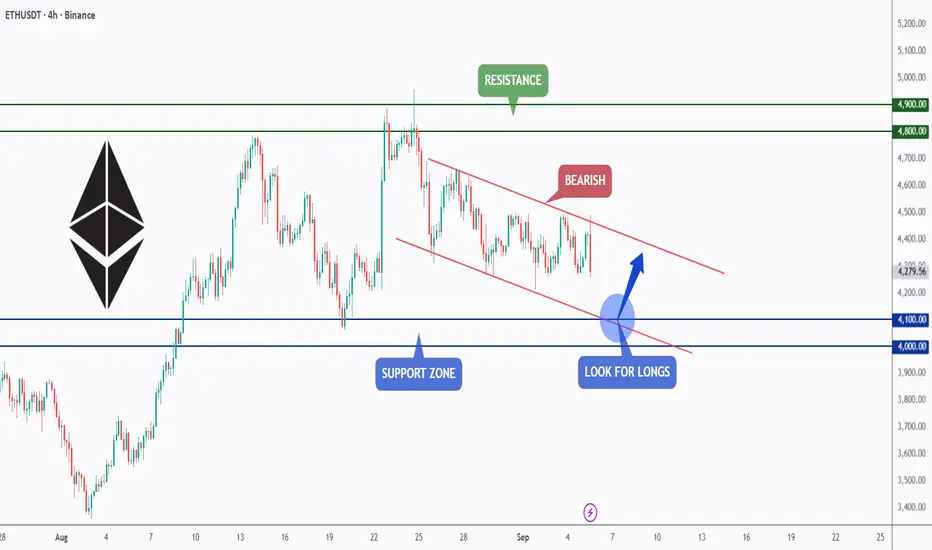
ETH – Watching the Falling Channel!Ethereum is currently trading within a falling channel on the 4H timeframe, showing short-term bearish pressure.
Price is approaching the support zone around the $4,000–$4,100 area, which also aligns with the lower boundary of the channel.
As long as this zone holds, it could act as a springboard for bullish momentum, offering a potential long setup.
A breakout from the channel would further confirm buyer strength and open the way toward the resistance zone near $4,800–$4,900.
⚠️ Disclaimer: This is not financial advice. Always do your own research and manage risk properly.
📚 Always follow your trading plan regarding entry, risk management, and trade management.
Good luck!
All Strategies Are Good; If Managed Properly!
~Richard Nasr
USDCHF - Demand Zone Meets Falling Wedge!USDCHF is approaching a key demand zone while trading inside a falling wedge pattern.
The price is now retesting the intersection of support and structure, a high-probability area where buyers may step in.
As long as this zone holds, I’ll be looking for long opportunities targeting a potential bounce back toward the upper boundary of the wedge.
⚠️ A break below the demand zone would invalidate this bullish setup and open the door for lower levels.
📚 Always follow your trading plan regarding entry, risk management, and trade management.
Good luck!
All Strategies Are Good; If Managed Properly!
~Richard Nasr

WMTX — From Accumulation to Breakout? WMTX has been in a strong bearish trend 📉 since late 2024, moving within a clear descending channel.
After months of decline, price action shifted into an accumulation phase 📊, forming a range between support and resistance (highlighted in blue).
Recently, buyers 🐂 have stepped in, pushing price toward the upper boundary of this range. A confirmed breakout 🚀 and retest of this zone could signal the end of accumulation and the start of a bullish markup phase 📈, with a potential target near $0.50 💰.
As long as the range low holds, the bias remains bullish ✅, but confirmation from a clean breakout is key for momentum to build.
🔔 Disclaimer: This analysis is for educational purposes only and does not constitute financial advice. Always do your own research and manage risk accordingly.
📚 Always follow your trading plan regarding entry, risk management, and trade management.
Good luck!
All Strategies Are Good; If Managed Properly!
~Richard Nasr

[Deep Dive] OP – Edition 4: Accumulated Pressure!Optimism (OP) may be quietly setting the stage for a classic reversal play — with structure, sentiment, and cycle theory all lining up.
After a sharp markdown throughout Q4 2024 and early 2025, OP has spent several months forming what appears to be a rounded accumulation base. And if history rhymes, a markup phase could be next.
🔍 Phase Breakdown
📉 Markdown
The aggressive downtrend sent OP tumbling from above $3 all the way to the $0.50–$0.60 support region, wiping out months of bullish structure and triggering capitulation.
📦 Accumulation
Since then, the price has been compressing sideways in a tight range, respecting the $0.50 psychological zone while creating a rounded bottom pattern. This sideways action — combined with declining volatility — suggests sellers are exhausted, and accumulation may be underway.
📈 Markup Potential
The current setup mirrors textbook market cycles, where markdown gives way to accumulation, followed by expansion. If OP breaks above the $0.70–$0.85 resistance zone with volume, the door opens for a rally toward $1.85 and even $2.00 — the next key supply zones.
⚙️ Fundamental Fuel
Optimism is more than just a Layer 2 — it’s the engine behind the Superchain vision. With OP Stack now powering not only Optimism but also chains like Base and Zora, the protocol is becoming the backbone of Ethereum’s scalability roadmap.
Recent key updates include:
- New governance structures via RetroPGF Round 3 distribution.
- Continued expansion of OP Stack rollups.
- Growth in on-chain activity and TVL thanks to Base's rapid adoption.
All of this adds up to strong long-term tailwinds — especially if Ethereum Layer 2 narratives reheat.
🧠 What to Monitor Next
🔍 Break above $0.85 = confirmation of phase shift.
📊 $0.50 remains the key invalidation level for the current bullish thesis.
🧨 Watch for volume spikes near resistance — they often precede explosive markups.
💬 Are we witnessing the calm before Optimism’s storm — or just another pause in a longer downtrend?
🔔 Disclaimer: This post is for educational and informational purposes only. It does not constitute financial advice. Always do your own research and manage risk carefully.
📚 Always follow your trading plan => including entry, risk management, and trade execution.
Good luck!
All strategies are good, if managed properly.
~ Richard Nasr

USDJPY - Now or Never!Hello TradingView Family / Fellow Traders. This is Richard, also known as theSignalyst.
📈USDJPY has been overall bullish trading within the rising channel marked in blue and it is currently retesting the upper bound of the channel acting as an over-bought zone.
Moreover, the green zone is a strong weekly resistance.
📚 As per my trading style:
As #USDJPY is around the red circle zone, I will be looking for bearish reversal setups (like a double top pattern, trendline break , and so on...)
📚 Always follow your trading plan regarding entry, risk management, and trade management.
Good luck!
All Strategies Are Good; If Managed Properly!
~Rich
Disclosure: I am part of Trade Nation's Influencer program and receive a monthly fee for using their TradingView charts in my analysis.

EURUSD - The Bears Are Getting Started!Hello TradingView Family / Fellow Traders. This is Richard, also known as theSignalyst.
📈EURUSD has been bullish trading within the rising blue channel.
However, it is currently retesting the upper bound of both red and blue channels.
🏹 The highlighted red circle is a strong area to look for sell setups as it is the intersection of the upper trendlines and orange resistance zone.
📚 As per my trading style:
As #EURUSD is around the red circle zone, I will be looking for bearish reversal setups (like a double top pattern, trendline break , and so on...)
📚 Always follow your trading plan regarding entry, risk management, and trade management.
Good luck!
All Strategies Are Good; If Managed Properly!
~Rich
Disclosure: I am part of Trade Nation's Influencer program and receive a monthly fee for using their TradingView charts in my analysis.

GBPUSD - Bearish Pressure Soon!Hello TradingView Family / Fellow Traders. This is Richard, also known as theSignalyst.
📈As per our last GBPUSD analysis, it rejected the $1.27 - $1.28 support zone and has been trading higher.
This week, GBPUSD is approaching the upper bound of its rising wedge pattern marked in red.
Moreover, the blue zone around $1.34 is a strong resistance and previous weekly high.
🏹 Thus, the highlighted red circle is a strong area to look for sell setups as it is the intersection of the upper red trendline and resistance.
📚 As per my trading style:
As #GBPUSD retests the red circle zone, I will be looking for bearish reversal setups (like a double top pattern, trendline break , and so on...)
📚 Always follow your trading plan regarding entry, risk management, and trade management.
Good luck!
All Strategies Are Good; If Managed Properly!
~Rich
Disclosure: I am part of Trade Nation's Influencer program and receive a monthly fee for using their TradingView charts in my analysis.

EURAUD - Long-Term Correction in the Making!Hello TradingView Family / Fellow Traders. This is Richard, also known as theSignalyst.
📈EURAUD has been bullish trading within the rising channel in blue.
Currently, EURAUD is retesting the upper bound of the channel.
Moreover, the $1.84 - $1.87 is a strong weekly resistance zone.
🏹 Thus, the highlighted red circle is a strong area to look for sell setups as it is the intersection of the upper blue trendline and green resistance zone.
📚 As per my trading style:
As #EURAUD is hovering around the red circle zone, I will be looking for bearish reversal setups (like a double top pattern, trendline break , and so on...)
📚 Always follow your trading plan regarding entry, risk management, and trade management.
Good luck!
All Strategies Are Good; If Managed Properly!
~Rich
Disclosure: I am part of Trade Nation's Influencer program and receive a monthly fee for using their TradingView charts in my analysis.
