NZDCHF: Downtrend MomentumSimilar to NZDCAD, there's a very similar signal on NZDCHF.
Daily Timeframe:
Unlike with NZDCAD, price broke through support very cleanly. It is currently holding below with no indication of a fakeout.
Likewise, EMA20 remains firmly below EMA60, which is the other indication that this is a downtrend.
Hourly Timeframe:
I use an ascending intraday trendline to indicate when the counter-trend movement is coming to an end. As price breaks below the intraday trendline, that's a good indication of confluence in the overall trend direction.
The EMA crossover is not great, which is a little bit of a concern to me. Will need to reduce risk and potential scale into a position depending on how this trade goes.
Trend

NZDCAD: Price Holding Below SupportNZDCAD has been in a messy daily range. The daily levels do not hold cleanly. However, I do think there's an opportunity here regardless.
The first trendline break indicates weakness. The second trendline break is cleaner as price is able to hold below this level on the daily timeframe.
Looking at the intraday timeframe, I plotted a trendline to look for confluence. Price crosses below this trendline and is somewhat supported by an exponential moving average crossover.
There is an opportunity to scale into this trade provided that it starts trending cleanly.

S&P (CASH500) | 30min Inverse Head & Shoulders | GTradingMethodHello Traders.
Welcome to today’s trade idea by GTradingMethod.
🧐 Market Overview:
Following Friday’s sharp rally after Jackson Hole, the S&P 500 may be forming a bull flag. If confirmed, this setup could drive an equal measured move higher, with the inverse head & shoulders pattern acting as a potential breakout structure.
📊 Trade Plan:
Risk/Reward: 3.6
Entry: 6460.1
Stop Loss: 6453.8
Take Profit 1 (50%): 6481
Take Profit 2 (50%): 6489
💡 GTradingMethod Tip:
Always wait for confirmation of breakout patterns to avoid false moves.
📌 Please note:
This is not financial advice. This content is to track my trading journey and for educational purposes only.

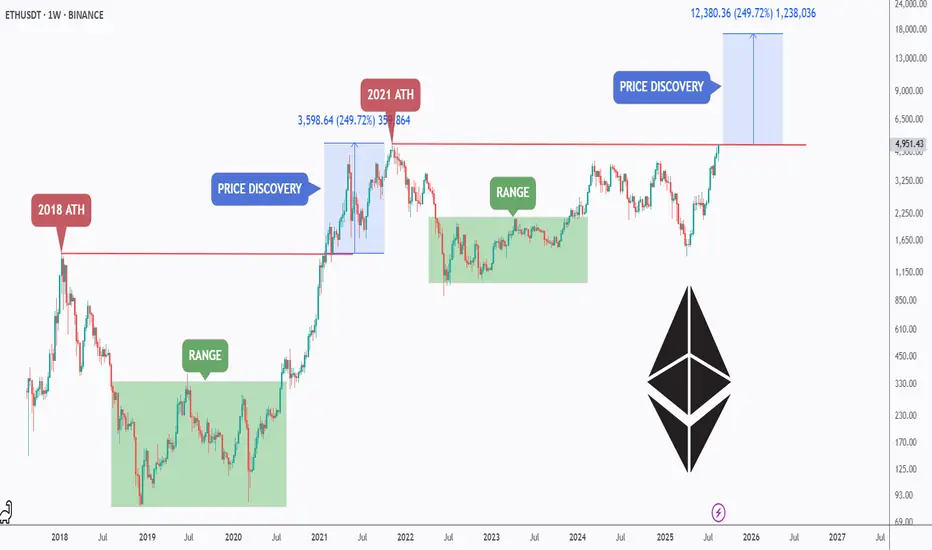
ETH – History Doesn’t Repeat, but It Often Rhymes!Ethereum has officially broken out above its previous ATH structure, entering a new price discovery phase.
📅 In 2018, ETH peaked, then spent years consolidating in a broad range before launching into the 2021 bull cycle.
Once the 2018 ATH was broken, ETH rallied nearly +250% in discovery mode, printing its 2021 ATH.
🏹After another extended range, ETH is now repeating history: breaking out again with room for another price discovery rally.
⏱️If ETH mirrors the last cycle’s percentage gain, the next optimistic target sits around $17,000–$18,000, aligning with a potential +250% leg from current breakout levels. 🚀
Cycles may not repeat perfectly, but they often rhyme — and Ethereum’s structure suggests we could be on the verge of another explosive move.
What do you think — can ETH surprise the market again this cycle? 👀🔥
📚 Always follow your trading plan regarding entry, risk management, and trade management.
Good luck!
All Strategies Are Good; If Managed Properly!
~Richard Nasr
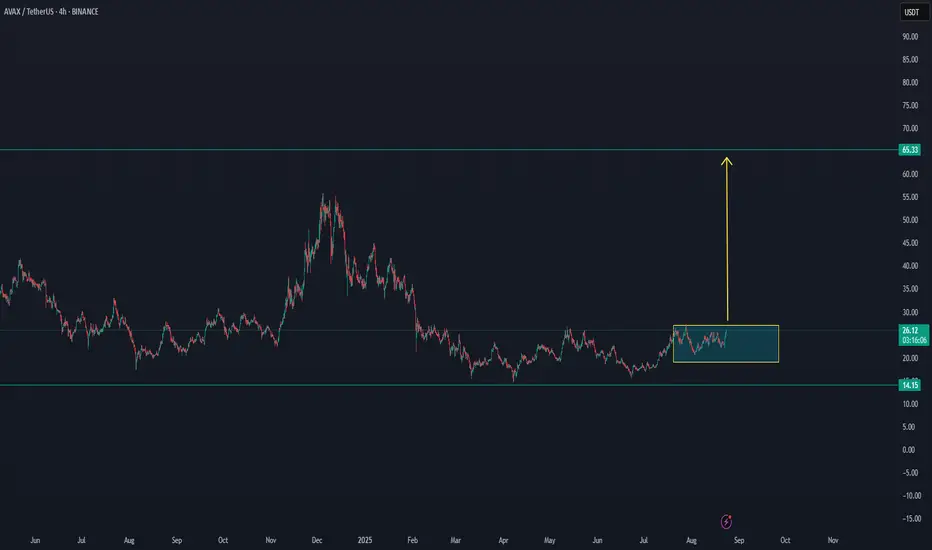
AVAX NEW INCREASE VOLUMEOn the lower time frame, AVAX appears to be building new levels, with a high probability of breaking out soon. We will be following this A-setup coin closely in the coming period
BNC - Where Cycles Meet Opportunity!In our last updates, we tracked how BNC NASDAQ:BNC shifted momentum and entered a bullish structure. Now, price is consolidating at a key support zone, a normal phase in bigger cycles, while the fundamentals continue to strengthen behind the scenes.
📊 Technical Analysis
- Cyclic rhythm: Price continues to respect cyclical lows (highlighted in green), suggesting we’re in a repeating accumulation/rebound structure.
- Support in play: The $20 - $21 level is being tested again, with the stronger $15 support zone still intact as a line in the sand for bulls.
- RSI confluence: Momentum indicators (RSI) are once again dipping into oversold territory, just as they did at the last local low, hinting at potential buyer re-entry.
- 200 MA: Price is sitting near the 200-period MA, adding another layer of dynamic support to watch.
If bulls hold the $20 area, we could see another cyclical rebound play out, targeting higher highs in the weeks ahead.
💡 Bigger Picture
What makes BNC stand out isn’t just its bold BNB strategy — it’s the timing . The crypto market is maturing, yet most U.S. investors are still locked out of direct BNB exposure. ETFs and sovereign funds are circling, but haven’t moved yet.
That means BNC is positioning itself ahead of the institutions - offering retail investors the rare chance to front-run Wall Street. It’s the kind of countercultural setup that often leads to the biggest asymmetrical gains: buy before the herd, hold before the headlines.
📌 Previous BNC analysis is attached for context.
➡ ️ Talk to your financial advisor and start your due diligence on CEA Industries (NASDAQ: BNC) before the institutions move in.
📚 Always follow your trading plan => including entry, risk management, and trade execution.
Good luck!
All Strategies Are Good, If Managed Properly.
~ Richard Nasr

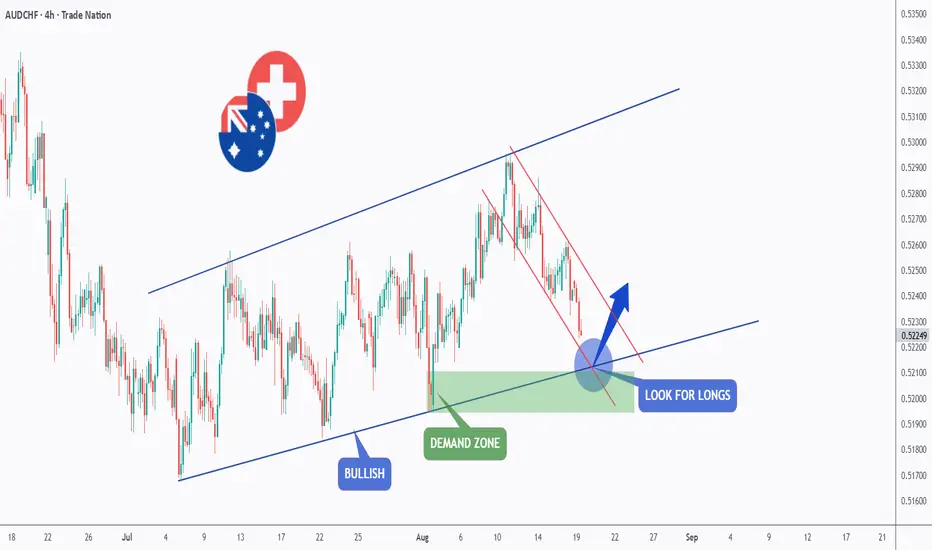
AUDCHF – Bulls Preparing for a Comeback?AUDCHF has been trading inside a broad ascending channel, showing a clear bullish structure. Recently, price pulled back within a corrective descending channel and is now approaching a key demand zone aligned with the lower bound of the channel.
🔎 If buyers step in here, we could see a potential reversal and continuation of the overall bullish trend.
👉 Plan: Look for long opportunities as price reacts around the demand zone and channel support.
📚 Always follow your trading plan regarding entry, risk management, and trade management.
Good luck!
All Strategies Are Good; If Managed Properly!
~Rich
Disclosure: I am part of Trade Nation's Influencer program and receive a monthly fee for using their TradingView charts in my analysis.
AUDCAD At Make-or-Break Zone – Time to Ride the Bulls?AUDCAD has been overall bullish trading within this rising channel 📈
Right now, price is retesting the lower bound acting as support 🔑
As long as this zone holds, I’ll be looking for longs targeting the upper bound 🎯
Patience is key here ⏳ — let the bulls step in, then ride the next impulse 🚀
📚 Always follow your trading plan regarding entry, risk management, and trade management.
Good luck!
All Strategies Are Good; If Managed Properly!
~Rich
Disclosure: I am part of Trade Nation's Influencer program and receive a monthly fee for using their TradingView charts in my analysis.

GBPJPY – Bulls Knocked Out, Bears Step In!After rejecting the 200.00 resistance, GBPJPY broke below key structure and shifted momentum to bearish.
Price is now retesting the broken support turned resistance, aligned with a descending trendline.
🔎 As long as this area holds, the bias remains bearish with potential for another downward leg.
👉 Plan: Look for short opportunities around the retest zone.
📚 Always follow your trading plan regarding entry, risk management, and trade management.
Good luck!
All Strategies Are Good; If Managed Properly!
~Rich
Disclosure: I am part of Trade Nation's Influencer program and receive a monthly fee for using their TradingView charts in my analysis.

AUDUSD: Breaks Below ChannelThere's a very strong channel that formed on CMCMARKETS:AUDUSDU2025 originating since February 2025.
On the daily timeframe, price tested the lower channel boundary at the beginning of August. At that time, price respected this channel.
However, this wasn't the case more recently when price broke below this channel boundary and closed below it.
Moving over to the hourly timeframe, I'm monitoring the price action. I plotted an initial low that price traded post-breakout.
If price crosses below this initial low and makes a new lower low, that's an indication that momentum is picking up. If price reverts back, then it's a classic fakeout and then we'll hold off on this trade as price reverts back into the channel.

FR40: Resistance BreakoutOn the daily timeframe, price tested a resistance level twice. The first time was in mid-July, which resulted in a strong bearish reaction.
The second time price tested the resistance was last and current week. There was barely any reaction, which leads me to believe sellers do not see this as an overbought area.
On the hourly timeframe, price did pull back slightly after crossing above the daily level. However, this is not a clear false breakout since price crossed above the intraday high rather quickly.

Gold Trading Strategy XAUUSD 20/8/2025Gold Trading Strategy XAUUSD 20/8/2025: Gold falls to lowest level since early this month, continues to be under pressure from potential talks, watching the FED minutes.
Fundamental news: Spot gold prices fell sharply, hitting their lowest intraday level since August 1. Gold prices fell as US President Donald Trump, Ukrainian President Zelensky and European leaders discussed potential talks with Russia. Safe-haven demand eased as security speculation in Kiev sparked optimism that the war could end.
Technical analysis: Gold prices broke out of a bullish pattern and formed a bearish channel on the H1 timeframe. Currently, the MA lines combined with the liquidity zone are the resistance zones of gold prices. However, gold prices can recover strongly when approaching the support area of 3300, the fluctuation range of gold prices today will be 3300 - 3350.
Important price zones today: 3335 - 3340, 3350 - 3355 and 3300 - 3305.
Today's trading trend: SELL.
Recommended orders:
Plan 1: SELL XAUUSD zone 3338 - 3340
SL 3343
TP 3335 - 3325 - 3315 - 3300.
Plan 2: SELL XAUUSD zone 3350 - 3352
SL 3355
TP 3347 - 3337 - 3327 - 3300.
Plan 3: BUY XAUUSD zone 3300 - 3302
SL 3297
TP 3305 - 3315 - 3335 - 3350.
Wish you a safe, successful and profitable trading day.🥰🥰🥰🥰🥰

EURUSD | Major Trend Reversal in Play? Bias: Sell Setup🧠MJTrading:
📸 Viewing Tip:
🛠️ Some layout elements may shift depending on your screen size.
🔗 View the fixed high-resolution chart here:
==================================================
📝 Idea: PEPPERSTONE:EURUSD | Major Trend Reversal in Play?
Bias: Bearish (Sell Setup)
📊 Structure Breakdown
- After the 2022–25 High at 1.18300, price has started forming Lower Highs and a Lower Low, hinting at a potential Major Trend Reversal (MTR).
- The Pressure Gap and Pullback rejection around the descending trendline strengthen the bearish outlook.
- Current Price Action suggests sellers are gradually taking control inside the Rising Wedge inside the Descending Channel:
ZOOM IN:
A 2nd leg is also possible.
📌 Trade Setup
Sell Entry: Around current price (~1.16800–1.17000).
Stop Loss: Above 1.18020 (invalidates the setup).
Targets:
TP1 → 1.15520 (mid-channel support).
TP2 → 1.14300 (major support zone - Channel Bottom line).
TP3 → 1.11800 (extension, strong liquidity pool).
Risk–Reward: Attractive multi-level downside with clear invalidation.
For confirmation wait for valid breakdown from the Rising Wedge...
“If the structure speaks to you, let it echo.”
#EURUSD #Forex #FX #Trading #TechnicalAnalysis #PriceAction #SmartMoney #MTR #MAJORTRENDREVERSAL #MarketStructure #TrendReversal #SwingTrading #DayTrading #ChartDesigner #MJTrading
Psychology Always Matters:

AUDCHF: Breaks Below Ascending TrendlineMy observations across the Daily (D1) and Hourly (H1) timeframes.
D1 timeframe:
My EMA20 is below the EMA 60. Price has ranged a bit longer than I anticipated, but we are now getting the indication that the downtrend is continuing.
Price is also below EMA20, which helps to signal momentum is picking up.
H1 Timeframe:
After price crossed below the daily ascending trendline, it stalled and then pulled back up. To some, this is a fakeout. To others, this is a liquidity trap.
I remained patient and found an opportunity to enter on the longer bearish bar, which shows price is pushing below prior lows after this breakout lower.

ETH - Eyes on a New All-Time High?ETHUSDT has been on fire lately, following a textbook bullish structure of Impulse → Fakeout → Impulse.
After breaking above the previous range in July, ETH confirmed strength with a sharp impulse move, only to shake out weak hands via a fakeout retest before pushing higher again. 📈
Currently, ETH is in the midst of another impulsive leg, with the next major target sitting at the ATH around $4,876.
📊 Key Notes:
- Fakeouts have served as liquidity grabs before strong rallies 🏹
- Current momentum favors the bulls 🐂
- As long as price holds above the last breakout zone (~$4,050–$4,150), the path of least resistance remains up.
🎯 Next Stop: ATH and beyond if bullish pressure sustains.
📚 Always follow your trading plan regarding entry, risk management, and trade management.
Good luck!
All Strategies Are Good; If Managed Properly!
~Richard Nasr

AUDUSD - Follow The Macro Trend!Hello TradingView Family / Fellow Traders. This is Richard, also known as theSignalyst.
📈AUDUSD has been overall bullish trading within the rising channel marked in blue.
This week, AUDUSD has been retesting the lower bound of the channel.
Moreover, the green zone is a strong weekly support.
🏹 Thus, the highlighted blue circle is a strong area to look for buy setups as it is the intersection of the lower blue trendline and green support.
📚 As per my trading style:
As #AUDUSD approaches the blue circle zone, I will be looking for trend-following bullish reversal setups (like a double bottom pattern, trendline break , and so on...)
📚 Always follow your trading plan regarding entry, risk management, and trade management.
Good luck!
All Strategies Are Good; If Managed Properly!
~Rich
Disclosure: I am part of Trade Nation's Influencer program and receive a monthly fee for using their TradingView charts in my analysis.

USDCHF - Follow The Bulls!Hello TradingView Family / Fellow Traders. This is Richard, also known as theSignalyst.
📈USDCHF has been overall bullish trading within the rising channel marked in blue.
This week, USDCHF has been retesting the lower bound of the channel.
Moreover, the green zone is a strong demand.
🏹 Thus, the highlighted blue circle is a strong area to look for buy setups as it is the intersection of the lower blue trendline and green demand.
📚 As per my trading style:
As #USDCHF approaches the blue circle zone, I will be looking for trend-following bullish reversal setups (like a double bottom pattern, trendline break , and so on...)
📚 Always follow your trading plan regarding entry, risk management, and trade management.
Good luck!
All Strategies Are Good; If Managed Properly!
~Rich
Disclosure: I am part of Trade Nation's Influencer program and receive a monthly fee for using their TradingView charts in my analysis.

EURUSD - One More Bearish Impulse Soon!Hello TradingView Family / Fellow Traders. This is Richard, also known as theSignalyst.
📈EURUSD has been overall bearish trading within the falling broadening wedge pattern marked in red and it is currently retesting the upper bound of the channel acting as a non-horizontal resistance.
Moreover, the blue zone is a strong supply.
📚 As per my trading style:
As #EURUSD retests the red circle zone, I will be looking for bearish reversal setups (like a double top pattern, trendline break , and so on...)
📚 Always follow your trading plan regarding entry, risk management, and trade management.
Good luck!
All Strategies Are Good; If Managed Properly!
~Rich
Disclosure: I am part of Trade Nation's Influencer program and receive a monthly fee for using their TradingView charts in my analysis.

AUDJPY - One More Bearish Impulse Soon!Hello TradingView Family / Fellow Traders. This is Richard, also known as theSignalyst.
📈AUDJPY has been overall bearish trading within the falling broadening wedge pattern marked in red and it is currently retesting the upper bound of the channel acting as a non-horizontal resistance.
Moreover, the green zone is a strong supply.
📚 As per my trading style:
As #AUDJPY retests the red circle zone, I will be looking for bearish reversal setups (like a double top pattern, trendline break , and so on...)
📚 Always follow your trading plan regarding entry, risk management, and trade management.
Good luck!
All Strategies Are Good; If Managed Properly!
~Rich
Disclosure: I am part of Trade Nation's Influencer program and receive a monthly fee for using their TradingView charts in my analysis.

XAUUSD: The decline has stopped, continue to buyAs the talks between Trump and Putin achieved results on Saturday, risk aversion decreased, gold fell rapidly at the opening, and after briefly breaking through 3330, it found support again and rebounded strongly, reaching a high of 3358. Subsequently, the price of gold entered a slow decline, mainly because the market was waiting for the results of the talks between Trump, Zelensky and several European leaders, which was the main factor affecting the subsequent rise and fall of gold prices.
Personally, I think it is unlikely that this meeting will completely resolve the situation between Russia and Ukraine. Since it cannot be resolved, the geopolitical risks still exist, and the market's risk aversion is unlikely to decline, so gold will continue to rise.
Today's focus is on 3340. If support is found, consider buying.
🏆Trade setup:
📈Buy at 3340
✅Target 1 - 3355
✅Target 2 - 3370
🛑Stop Loss - 3330
📣If you have different opinions, please leave a message below to discuss

LUMIA/USDT WILL THIS COIN FINALLY BREAK UP $1Lumia shows strong potential for new volume. Real-time data will confirm this. Once confirmation is in place, the coin is likely to rise — and we’ll provide follow-up updates
This coin can have risk, and it's not a high-quality choice.

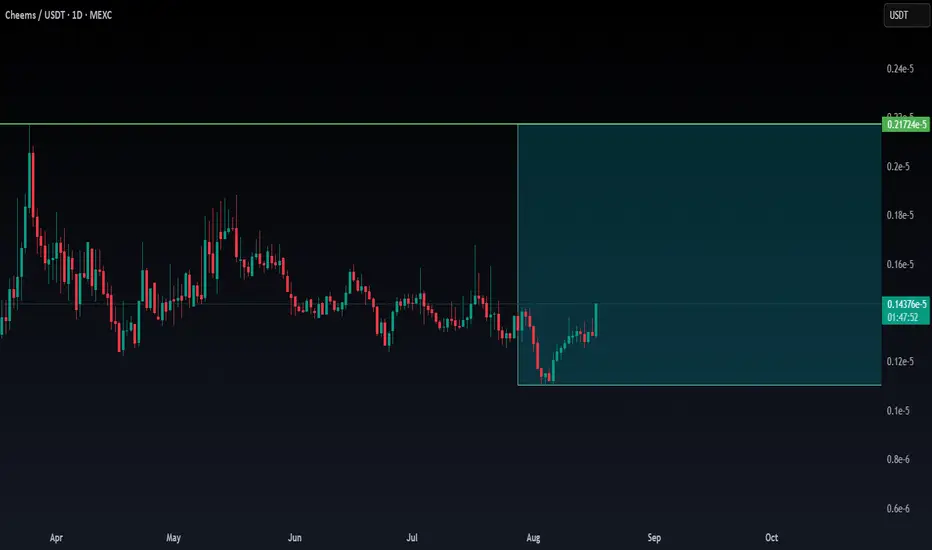
CHEEMS_USDT Can this coin make it on low time frame?Cheems seems to have interesting level confirmation. What could be confirmed in the coming hours?
For this reason, follow this day trade option to see the possibility.
In case there is a confirmation, the update will get a follow-up.
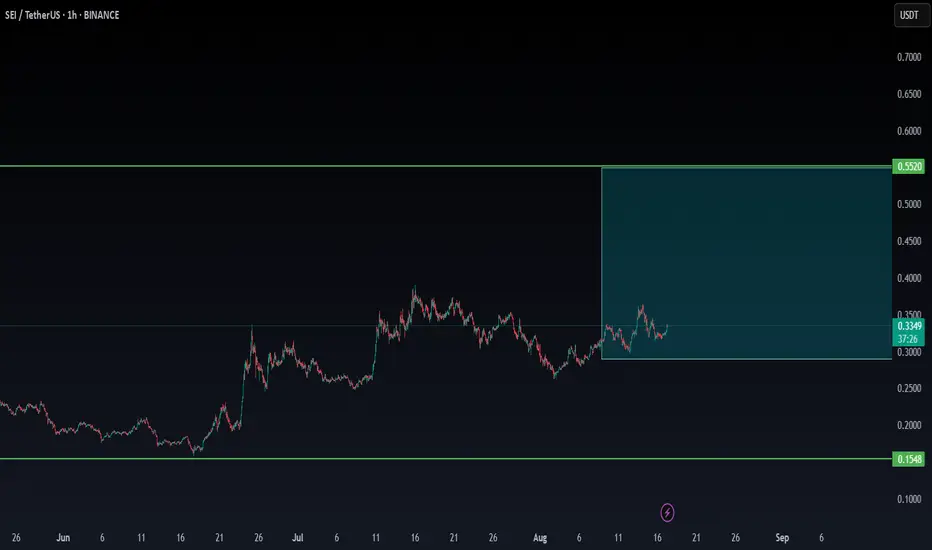
SEI/USDT NEW INCREASE VOLUMESEI is showing a new trend in volume, which may be confirmed in the coming time frames. We will continue to monitor the trend to see if confirmation occurs