Gold Trading Strategy XAUUSD August 14, 2025Gold Trading Strategy XAUUSD August 14, 2025:
Gold prices continued to rise in the European session on August 13, 2025 as mild US inflation data raised expectations of a Federal Reserve rate cut in September, while a weaker US dollar also boosted demand for gold.
Fundamental news: The US labor market report earlier this month initially weighed on the greenback, but the latest US CPI data added pressure as it did not show a clear acceleration in inflation due to tariffs in July. The inflation data reinforced the possibility that the Fed will take a more dovish stance in September, which is what the market is expecting.
Technical analysis: After a deep correction to the 3330 area, gold prices showed signs of increasing again. On the H1 frame, an upward price channel has been formed, but the current MA lines are still moving sideways, not showing a clear trend. The 3350 - 3355 area will be the important area to decide whether this uptrend channel can hold or not. RSI on H1 and H4 timeframes has entered the buy zone, this is a very good condition for us to trade. We will trade at the support zones and large liquidity zones of gold prices.
Important price zones today: 3350 - 3355, 3335 - 3340.
Today's trading trend: BUY.
Recommended orders:
Plan 1: BUY XAUUSD zone 3350 - 3352
SL 3347
TP 3355 - 3365 - 3375 - 3390.
Plan 2: BUY XAUUSD zone 3335 - 3337
SL 3332
TP 3340 - 3350 - 3370 - 3390.
Plan 3: SELL XAUUSD zone 3388 - 3390
SL 3393
TP 3385 - 3375 - 3365 - 3355 (small volume).
Wish you a safe, successful and profitable trading day.🥰🥰🥰🥰🥰
Trend

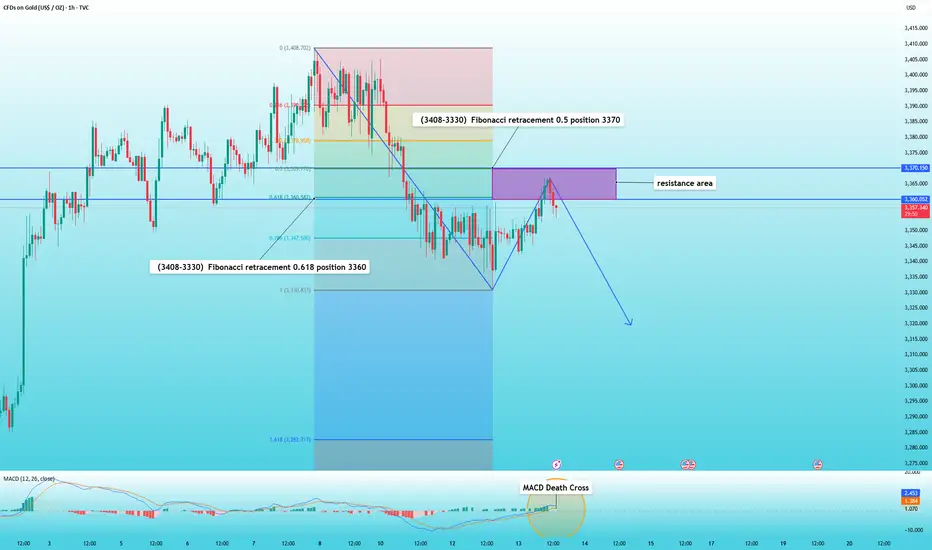
Gold rebounds and is facing resistance, waiting for a declineIn the previous article, I said that if the gold price cannot hold above 3370 in the short term, then the gold price will continue to fall.
Today's rebound in the Asian and European sessions shows mixed gains and losses on the K-line chart, indicating a weak rebound. After rebounding to 3367, gold prices turned downward again.
Meanwhile, the 1-hour MACD indicator also shows signs of forming a death cross. The Fibonacci retracement indicator from 3408 to 3330 indicates that the 0.618 level is at 3360, and the 0.5 level is at 3370. Therefore, the 3360-3370 range is currently a resistance zone.
Therefore, I still maintain my previous view that as long as it cannot hold 3370, you can short in the resistance area.
WMTX — From Accumulation to Breakout? WMTX has been in a strong bearish trend 📉 since late 2024, moving within a clear descending channel.
After months of decline, price action shifted into an accumulation phase 📊, forming a range between support and resistance (highlighted in blue).
Recently, buyers 🐂 have stepped in, pushing price toward the upper boundary of this range. A confirmed breakout 🚀 and retest of this zone could signal the end of accumulation and the start of a bullish markup phase 📈, with a potential target near $0.50 💰.
As long as the range low holds, the bias remains bullish ✅, but confirmation from a clean breakout is key for momentum to build.
🔔 Disclaimer: This analysis is for educational purposes only and does not constitute financial advice. Always do your own research and manage risk accordingly.
📚 Always follow your trading plan regarding entry, risk management, and trade management.
Good luck!
All Strategies Are Good; If Managed Properly!
~Richard Nasr

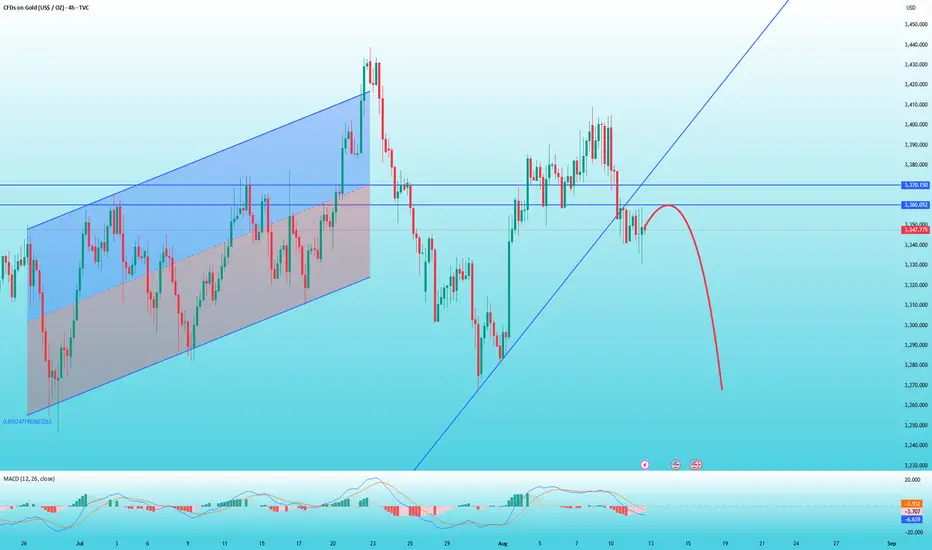
Gold rebound is weak, beware of further declineThe CPI data released this week was lower than market expectations, which is considered positive news. However, since it was the same as the previous reading, gold prices only rebounded briefly before entering another period of volatile consolidation.
From the 4-hour chart, gold prices have already broken through support levels. If they fail to break back above 3370 in the short term, they may continue to test the bottom.
Gold's rebound is weak in the short term, and it's trending downward. The K-line indicator is showing a bearish pattern, and the MACD indicator has formed a death cross.
Therefore, if you want to trade short, wait for a rebound around 3360. Set a stop-loss at 3370, with a target of 3340 and then 3330.
ARPA IS READY FOR NEW MOON FLYArpa seems to give us an important signal of volume, which can lead in the next 50% increase and more, will follow this coin for further building steps.

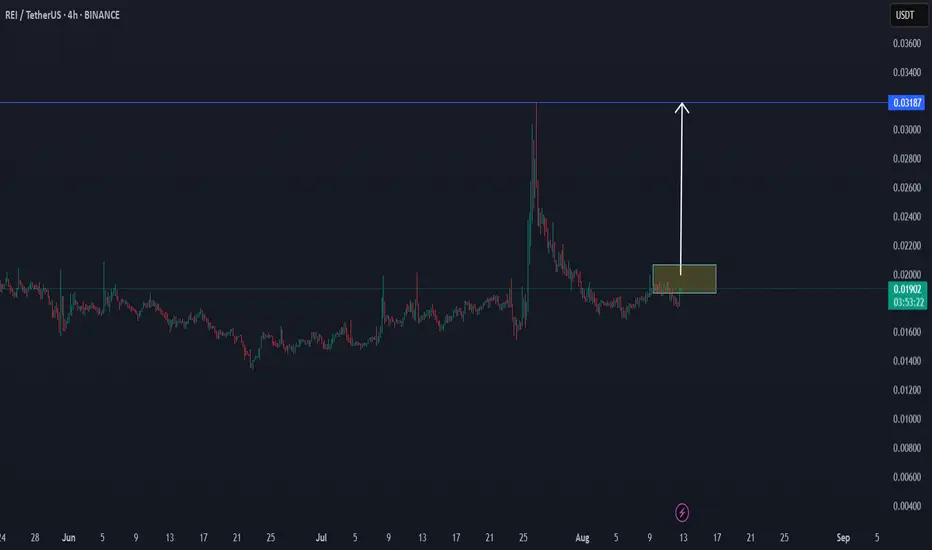
THE RETURN BREAK OF REI TO $0,032There is a good chance we are going to see a new break on REI as we saw before.
We will follow the coin for new volume.
XAUUSD Gold Trading Strategy August 12, 2025XAUUSD Gold Trading Strategy August 12, 2025:
Gold prices were under pressure on Monday (August 11) and recovered in the morning trading session today (August 12). US President Trump clearly stated that he would not impose import tariffs on gold, dispelling previous market concerns about disruptions to the global gold supply chain.
Fundamental news: Investors are paying attention to the Federal Reserve's interest rate outlook. Gold is entering a correction phase after tariff concerns are resolved, and price movements may be more influenced by Dollar and inflation data.
Technical analysis: Gold prices continue to correct downwards following the trend from last week, with MA lines still acting as resistance. Currently, the RSI H1 frame is approaching the oversold zone, and there is a high possibility that gold will recover this weekend. Resistance and high liquidity areas such as 3354 - 3359 and 3370 - 3375 will be very good trading areas.
Important price zones today: 3354 - 3359, 3370 - 3375 and 3318 - 3323.
Today's trading trend: SELL.
Recommended orders:
Plan 1: SELL XAUUSD zone 3357 - 3359
SL 3362
TP 3354 - 3344 - 3334 - 3324.
Plan 2: SELL XAUUSD zone 3373 - 3375
SL 3378
TP 3370 - 3360 - 3340 - 3320.
Plan 3: BUY XAUUSD zone 3318 - 3320
SL 3315
TP 3323 - 3333 - 3343 - 3363 (small vol).
Wish you a safe, successful and profitable trading day.🌟🌟🌟🌟🌟

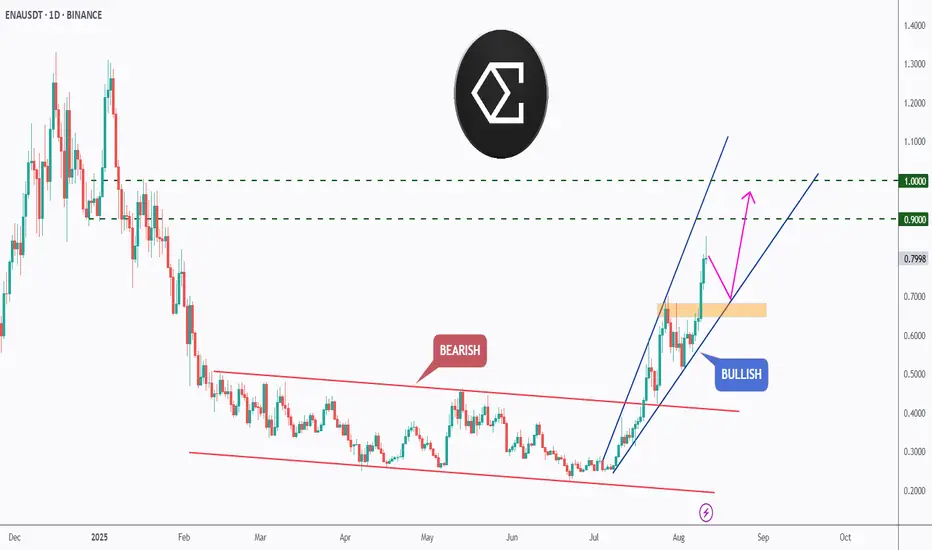
[Deep Dive] ENA – Edition 5: From Channel Break to $1?BINANCE:ENAUSDT ENA has just completed one of the cleanest bullish breakouts we’ve seen this month — transitioning from months of compression inside a bearish channel to an aggressive impulsive rally.
📉 Bearish Phase
For most of 2025, ENA traded within a descending parallel channel, stuck in a cycle of lower highs and lower lows. Momentum was firmly in the bears’ hands, and every rally attempt was quickly rejected at the channel’s upper bound.
📈 Bullish Breakout
In late July, the tide shifted. Price broke decisively above the channel, retested the breakout zone, and entered a steep ascending channel. This bullish structure is now guiding price toward the $0.90 and $1.00 resistance zones — key psychological and technical targets.
The current move has left an orange demand zone ($0.70–$0.72) in its wake, which could act as a magnet for a healthy retest before another push higher.
🔥 Fundamental Tailwinds
ENA (Ethena) has been making headlines in the DeFi yield space with its synthetic dollar protocol USDe, offering stable and high on-chain yields. Recent updates include:
Expansion of USDe collateral integrations across major DeFi protocols.
Strategic partnerships with lending and derivatives platforms, increasing USDe’s utility.
Continued growth in circulating USDe supply, signaling strong adoption.
As yields and DeFi activity heat up, ENA could continue to attract liquidity — especially with narratives around on-chain stable yields gaining momentum.
🧠 Key Levels to Watch
- Support: $0.70–$0.72 (demand zone)
- Immediate Resistance: $0.90
Major Breakout Target: $1.00 — a key round number and potential profit-taking zone.
A clean retest of the orange zone followed by bullish confirmation could offer one of the best risk-to-reward entries in weeks.
💬 What’s your take — will ENA clear $1 on this run, or does it need a deeper pullback first?
🔔 Disclaimer: This analysis is for educational purposes only and does not constitute financial advice. Always do your own research and manage risk accordingly.
📚 Always follow your trading plan regarding entry, risk management, and trade management.
Good luck!
All Strategies Are Good; If Managed Properly!
~Richard Nasr
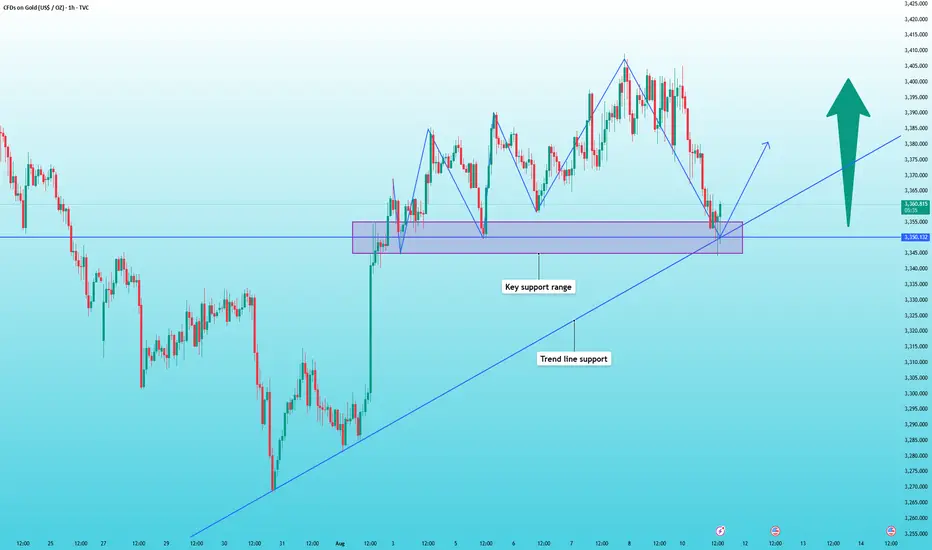
Gold support has been confirmed, buy with confidenceThe most anticipated outcome for the gold market this week is tomorrow's CPI data. After today's pullback during the Asian and European trading sessions, the current price has reached support levels. Before the CPI release, I believe volatility will be minimal, with a high probability of limited fluctuations.
The chart shows that 3350 is a key support level. After several hours of testing, 3350 has stabilized, so we can buy at this level, with the initial target being 3360, followed by 3380.
XAUUSD Gold Trading Strategy August 11, 2025
At the beginning of the new week's trading session, the gold price fell sharply from the 340x area to the current 335x area.
Basic news: The US Dollar Index (DXY) fell to around 98 last week, unable to stay above 100. Although the 10-year Treasury yield rose to 4.285%, the Dollar remained under pressure, reflecting market concerns about political risks in the United States.
Technical analysis: After the price met the 340x resistance area, it fell sharply. Currently, the H1 frame MA lines have turned into resistance, but the H4 frame is still support. The H1 frame RSI is showing signs of increasing again and moving towards the average line; the H4 frame RSI is adjusting towards the oversold area. We will wait at the resistance areas and liquidity areas to trade.
Important price zones today: 3375 - 3380, 3350 - 3355 and 3395 - 3400.
Today's trading trend: SELL.
Recommended orders:
Plan 1: SELL XAUUSD zone 3378 - 3380
SL 3383
TP 3375 - 3365 - 3355 - 3330.
Plan 2: SELL XAUUSD zone 3395 - 3397
SL 3400
TP 3392 - 3382 - 3362 - 3330.
Plan 3: BUY XAUUSD zone 3353 - 3355
SL 3350
TP 3358 - 3368 - 3378 - 3390 (small volume).
Wish you a safe, successful and profitable new trading week.🥰🥰🥰🥰🥰

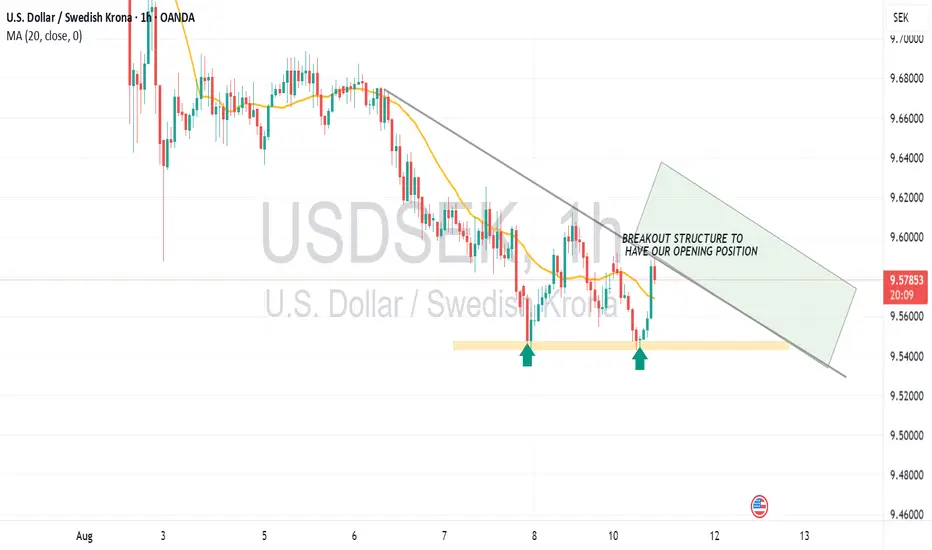
BREAKOUT OPENING FOR LONG POSITION WITH GREAT WIN RATEInformation to be provided regard this long trends. We wait for crossing and hit long range market with 200pip chances
Learning#05 : Decoding Highs and Lows📚 Learning#05 : Decoding Highs and Lows
- A Trader’s Guide to Reading the Market - Simple Yet Important
If the market were a book, the trend would be its storyline — and as traders, our job is to read that story without skipping pages. Trading with the trend puts the odds in your favor because you’re flowing with the market’s natural momentum, not fighting it.
Whether it’s an uptrend, downtrend, or a sideways grind, spotting it early gives you a big edge in deciding when to enter, when to exit, and when to simply step aside.
One of the simplest yet most reliable ways to read that story?
👉 Story of Highs and Lows
Let’s break it down.
📚 Understanding Highs and Lows in Trading
In technical analysis, highs and lows are the market’s way of leaving breadcrumbs.
A high is a peak before the market pulls back.
A low is a trough before the market bounces.
Track these points over time and you start to see patterns that reveal the market’s mood — bullish, bearish, or indecisive.
This isn’t about guessing; it’s about observing price action as it is.
📌 The Four Key Building Blocks of Market Structure
1️⃣ Higher Highs (HH)
Each new high is higher than the one before.Paired with higher lows, this signals an uptrend. Buyers are in control, and demand is pushing price upward.
Example: Nifty rallies from 22,000 to 22,200, pulls back to 22,100, and then rallies to 22,350. That second high (22,350) is higher than the first, confirming bullish momentum.
2️⃣ Higher Lows (HL)
Each pullback low is higher than the last.This tells you that sellers tried to push the market down — but buyers stepped in sooner this time, showing strength.
HLs often precede trend continuation and give great spots for entering long positions with tight risk.
3️⃣ Lower Lows (LL)
Each new low is lower than the previous one.Paired with lower highs, this marks a downtrend. Selling pressure is in charge, and rallies are being sold into.
4️⃣ Lower Highs (LH)
Each bounce high is lower than the last.This shows weakening buying pressure and often leads to another push lower.
Think of it like climbing stairs vs. walking down a hill:
📌 HH + HL = Stairs up → Bull trend.
📌 LL + LH = Hill down → Bear trend.
📈 HH+HL : Bullish Setup :
📉 LL+LH : Bearish Setup :
📌 Why It Matters for Traders
Price action is the most honest information in the market — no lag, no magic, no guesswork.
HH/HL → Bulls in control → Look for long setups.
LL/LH → Bears in control → Look for short setups.
Spotting these patterns on the fly means you can align with the dominant side instead of fighting it.
🧩 Combining HH & LL With Other Tools
📏 Fibonacci Retracements
Once you’ve identified the trend:
In an uptrend, draw Fibonacci from the latest HL to HH for pullback buying zones.
In a downtrend, draw from the latest LH to LL to find shorting opportunities.
⛰️ Fractals for Clarity
Fractals help pinpoint swing highs and lows without guesswork. I personally track HH/HL/LL/LH on a 1-minute chart for intraday trading — this keeps me in sync with the micro-trend while avoiding sideways traps.
🔀 Trendlines & VWAP
Trendlines show the bigger path, VWAP confirms intraday balance. When HH or LL aligns with these, you’ve got high-confluence setups.
🥷 Kiran’s Approach
For intraday, I start by mapping the structure: HH, HL, LL, LH. This gives me the immediate trend bias and alerts me to potential reversals early. I track them on a 1-min chart, combine with Fibonacci and trendlines, and trail stops as the structure unfolds.
It’s simple, visual, and keeps me out of bad trades and warns me to stay out of a sideways market situation, too.
🔑 Key Takeaway
Market structure is like a language — HH, HL, LL, and LH are its alphabet. Once you learn to read it, you’ll never trade blind again.
💡 “Trade what you see, not what you think. The chart always whispers first — you just have to listen.”
Start marking highs and lows on your chart tomorrow. Watch the story unfold. Trade in sync, and you’ll notice your entries become sharper, your exits cleaner, and your confidence higher.
See you in the next one — and until then:
Keep it simple. Trade with structure. Trust the levels.
— Kiran Zatakia
XRP - Wait for It!Hello TradingView Family / Fellow Traders. This is Richard, also known as theSignalyst.
📈XRP has been overall bullish trading within the rising wedge pattern marked in blue, and it is currently retesting the lower bound of the wedge.
Moreover, it is retesting a strong demand zone marked in orange.
🏹 The highlighted blue circle is a strong area to look for buy setups as it is the intersection of the orange demand zone and lower blue trendline acting as a non-horizontal support.
📚 As per my trading style:
As #XRP retests the blue circle zone, I will be looking for bullish reversal setups (like a double bottom pattern, trendline break , and so on...)
📚 Always follow your trading plan regarding entry, risk management, and trade management.
Good luck!
All Strategies Are Good; If Managed Properly!
~Richard Nasr

XAUUSD Gold Trading Strategy August 8, 2025XAUUSD Gold Trading Strategy August 8, 2025:
Gold prices have approached the 340x area and have fallen sharply to the 338x support area at the beginning of today's trading session.
Basic news: President Trump announced to double tariffs on Indian goods to 50% in response to continued oil imports from Russia. Reports show that Trump may meet with Russian President Vladimir Putin as early as next week.
Technical analysis: Gold prices are currently in an uptrend channel, but the trading range is showing signs of narrowing. The possibility that the price will correct at this 340x area is very high; if the gold price creates a double peak pattern in the H1 frame, the price range of 3375 - 3380 will confirm the pattern and create a strong downward force for the gold price. If gold forms a double top pattern here, this correction could take gold to the 3350 or even 3330 area.
Important price zones today: 3375 - 3380, 3405 - 3410 and 3420 - 3425.
Today's trading trend: SELL.
Recommended orders:
Plan 1: SELL XAUUSD zone 3407 - 3409
SL 3412
TP 3404 - 3394 - 3374 - 3354.
Plan 2: SELL XAUUSD zone 3423 - 3425
SL 3428
TP 3420 - 3410 - 3390 - 3370.
Plan 3: BUY XAUUSD zone 3375 - 3377
SL 3372
TP 3380 - 3390 - 3400.
Wish you a safe, successful and profitable trading weekend.🌟🌟🌟🌟🌟

USDJPY – From Shorts to Longs!USDJPY has been trading within a rising channel, maintaining an overall bullish structure in the medium term.
🔍 Current Setup:
We previously looked for shorts from the weekly resistance near the upper bound of the channel — and price reacted as anticipated.
Now, we are waiting for a retest of the lower bound, which is the intersection of the lower trendline and the daily support area, to look for trend-following longs in line with the prevailing bullish trend.
📌 Plan:
Shorts have already played out from the upper bound.
Next, watch for bullish reversal signals around the lower trendline + support confluence for potential long entries.
🎯 Patience is key — let price come to you before taking action.
📚 Always follow your trading plan regarding entry, risk management, and trade management.
Good luck!
All Strategies Are Good; If Managed Properly!
~Richard Nasr
Disclosure: I am part of Trade Nation's Influencer program and receive a monthly fee for using their TradingView charts in my analysis.

Bitcoin: Interconnectedness of Defining CyclesJust a followup analysis on scalable structure from "Natural Patterns & Fractal Geometry" ed idea.
Additional Regularities:
2018 Downtrend Phase Fib Resonation:
Fibonacci ratios are not just mathematical abstractions; they manifest in Bitcoin's market structure due to human behavior and market psychology.
2020 Uptrend Phase Fib Resonation:
Unconventional use of Fibonacci ratios highlights areas where price has shown significant reactions. These levels act as dynamic support and resistance zones, underscoring the fractal and cyclical nature of Bitcoin's price movements.
2021 - Late 2022 Crash Metrics More detailed breakdown of emerging randomness:
The repetitive alignment of market cycles with Fibonacci levels underscores Bitcoin's tendency to oscillate between predictable extremes, offering insights for timing entries and exits.
Distinct cycles are clearly visible, separated by major tops (e.g., ATH in 2013, 2017, and 2021) and bottoms (e.g., the 84.12%, 72.26%, and 77.57% corrections). Each cycle adheres to Fibonacci retracement and extension levels, demonstrating a self-similar structure .
Price expansions align with Fibonacci extensions (e.g., 1.618 and beyond), showing that Bitcoin’s growth phases are not random but rather guided by harmonic principles.
The ascending channels mapped through Fibonacci ratios capture both the bullish and corrective phases, showcasing the market's bounded yet fractal rhythm .
The percentage swings (+2484.44%, +12804.20%, +1692.21%, +600.07%) highlight the explosive nature of Bitcoin during expansion phases, followed by steep corrections. These as well align with Fibonacci proportions, providing a blueprint for market rhythm.

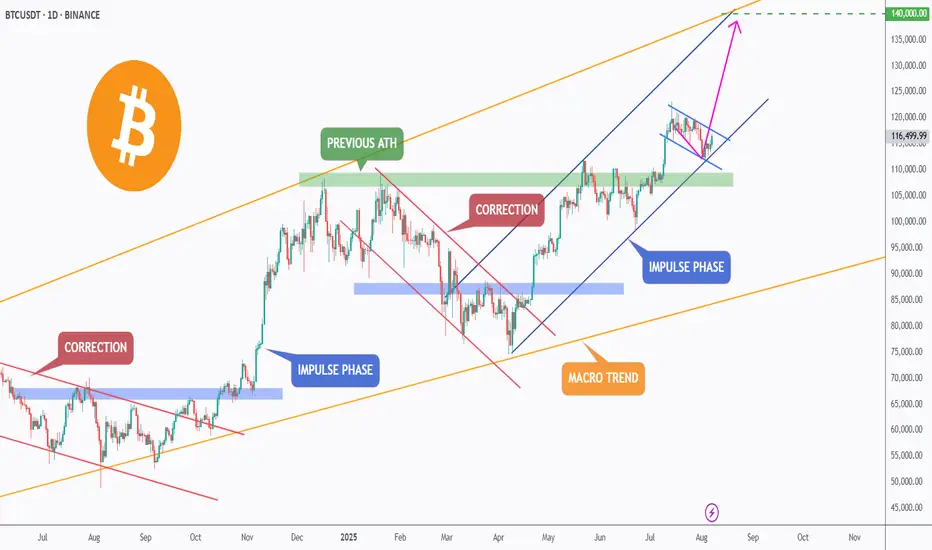
BTC – Breakout Loading?Bitcoin continues to respect its macro bullish trend (🟠), trading within a large ascending channel that has guided price action for over a year.
After breaking above the previous ATH 🟢, BTC entered a correction phase 🔻, retesting the green zone — a key structure now acting as support.
The bulls stepped back in, initiating a new impulse phase 🔵. Currently, BTC is consolidating within a small blue descending channel — forming a classic bullish flag 🏁 pattern.
⚠️ For the bulls to take over and trigger the next impulsive wave toward $140,000 🎯, we need to see a confirmed break above this small blue channel. This would signal trend continuation and open the door to the upper boundary of the macro channel.
✅ Key levels to watch:
- Support: ~$110,000 (green demand zone) 🟩
- Resistance: Top of the blue flag 🟦
- Target: $140,000 💰
A breakout from here could fuel the next major rally — stay sharp and follow the trend!
💬 What’s your bias here? Are you bullish or waiting for a deeper pullback?
📚 Always follow your trading plan regarding entry, risk management, and trade management.
Good luck!
All Strategies Are Good; If Managed Properly!
~Richard Nasr
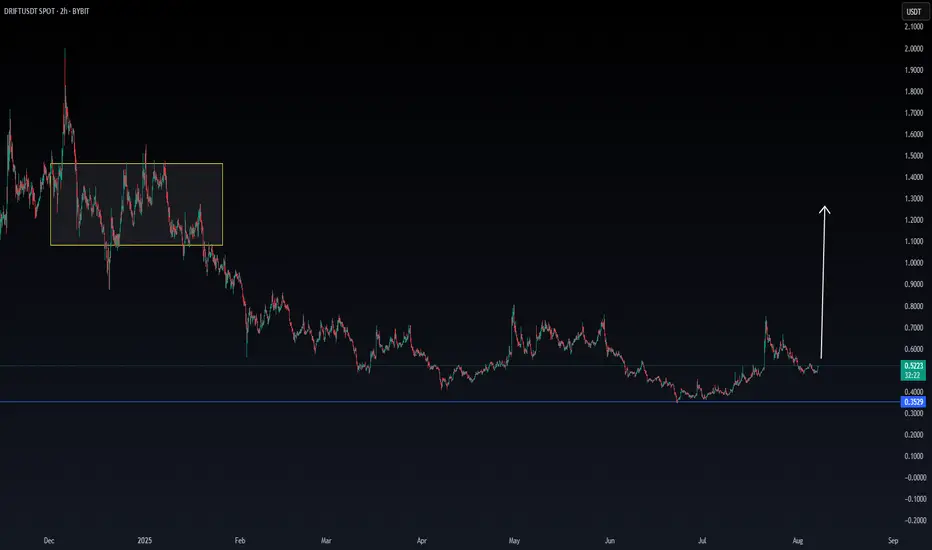
DRIFT/USDT Starting the engine to moonDrift seems to have a new upcoming volume, which can be confirmed in the coming hours.
Will follow Drift for more confirmations.
XAUUSD Gold Trading Strategy August 7, 2025XAUUSD Gold Trading Strategy August 7, 2025:
Gold prices are steady as US President Donald Trump has imposed an additional 25% tariff on Indian goods due to India's continued purchases of Russian energy. This new measure raises the current 25% tariff on Indian goods to 50%.
Fundamental news: The current market pulse is still mainly revolving around the tariff story initiated by Trump, in which spot gold is trading in a fairly narrow range. Gold is still waiting for further impact from the Fed's interest rate cut process, a weaker dollar will create support for non-yielding gold.
Technical analysis: The trading range of gold prices is currently narrowing, RSI on H1 and H4 frames is approaching the overbought zone. Gold prices have recovered, but resistance zones such as 3400 - 3405 and 3420 - 3425 can be short-term profit-taking areas for investors. Liquidity zones and Fibonacci frames show that the upward force of gold prices is showing signs of slowing down.
Important price zones today: 3373 - 3378, 3400 - 3405 and 3420 - 3425.
Trading trend today: SELL.
Recommended orders:
Plan 1: SELL XAUUSD zone 3402 - 3404
SL 3407
TP 3399 - 3390 - 3380 - 3360 - OPEN.
Plan 2: SELL XAUUSD zone 3423 - 3425
SL 3428
TP 3420 - 3410 - 3390 - 3370 - OPEN.
Plan 3: BUY XAUUSD zone 3373 - 3375
SL 3370
TP 3378 - 3388 - 3400 (small volume).
Wishing you a safe, successful and profitable trading day.💗💗💗💗💗

US30 Bullish Bias Builds on Fed and Earnings OptimismUS30 – Market Overview
The market is showing bullish momentum, supported by recent developments from the Federal Reserve and a strong corporate earnings season.
Technically, the price action suggests a continuation of the uptrend toward 44610.
🔻 However, bearish momentum may be triggered if the price breaks below 44170.
🔹 Resistance: 44360, 44610 – 44820
🔹 Support: 44170 – 43960 – 43630

Supply in Sight: AUDUSD Gearing Up for a Reversal?Hello TradingView Family / Fellow Traders. This is Richard, also known as theSignalyst.
📈AUDUSD has been overall bullish trading within the rising channel marked in red and it is currently retesting the upper bound of the channel acting as an over-bought zone.
Moreover, the blue zone is a strong supply.
📚 As per my trading style:
As #AUDUSD approaches the red circle zone, I will be looking for bearish reversal setups (like a double top pattern, trendline break , and so on...)
📚 Always follow your trading plan regarding entry, risk management, and trade management.
Good luck!
All Strategies Are Good; If Managed Properly!
~Rich
Disclosure: I am part of Trade Nation's Influencer program and receive a monthly fee for using their TradingView charts in my analysis.

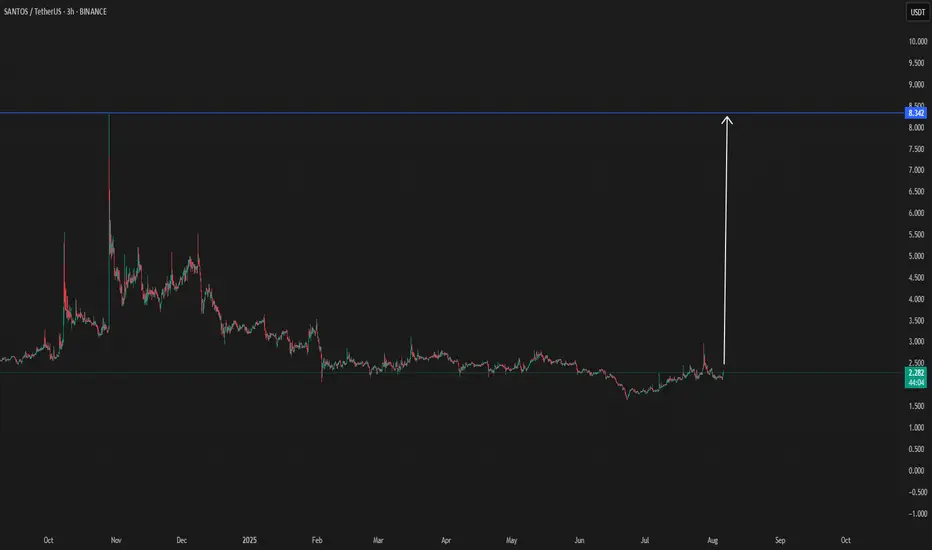
SANTOS/USDT $8 Possible targetSantos shows an interesting view since today, which can confirm a break
When there is confirmation will add here below
Like it did before, it can do it again.
EURGBP – Bearish Continuation in Play?Hello TradingView Family / Fellow Traders. This is Richard, also known as theSignalyst.
📈EURGBP has been overall bearish trading within the falling channel marked in orange.
Moreover, the green zone is a strong structure.
📚 As per my trading style:
As #EURGBP approaches the red circle zone, I will be looking for bearish reversal setups (like a double top pattern, trendline break , and so on...)
📚 Always follow your trading plan regarding entry, risk management, and trade management.
Good luck!
All Strategies Are Good; If Managed Properly!
~Richard Nasr
Disclosure: I am part of Trade Nation's Influencer program and receive a monthly fee for using their TradingView charts in my analysis.
