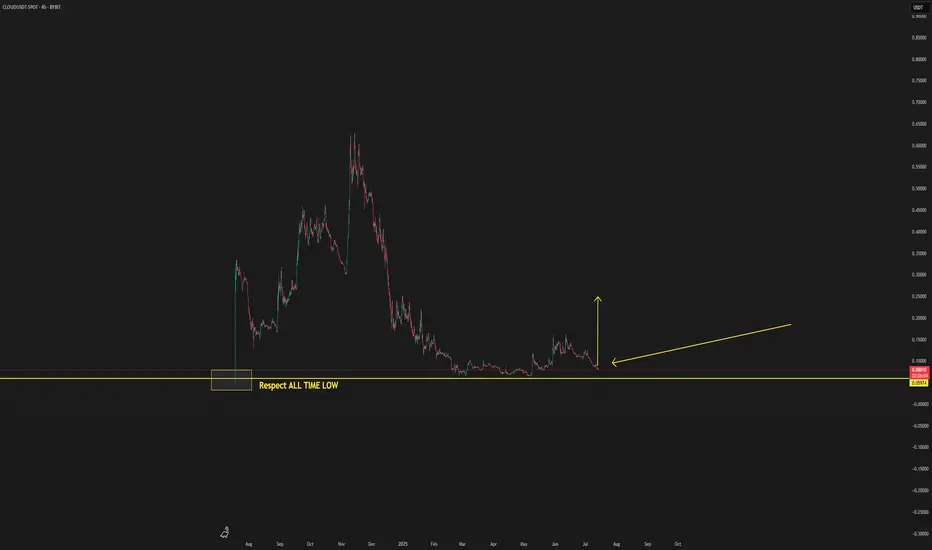
CLOUD THIS CAN BE THE BOTTOM STARTThis is a new coin to watch in the coming period, as it is showing signs of potentially forming a new bottom.
By respecting the previous all-time low, there’s a possibility that a new upward trend could begin from this level. Some indicators are also pointing toward this scenario.
If the coin provides further confirmations, updates will be shared below.
Trend
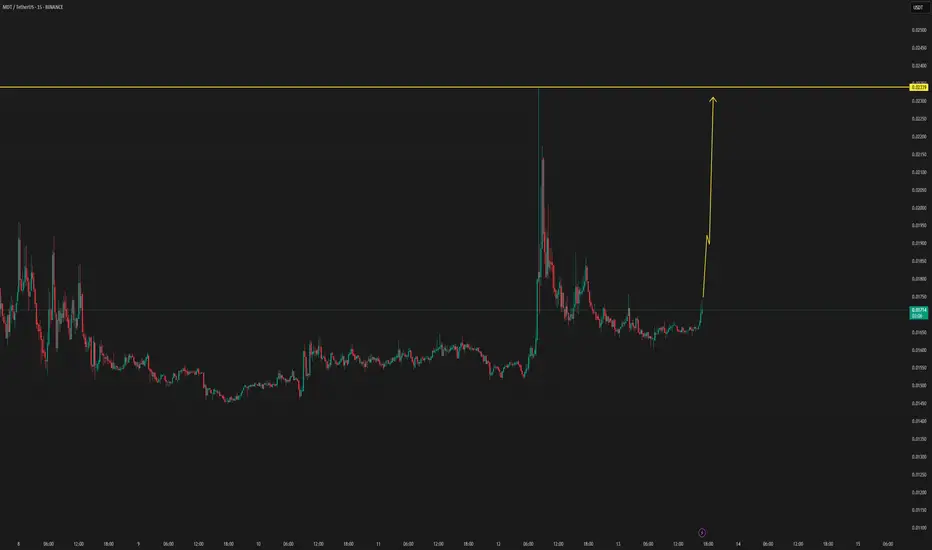
MDT NEW INCREASE VOLUMEMDT/USDT has new volume upcoming, which can be confirmed in the coming time frames. by new confirmations, the update will be followed below.
AIN/USDT : IS THIS THE COIN THAT WILL DO IT?? MOON SHOTAfter analyzing this coin, we’ve identified signals suggesting a potential breakout in the near future. As a result, we will continue monitoring it closely for confirmation.
Once confirmation is established, further updates will be provided below.
follow up the $0,30, expecting as first target

BTC & USDT.D => Bullish Correction Incoming?Hello TradingView Family / Fellow Traders. This is Richard, also known as theSignalyst.
Both BTC and USDT.D are sitting around key rejection zones.
💰 BTC is hovering near the $100,000 level — a major previous low and a psychological round number.
📊 Meanwhile, USDT.D is testing the 5% resistance — a supply zone and another critical round number.
As long as $100,000 holds as support on BTC and 5.1% holds as resistance on USDT.D, we could expect a bullish correction across the crypto market.
What do you think? Will these levels hold or break? 🤔
📚 Always follow your trading plan regarding entry, risk management, and trade management.
Good luck!
All Strategies Are Good; If Managed Properly!
~Rich

ETH Building Blocks - Keep it Simple🧱 Building Block - ETH Weekly Analysis 🧱
Ethereum has been trading within a well-defined structure, respecting key horizontal zones — each acting as a crucial building block in ETH’s macro journey.
🔹 Zone 1 ($1,700 - $2,100)
A strong demand and accumulation zone. ETH bounced from here multiple times, proving itself as the foundation of the current bullish attempt.
🔹 Zone 2 ($2,400 - $2,600)
We're currently hovering around this key mid-range resistance. A successful break above it would pave the way for the next major leg up.
🔹 Zone 3 ($2,900 - $3,400)
A major historical resistance turned supply area. ETH needs strong momentum and volume to break through this ceiling.
🔹 Zone 4 ($3,800 - $4,200)
The final building block before retesting ATH territory. A retest here could signal full bullish control in the coming months.
📍 As long as Zone 1 holds, ETH remains structurally bullish. Watch for breaks and rejections at each building block to gauge the next move.
Which block will ETH break next? 🔮
📚 Always follow your trading plan regarding entry, risk management, and trade management.
Good luck!
All Strategies Are Good; If Managed Properly!
~Rich

SEI - One More Bullish Impulse Soon!Hello TradingView Family / Fellow Traders. This is Richard, also known as theSignalyst.
📈After surging by over 75% last week , SEI is currently in a correction phase.
However, it is approaching the intersection of the previous high marked in orange and blue trendline acting as a non-horizontal support.
📚 As per my trading style:
As #SEI approaches the blue circle zone, I will be looking for bullish reversal setups (like a double bottom pattern, trendline break , and so on...)
📚 Always follow your trading plan regarding entry, risk management, and trade management.
Good luck!
All Strategies Are Good; If Managed Properly!
~Rich

BTC – Bullish Continuation Ahead ?Bitcoin has been trading within a well-defined rising channel since mid-2023, respecting both upper and lower bounds beautifully.
After each impulsive move, we’ve seen healthy corrections followed by bullish continuations — a classic market structure in play.
🟦 Accumulation Zone: After a long accumulation phase, BTC kicked off a strong bullish cycle.
🟥 Correction Phases: Each major move was followed by a red correction zone before resuming the uptrend.
🟧 Current Phase: BTC is consolidating just below the upper channel boundary. A breakout above this zone could confirm the next bullish wave toward $140K+.
🔵 Key Observations:
Structure remains intact within the channel
Previous breakout zones now acting as support (blue arrows)
Continuation patterns are forming, signaling potential upside
🏹As long as the orange zone holds, BTC remains in a bullish structure, and a breakout would likely push us to new highs.
📍Will history repeat and BTC continue its journey toward the upper channel boundary? Let’s wait for confirmation!
💬 What’s your bias here? Are you bullish or waiting for a deeper pullback?
📚 Always follow your trading plan regarding entry, risk management, and trade management.
Good luck!
All Strategies Are Good; If Managed Properly!
~Richard Nasr

SUPER = BACK WITH SUPER EFFECT - MOON SHOTSuper can show in the coming time frames an interesting view.
When there is confirmations, will add below this update.

WAVES ON WAY TO $2waves have a high chance to enter a new break to 2 usd, since the last data.
When there is more confirmation, the updates will be below.

SPX500 Bearish Below 6246 – Eyes 6223 and 6195SPX500 Analysis
SPX500 stays under bearish pressure below 6246, targeting 6223 and possibly 6195 if the decline continues.
Recent tariff escalation by President Trump is adding weight to downside momentum across indices.
Pivot: 6246
Support: 6223, 6195, 6143
Resistance: 6268, 6291

XRP - Wait For It!Hello TradingView Family / Fellow Traders. This is Richard, also known as theSignalyst.
📈 Is history repeating itself? 🤔
XRP is now back at the $1.75–$2 support zone and forming a fresh inverse head and shoulders pattern.
As long as this support holds, we’ll be on the lookout for new long opportunities. 🟢
For the bulls to take over in the short term, a break above the green neckline is needed.
And for long-term control, a break above the red structure is essential. 🔺
For now, we wait patiently! ⏳
📚 Always follow your trading plan regarding entry, risk management, and trade management.
Good luck!
All Strategies Are Good; If Managed Properly!
~Rich

EURUSD - Bears Are on the MoveHello TradingView Family / Fellow Traders. This is Richard, also known as theSignalyst.
📈EURUSD has been overall bearish trading within the falling wedge pattern marked in red. And it is currently retesting the upper bound of the wedge.
Moreover, the blue zone is a strong structure.
🏹 Thus, the highlighted red circle is a strong area to look for sell setups as it is the intersection of the upper red trendline and structure.
📚 As per my trading style:
As #EURUSD approaches the red circle zone, I will be looking for bearish reversal setups (like a double top pattern, trendline break , and so on...)
📚 Always follow your trading plan regarding entry, risk management, and trade management.
Good luck!
All Strategies Are Good; If Managed Properly!
~Rich
Disclosure: I am part of Trade Nation's Influencer program and receive a monthly fee for using their TradingView charts in my analysis.

EURUSD Below 1.1745 – Bearish Bias in PlayFX:EURUSD Technical Outlook
EURUSD maintains bearish momentum as long as the price remains below 1.1745, with a near-term target at 1.1684.
A confirmed breakout above 1.1745 would shift the trend to bullish, opening the path toward 1.1808 and 1.1883.
On the downside, a 1H or 4H candle close below 1.1684 would reinforce the bearish trend, likely extending losses toward 1.1627, and possibly 1.1557.
Support: 1.1684 / 1.1627 / 1.1557
Resistance: 1.1808 / 1.1883

DSYNC/USDT NEW INCREASE VOLUMEDSYNC/USDT NEW INCREASE VOLUME
New upcoming volume, that's what the trend data shows, we will follow this coin with updates by confirmations.

SPX500 Awaits Breakout as Trade Talks Fuel Market CautionWall Street Edges Up Amid Tariff Talks & Trade Turbulence
U.S. stock index inched higher on Wednesday as markets remain on edge over President Donald Trump's aggressive tariff stance and the ongoing negotiations with global trade partners. Traders are cautiously watching for clarity, with sentiment shifting quickly on any updates.
📉 SPX500 Technical Outlook
The index continues to consolidate within a narrow range between 6223 and 6246. A confirmed breakout from this zone is needed to define the next directional move.
A break below 6223 would confirm bearish continuation toward 6194, with potential extension to 6143.
A break above 6246 would shift the bias bullish, targeting 6282, followed by 6305.
Key Levels:
Support: 6223 / 6195 / 6143
Resistance: 6282 / 6305

GBPUSD - Macro Trend Continues!Hello TradingView Family / Fellow Traders. This is Richard, also known as theSignalyst.
📈GBPUSD has been overall bullish trading within the rising channel marked in red. And it is currently retesting the lower bound of the channel.
Moreover, the green zone is a strong structure.
🏹 Thus, the highlighted blue circle is a strong area to look for buy setups as it is the intersection of the lower red trendline and structure.
📚 As per my trading style:
As #GBPUSD approaches the blue circle zone, I will be looking for bullish reversal setups (like a double bottom pattern, trendline break , and so on...)
📚 Always follow your trading plan regarding entry, risk management, and trade management.
Good luck!
All Strategies Are Good; If Managed Properly!
~Rich
Disclosure: I am part of Trade Nation's Influencer program and receive a monthly fee for using their TradingView charts in my analysis.

BEAM FROM A NORMAL COIN TO A GOLDEN COIN SOON!! DUBBLE EFFECTThis is exactly what we expect, depending on the data that Beamx/USDT will show an interesting break since the new data.
when the real whale entering is started, we will see diffrance price movements ( not in a stable way as we see it now)
What is the expected target
up $0,001
There is an interesting update upcoming also that can give this coin an effect from a normal coin to a golden coin.
Every good increase and cycle movement takes time.
So let's see what time this expected update will take..

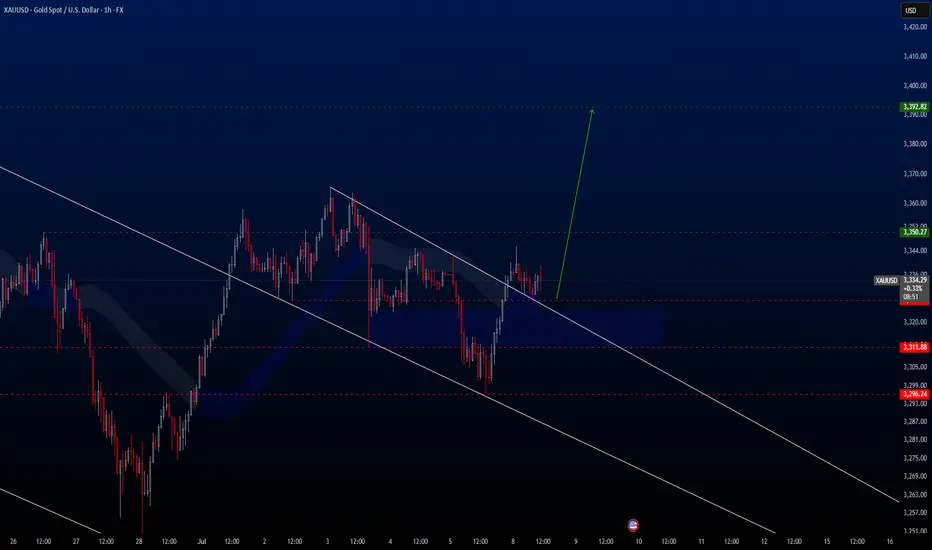
XAUUSD Hello traders,
Today we're taking advantage of a great buying opportunity on the XAUUSD pair. This setup is ideal for both medium- and long-term positions. I anticipate that the price will rise toward the 3392.82 USD level in the coming weeks.
That’s why I’ve positioned this trade as a medium-term opportunity.
BEAMX NEW DAY TRADE VOLUMEBEAMX NEW DAY TRADE VOLUME
If the trend gets confirmation, we will follow this update with a live follow.

SPX500 Holding Bullish Structure – Eyes on 6287 BreakoutSPX500
The price maintains bullish momentum as long as it remains above 6225 and 6246.
Currently, the market is approaching the 6287 resistance level. A confirmed 4H candle close above 6287 is required to validate continuation of the bullish trend toward 6325.
However, a rejection from 6287 may trigger a short-term bearish correction, with potential pullbacks toward 6246 and 6225.
A sustained break below 6225 would shift the momentum to the downside, targeting the 6143 support level.
Pivot Level: 6264
Resistance: 6287 – 6325
Support: 6246 – 6225 – 6143

MIGGLES/USDT THE BREAK RETURN TO THE MOONMIGGLES/USDT THE BREAK RETURN TO THE MOON
We are following with live data on this coin for the next volume trend, which can have a break in the coming time.
At this moment, this coin is showing signs of an increase. When it gets confirmed, we will follow it with live updates.

PRCL/USDT NEW INCREASE VOLUMEPRCL/USDT NEW INCREASE VOLUME
it shows new volume depending on the 1H volume. Since this unexpected volume, there isa new follow for this coin.

BTC - Bulls Getting Ready!!Hello TradingView Family / Fellow Traders. This is Richard, also known as theSignalyst.
📈BTC has been bullish trading within the flat rising wedge marked in blue and it is currently retesting the lower bound of the wedge.
Moreover, the orange zone is a strong demand.
🏹 Thus, the highlighted blue circle is a strong area to look for buy setups as it is the intersection of demand and lower blue trendline acting as a non-horizontal support.
📚 As per my trading style:
As #BTC approaches the blue circle zone, I will be looking for bullish reversal setups (like a double bottom pattern, trendline break , and so on...)
📚 Always follow your trading plan regarding entry, risk management, and trade management.
Good luck!
All Strategies Are Good; If Managed Properly!
~Rich
