USDCHF: Momentum into NY SessionKey Observations
This pair is starting off slow, but I'm expecting momentum to pick up during the New York session.
The daily chart is indicating an overall downtrend. Price is holding below both EMAs. However, the price action is a little bit weaker and the daily HTL isn't a significant level.
On the H1 timeframe, price is showing overlapping bars. I am hoping to see a stronger break to the downside as price crosses out of the EMA brand and accelerates.
Trend

GBPCAD: Price Supported Above Daily HTLKey Observations
Price is holding above the daily HTL, which is a good sign that this breakout is likely structural and there isn't much selling pressure (resistance)
On the H1 timeframe, price is also showing a similar characteristic. Price tried to trade below the EMA but could not.
Since price is accelerating to the upside once again, it's likely we'll be seeing trend continuation throughout the rest of the week.

EUR/USD - Outlook (LTF ranging market)🔥 EUR/USD Outlook Breakdown 🔥
Let’s decode this clean structure — multi-time-frame style with a punch of trader slang 👇
🧭 Weekly Timeframe
We’re chilling just under a long-term bearish resistance trend, and the last few weeks show clear compression beneath that line.
The weekly breakout candle couldn’t sustain upside, hinting sellers are still lurking.
Price holds under 1.1800, keeping HTF (higher-time-frame) structure bearish.
➡️ Eyes on the 1.1500–1.1450 zone as next liquidity grab if momentum kicks in.
📆 Daily Timeframe
Daily shows a ranging market between 1.1750 resistance and 1.1550 support.
We saw a BOS earlier in the structure, but bulls couldn’t follow through.
Multiple rejections from the supply block confirm short-term hesitation.
The support trendline is hanging on — but if it snaps, expect the cascade to begin.
Targets line up clean:
🎯 Target 1: 1.1400
🎯 Target 2: 1.1150
🎯 Target 3: 1.1000
⏰ 8H Timeframe
On the 8H, we’re playing ping-pong inside that same range.
Price grabbed the BSL (Buy-side Liquidity) up top and retraced to the mid-range demand.
Both BH zones are acting as intraday traps — classic indecision setup.
Until we break out clean, expect chop.
➡️ However… here’s the key line:
“HTF supports bearish price action although STF is currently ranging giving unclear direction. HTF will take control.”
That means we’re likely setting up for a fake bullish pop before a strong bearish drive, once HTF order flow dominates.
🎯 Trade Idea
Bias : Bearish (waiting for HTF dominance)
Setup : Sell the fake-out above range highs or on break & retest of 1.1550 support
Targets : 1.1400 → 1.1150 → 1.1000
Invalidation : Daily close above 1.1750
Gameplan : Stay patient — HTF flow will win.
⚡ Summary
EUR/USD is stuck in a rangey mess, but the bigger picture screams bearish.
When HTF takes back control, expect a breakdown toward 1.1400+ zones.
Shorts will be the move once that range floor cracks.

USD/CHF - Outlook Breakdown🔥 USD/CHF Outlook Breakdown 🔥
Let’s unpack this setup across the timeframes — clean and simple trader talk 👇
🧭 Wee kly Timeframe
Price is squeezing tight within a descending channel, holding under that key 0.8050–0.8100 supply zone.
We’ve seen multiple rejections there, confirming strong seller control.
Structure-wise, it’s still bearish — last week’s BOS (Break of Structure) sealed the lower bias.
➡️ Expect continuation lower unless we see a weekly candle close above 0.8050.
📆 Daily Timeframe
Price had a reaction from the second wave of supply, tapping into the daily zone around 0.8050 before rejecting.
The move broke minor daily structure to the downside, confirming bearish order flow.
We’re now hovering near a support shelf ~0.7920, but the context still favors shorts while below that daily zone.
➡️ Next clean liquidity pocket sits near 0.7820–0.7850.
⏰ 8H Timeframe
Here’s where the detail shines.
We’ve got a nice 5-wave internal structure forming:
(1) BOS confirming shift to bearish flow
(2) Pullback into 8H BH zone (premium area)
(3) Sweep of local SSL (liquidity grab)
(4) Retest of 71% fib zone (perfect premium fill)
(5) Targeting external HTF SSL (around 0.7820)
Currently retesting that mini 8H supply (0.7940–0.7960).
If it holds — 💣 expect the drop to continue towards 0.7820.
🎯 Trade Idea
Bias: Bearish
Sell Zone: 0.7940–0.7960 (retest of 8H supply / 71% fib)
Targets : 0.7850 → 0.7820
Invalidation: 0.8000 (clean break & close above)
Bonus Tip: Watch for a lower-TF liquidity sweep before short entries for cleaner confirmation.
⚠️ Summary
USD/CHF still sits in a tight bearish squeeze under strong higher-timeframe supply.
Until bulls reclaim 0.8050, the path of least resistance = downside.
Next major magnet: 0.7820 liquidity pool.

AUDUSD - Buy the dip at daily support!AUDUSD is still traveling inside a broader descending channel, but on the H1 we’ve carved a tight range/contracting structure.
Price is now approaching a daily support zone that aligns with the channel’s lower boundary and a local rising base—strong confluence for a bounce.
I’ll look for longs from the green support area after a clear H1 bullish reaction (wick rejections, bullish engulfing, or break–retest of the intraday lower-high line). If triggered, I’ll trail into the range highs first, then the upper orange boundary.
All Strategies Are Good; If Managed Properly!
~Richard Nasr.

Gold’s Golden Retest?Gold continues to trade within a rising blue channel, maintaining its overall bullish structure.
Currently, price is retesting the intersection between the lower blue trendline and the red structure zone, which has acted as strong support multiple times.
As long as this confluence area holds, I’ll be looking for trend-following longs targeting the upper boundary of the channel.
A break and close below this zone would temporarily pause the bullish momentum and open room for a deeper correction.
⚠️ Disclaimer: This is not financial advice. Always do your own research and manage risk properly.
📚 Stick to your trading plan regarding entries, risk, and management.
Good luck! 🍀
All Strategies Are Good; If Managed Properly!
~Richard Nasr

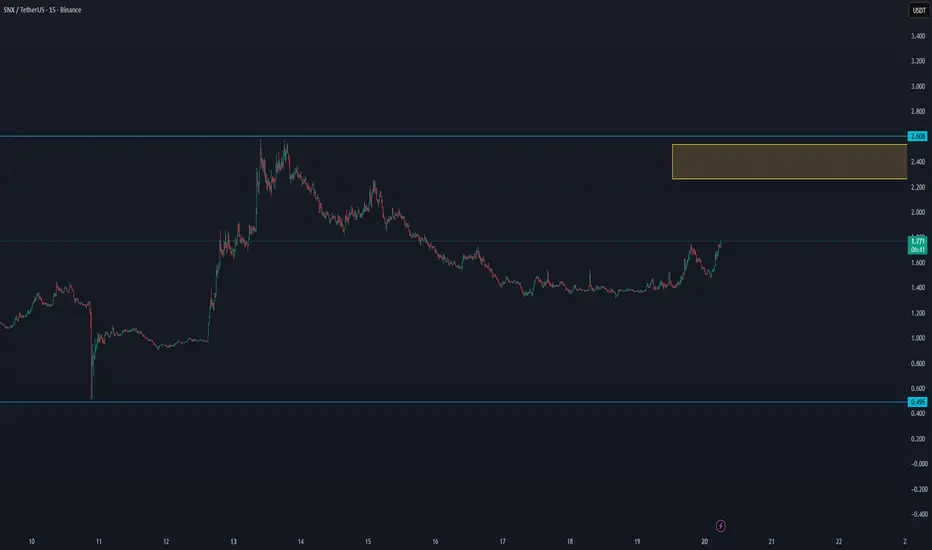
SNX/USDT INCREASE VOLUME On the lower time frames, SNX is showing signs of increasing volume, which could build up over time. For this reason, it’s worth watching SNX closely to see if the trend can break.
BTC/USDT — Volume Strength Returns, Eyes on 110K+ RecoveryBTC/USDT — Volume Strength Returns, Eyes on 110K+ Recovery 🚀
Bitcoin is showing renewed momentum as it re-enters the volume+ zone, signaling stronger market participation after recent consolidation. The move above the low time frame structure confirms short-term strength and suggests a potential continuation to the upside.
Currently, BTC is holding steady around $108.9K, maintaining support within the accumulation range. If momentum continues, a breakout toward $110K+ looks increasingly likely, aligning with short-term recovery signals.
📊 Technical Overview:
Volume Zone: $108K–$109K
Short-Term Target: $111K
Main Resistance: $122.5K
Bias: Positive momentum forming above low time frame
A strong hourly close above $109K would further confirm the shift in trend strength, potentially opening the next leg higher toward $111K–$122K.
📈 Outlook: Bullish short-term structure forming

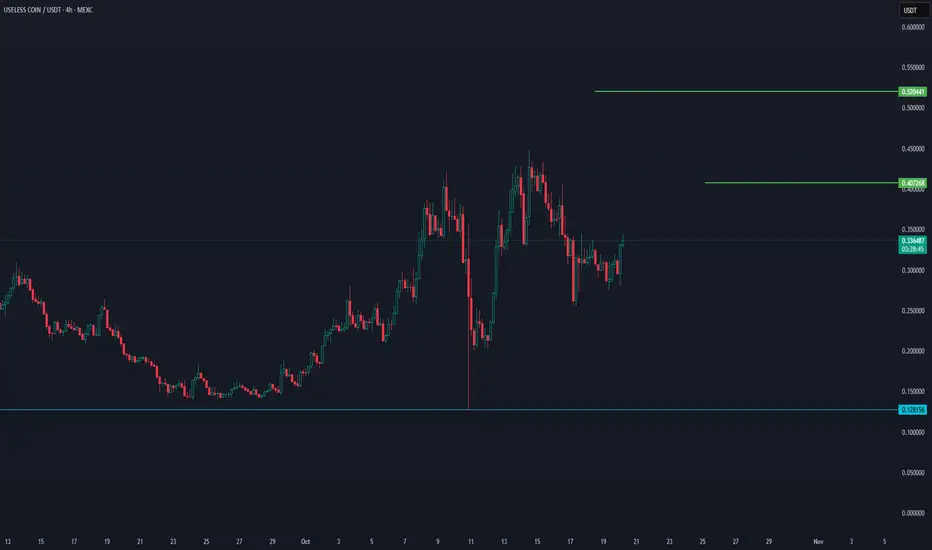
Useless Coin (USDT Pair) – 4H Chart Update📊 Useless Coin (USDT Pair) – 4H Chart Update
Current Price: $0.3424
Change (Last 4H): +3.6%
Volume: 456K
The price is currently attempting to recover from a recent downtrend, showing some short-term strength as it moves upward from the local support area.
🔹 Support Level: $0.128 – This remains the key bottom support and has held firmly in the previous correction.
🔹 Immediate Resistance: $0.407 – This is the first resistance to watch; a confirmed breakout above could trigger further bullish momentum.
🔹 Next Target Zone: $0.520 – This would be the next major resistance area if volume continues building and the current trend holds.
Market Structure:
The structure is neutral to slightly bullish — the market is forming higher lows, suggesting buyers are gradually stepping in.
However, there is still a lack of strong follow-through volume, which means the uptrend is not yet confirmed.
Summary:
Useless Coin shows early signs of a potential recovery with higher lows forming, but it remains in a consolidation phase. A close above $0.407 on strong volume would confirm a short-term bullish continuation toward the $0.52 level. Failure to hold above $0.30 could reopen the downside toward $0.20 or even $0.128.
THE RETURN OF BTC TO 110K ON WAY..There is high chance in the coming time we can see a BTC breakout return to 110K in the coming time. Today Sunday, can be an important day before the start of the weekly chart.
106K can become an important secure zone for the next increase in volume

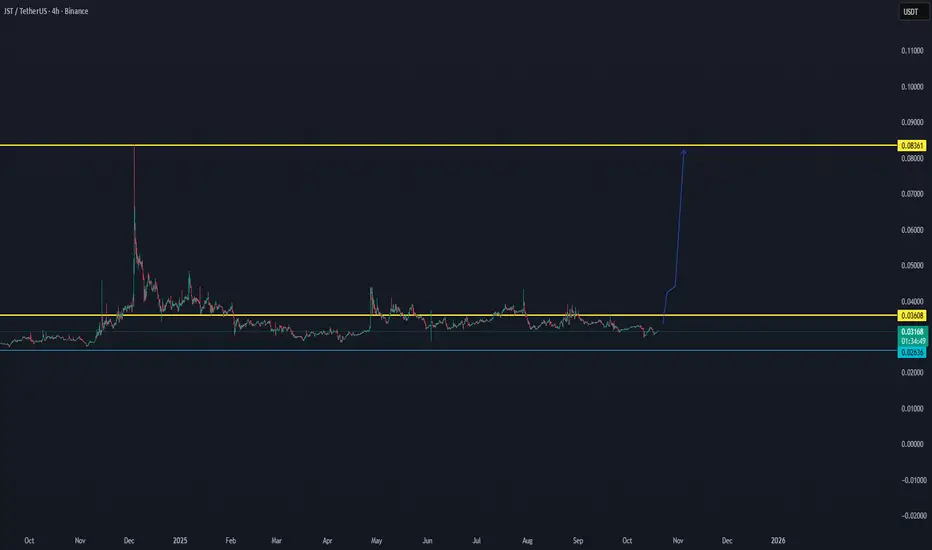
JST/USDT Second BREAKOUT ON WAY..Data view shows that there is a high chance JST can break out for the second time since the last volume data. We will follow these coming time frames to see what is able to do.
KMNO HOLDING THE MAIN TREND ON WAY TO NEW LEVEL..KMNO is still holding the important Maintrend, as long as this coin continues to do this, there is a high chance it will get a new increase in volume in the coming time frames.

AIA NEW INCREASE VOLUMEAfter the breakdown trend AIA can show in the coming time frames new building volume. To confirm this, we need to follow it for the coming 24H
EURJPY - Buy the gap, ride the trend!EURJPY remains overall bullish inside an ascending channel.
Price is pulling back toward a support zone that coincides with the lower channel trendline—a strong confluence where I’ll look for trend-following longs. The small gap overhead adds fuel for a potential snap-back if buyers step in.
I’ll wait for a bullish rejection (wick rejections, H4 bullish engulfing, or a break-retest back above the intraday lower highs) around 172.8–173.4 to enter.
As long as this intersection holds, I’ll target the mid-channel first, then the upper boundary near 176.5 and 178.0–178.8.
The plan is invalidated on a clean H4 close below 172.3 (under the zone and trendline), which would open a deeper correction before any new buy setup.
⚠️ Not financial advice. Do your own research and manage risk (position sizing, stops, partials).
All Strategies Are Good; If Managed Properly!
~Richard Nasr

AUDUSD: Weak DowntrendKey Observations:
Price is holding below the daily HTL, which gives me a bearish sentiment
The latest reaction from the daily HTL is a bit weaker, which gives me a small point of concern
This is going to be another attempt to trade the price acceleration from the EMA band to the downside
If price fails to make a significant low, I think it's safe to say that we'll see a reversal and stronger likelihood to the upside

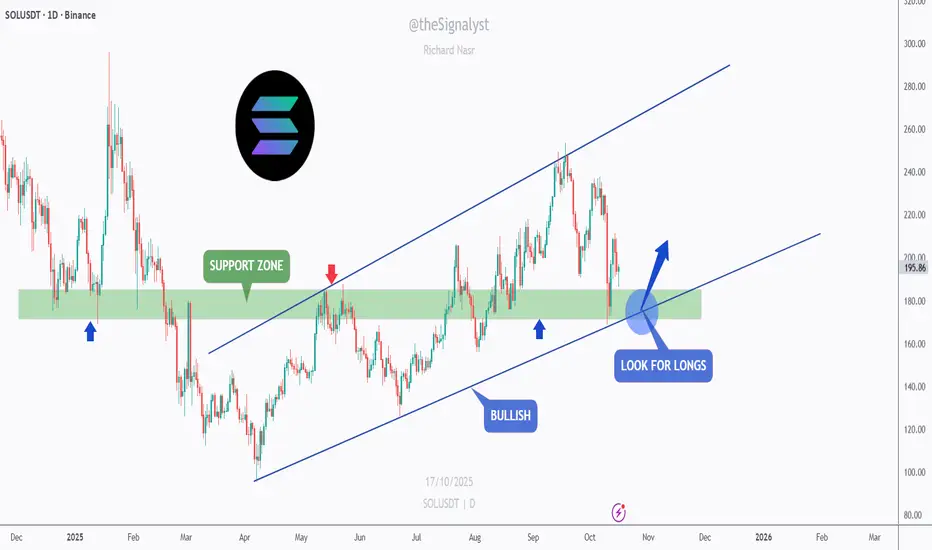
SOL - Buying the Retest Like a Sniper!SOL remains overall bullish , trading within a clean ascending channel and currently retesting the support zone that has acted as both resistance and support in the past.
This zone also aligns perfectly with the lower blue trendline, creating a strong area of confluence.
As long as this intersection holds, SOL is likely to rebound from here. I’ll be looking for bullish rejections or reversal patterns around the current zone to enter long positions, aiming for the next resistance levels near $230 and $260.
However, if the price breaks below the support zone, we could see a deeper correction before buyers regain control.
⚠️ Disclaimer: This is not financial advice. Always do your own research and manage risk properly.
📚 Stick to your trading plan regarding entries, risk, and management.
Good luck! 🍀
All Strategies Are Good; If Managed Properly!
~Richard Nasr
US30: Flash pump not enough to break resistanceSPREADEX:DJI Analysis – Weak flash pump signals a possible pullback ahead.
📊 Technical Overview
On the 30-minute timeframe, Wall Street (US30) has recently shown a quick rebound — a flash pump — after a strong flash dump earlier in the week. Price is now trading near the 46,400 – 46,500 area, right below the major resistance zone between 46,600 – 46,750 (highlighted in green).
Below, the support range around 46,050 – 46,200 (marked in red) remains the key demand area.
⚙️ Market Structure Insight
The recent flash pump recovered quickly from the previous drop, but the momentum appears insufficient to break through the prior flash dump zone. This imbalance often indicates a short-term exhaustion in buying pressure, meaning the market could need one more corrective leg before finding new strength.
🧭 Main Scenario
The most likely scenario is that price will move sideways or slightly pull back toward the 46,200 support zone before deciding its next major move.
• If buyers defend 46,200 successfully, the index could attempt another test of 46,700.
• However, failure to hold that support might open the door to a deeper correction.
💡 Personal View
The weak flash pump following the previous flash dump signals that the market is still in a consolidation and absorption phase. A short-term pullback could help reset momentum before a more sustainable trend emerges.
⛔ This analysis represents a personal technical perspective and should not be taken as investment advice. Always manage your risk before entering any position.
Please like and comment below to support our traders. Your reactions will motivate us to do more analysis in the future 🙏✨
Harry Andrew @ ZuperView

GBPCHF: Price Breach Daily HTLKey Observations
Daily Timeframe:
Price recently tested the daily HTL and made a weak reaction, indicating that buying strength at this level is very lackluster
H1 Timeframe:
Price is breaching the intraday ATL, signals counter-trend move is coming to an end and we're seeing confluence with the daily downtrend
Price is also accelerating away from the EMA band as another signal of momentum picking up

AUDUSD: Price Holds Below Daily HTLKey Observations
Daily Timeframe:
Price remains below HTL, which signals lack of strength to try and trade above it
Downside momentum is likely to pick up as price is below EMAs and EMA20 is threatening to cross back below EMA60
H1 Timeframe:
Price remains bearish as indicated by it's inability to trade above the EMA band and sustain that momentum
Price crossed back below the EMA band with a strong bearish candle so the entry is based on the current pullback move

THE MAIN TREND LEVEL IS THE REASON OF BREAKOUT BLESSWe previously identified the key main rend level, which is the reason for today’s breakout. We can learn a lot from this coin and apply the same analysis to other coins, such as Shell:USDT.
Since the breakout is a risk management.
Shell:USDT is our next follow which can show also a breakout soon

AUDUSD – Confluence Buy Zone!AUDUSD is currently testing a major support confluence zone, where the rising blue trendline, the green demand area, and the lower boundary of the short-term red falling channel intersect.
As long as price continues to hold above the 0.6450–0.6485 zone, the bullish outlook remains valid, and I’ll be looking for long opportunities from this area.
A rebound from this level could trigger a move toward 0.6560, followed by 0.6620–0.6670, aligning with the upper boundary of the broader channel.
However, a 4H close below 0.6425 would invalidate this bullish scenario and shift the focus toward the next support zone near 0.6380.
⚠️ Disclaimer: This is not financial advice. Always do your own research and manage risk properly.
📚 Stick to your trading plan regarding entries, risk, and management.
Good luck! 🍀
All Strategies Are Good; If Managed Properly!
~Richard Nasr

GBPUSD – Short SetupPrice is retesting a key resistance zone after a corrective bounce within a bearish trend. Sellers may step in if rejection confirms.
Sell Entry: 1.3340 – 1.3360
Stop Loss: 1.3380
Take Profit: 1.3250
📊 Bias: -Bearish
⚠️ Note: This analysis is for educational purposes only. Always confirm entries with your own strategy and manage risk accordingly.
#GBPUSD #Forex #PriceAction #SellSetup #TechnicalAnalysis

EUR/GBP - Multi time frame Analysis🔥 EUR/GBP — Fun but Deeper MTF Plan 🔥
Bias
Bullish across HTFs. Weekly + Daily demand stacked (0.8680–0.8700 riding on top of 0.8580–0.8620). Liquidity trendline above = magnet 🎯
Technical Breakdown
Weekly : Rising wedge grind, BOS history intact. As long as 0.8580 holds, topside liquidity at 0.8780–0.8800 is the draw.
Daily : Fresh reaction from 0.8680–0.8700 demand; higher-low structure pointing to 0.8750–0.8770 first stop.
1H : Sweep → MSS over 50EMA. Grey 1H POI 0.8690–0.8705 = sweet dip zone. If deeper, last defensive line is 0.8680 (daily base).
Execution (Scenarios)
A) Quick tag & go (primary):
Buy 0.8690–0.8705 → TP1 0.8745, TP2 0.8758, TP3 0.8775–0.8785 (liquidity sweep).
SL: 0.8672 (clean under daily base). R:R ≈ 1:2–1:3.
B) Deeper discount (secondary):
If we flush the POI, watch 0.8680–0.8688 for a wick + reclaim → same targets.
SL: 0.8665.
Risk Management
Risk 0.5–1% per idea. Scale out 30/40/30 at TP1/TP2/TP3.
If 1H closes below 0.8680, step aside—bull script broken short-term.
No chasing above 0.8750; wait for a pullback or a clean breakout-retest.
Trader Checklist ✅
HTF bias aligns? ✔️
Price into 1H POI or daily base? ✔️
M5/M15 shift back to bullish on entry? ✔️
Spread/news clean? ✔️
Then send it 🚀
