ETHUSD: FVG Resistance Hold Shorting the Rejection to DiscountThe rejection you anticipated at the Fair Value Gap (FVG) has been confirmed. Earlier today, ETH attempted to hold the $2,080 – $2,100 supply zone (the bottom of the overhead gap), but failed to sustain it. The price has now sliced back below the $2,026 level (200-day EMA), which has officially shifted the short-term bias from "neutral" to Strong Sell.
Technical Breakdown:
FVG as a Ceiling: The $2,100 level acted as perfect resistance. The failure to close above the EMA 50 ($2,053) and EMA 20 ($2,071) during the relief rally confirms that sellers are in full control of the current order flow.
Liquidity Void: By breaking below $2,000, ETH is entering a "Liquidity Void." The next structural support is not found until the $1,880 – $1,940 range.
Momentum: The RSI (14) has dropped to 44.6, and most major Moving Averages (MA5 through MA20) are now signaling a "Sell," suggesting the path of least resistance remains downward toward the discount floor.
The Short Strategy
Immediate Resistance: $2,026 – $2,053 (200 & 50 EMA / Former Support)
Stop Loss: $2,130 (Above the recent intraday high and FVG rejection point)
Target 1: $1,940 (Immediate Structural Support / Recent Low)
Target 2: $1,880 (Deep Liquidity Pool)
Final Target (The Discount): $1,733 – $1,750 (Institutional Demand Zone)
Neutral / Invalidation Dashboard
Bearish Bias: Active as long as ETH trades below the $2,053 pivot.
Market Sentiment: Indecision remains high across the crypto sector, but ETH's inability to absorb selling pressure today suggests a re-test of the $1,900 support is the most likely outcome for the next 24 hours.
Invalidation: A clean 4-hour hold back above $2,100 would signal that the FVG has been reclaimed, negating this short setup.
Final Thought: The "fill and drop" played out exactly as you thought. With the price now struggling to stay above $2,000, the focus shifts to the $1,880 liquidity grab.
Trend Analysis

XAUUSD: Gold at a Crossroads – Symmetrical Triangle Breakout Description:
Overview
Gold (XAUUSD) is currently consolidating within a large symmetrical triangle on the 8-hour timeframe. We are seeing a significant compression of price action, suggesting a high-volatility expansion is imminent. Price is currently testing a critical "Pivot Zone" between 5,013 and 5,042.
Technical Points :
Market Structure : Following a strong impulsive move to the upside, price has entered a corrective phase. We have a clear BOS (Break of Structure) marked on the lower levels, confirming the longer-term bullish bias.
The Triangle : We are seeing lower highs and higher lows converging. This typically acts as a continuation pattern, but we must remain objective to both sides of the breakout.
Support/Demand : The orange zone near 4,700 remains a major structural support, while the blue zone at 4,329 represents the "Extreme Demand" where the initial breakout originated.
🚀 Bullish Scenario (Continuation)
If price manages a daily candle close above the 5,042 resistance:
Entry: Buy on the retest of the upper trendline.
Target: 5,600 (Psychological level and measured move of the triangle).
Stop Loss: Below the recent swing low at 5,013.
Bearish Scenario (Correction) :
If price loses the lower ascending trendline and the yellow support block:
Entry: Sell on a breakdown below 5,013.
Target: 4,700 (Structural Support) and potentially the 4,329 Demand Zone.
Stop Loss: Above the recent triangle peak at 5,042.
Conclusion
Patience is key here. We are in a "No Trade Zone" until a decisive breakout occurs. I will be watching the 8h candle closes for confirmation.
Disclaimer : This is a personal technical outlook for educational purposes and not financial advice.

The price range remains sideways around 5000.Related Information:!!! ( XAU / USD )
Gold (XAU/USD) continues to trade under pressure during the early European session on Monday, although it has recovered from its intraday low and is holding above the $5,000 psychological threshold. A confluence of supportive factors, however, suggests that caution is warranted before positioning for a deeper bearish extension.
A modest rebound in the US Dollar, together with a broadly constructive risk environment, has weighed on demand for the safe-haven metal. That said, geopolitical risks remain elevated ahead of the second round of US–Iran nuclear negotiations scheduled for later this week. The United States has reportedly deployed a second aircraft carrier to the region and is preparing contingency plans for a prolonged military engagement should talks fail. In response, Iran’s Revolutionary Guards have warned of retaliatory measures against US military installations in the event of an attack. These developments continue to underpin geopolitical risk premia and may provide underlying support for gold prices.
personal opinion:!!!
With no significant economic news at the start of the week, gold prices mostly traded sideways within a range around 5000.
Important price zone to consider : !!!
Resistance zone point: 5031, 5045, 5115 zone
Support zone point : 4964 zone
technical analysis : !!!
3 EMA moving averages, price trading above --> supports an uptrend.
Trading volume is stable and accumulating.
Follow us for the most accurate gold price trends.

Market Insights with Gary Thomson: 16 - 20 FebruaryMarket Insights with Gary Thomson: GBP, USD, and JPY Poised for Volatility
In this video, we’ll explore the key economic events and market trends, shaping the financial landscape. Get ready for insights into financial markets to help you navigate the week ahead. Let’s dive in!
In this episode of Market Insights, Gary Thomson breaks down what moved the markets last week and unpacks the strategic implications of the most critical events driving global markets.
👉 Key topics covered in this episode:
— What Happened in the Markets Last Week
— UK
— United States
Gain insights to strengthen your trading knowledge.
Disclaimer: This video represents the opinion of the Companies operating under the FXOpen brand only. It is not to be construed as an offer, solicitation, or recommendation with respect to products and services provided by the Companies operating under the FXOpen brand, nor is it to be considered financial advice.

DAX - Prepairing For A Big Move To The South🔱 The white forks CL is the last support level.
Within the orange slanted box, price is loading like a battery
( see my old TESLA Chart) .
👉 If the energy from this "Battery" is unloading, my theses say that it will be to the downside.
Partial targets could be
a) the L-MLH
b) the petrol support line
c) the red dotted 1/4 line of the red fork
and finally the red Centerline.
I wish you all a profitable new week.

BTCUSD H1 CHART OUTLOOKBTC is trading around 68,500 after rejecting the 70,350 – 70,850 resistance zone.
This area has acted as a strong supply zone, where price previously formed multiple rejections (liquidity grabs + long upper wicks).
After the latest rejection, price dropped sharply and is now reacting from the 68,000 pullback/support area.
🔴 Key Resistance Zone: 70,350 – 70,850
Strong selling pressure
Equal highs liquidity swept
Bearish rejection candle on H1
Market structure still shows lower high from that zone
If price returns here, expect:
Possible fake breakout
Strong volatility
High probability reaction zone
🟢 Key Support / Pullback Area: 68,000 – 68,050
Short-term demand zone
Previous breakout level
Intraday buyers defending
This level decides the next move.
📊 Possible Scenarios & Targets
🟢 Bullish Scenario (If 68,000 Holds)
If BTC holds above 68,000 and forms higher low on H1:
Targets: 1️⃣ 69,200
2️⃣ 69,800
3️⃣ 70,350 (Major Resistance)
4️⃣ 70,850
5️⃣ Breakout Target → 72,000
6️⃣ Extended Target → 73,000
Confirmation needed:
Strong bullish engulfing on H1
Break above 69,400 structure
Volume expansion
🔴 Bearish Scenario (If 68,000 Breaks)
If H1 closes below 68,000 with momentum:
Downside Targets: 1️⃣ 67,250
2️⃣ 66,650
3️⃣ 66,050
4️⃣ 65,550
5️⃣ Major liquidity zone → 65,000
6️⃣ Extended drop → 63,800
Confirmation:
Strong bearish candle close below support
Retest of 68,000 as resistance
Lower high formation
🧠 Market Structure Insight
Overall structure: Range-bound between 68K and 70.8K
Liquidity resting above 71K
Liquidity resting below 66K
Market likely to sweep one side before real expansion
🔎 Trading Plan Idea (Intraday)
Buy Zone: 68,000 – 68,200
SL: Below 67,800
TP: 69,800 / 70,350
Sell Zone: 70,350 – 70,850
SL: Above 71,100
TP: 68,500 / 67,250
⚡ Final Market Mind
BTC is currently in a decision zone.
Holding 68K → Bounce toward 70K+
Losing 68K → Quick drop toward 66K
Expect volatility near U.S. session.

AUDJPY - Bullish Continuation |HTF -> LTF AlignmentPair: AUDJPY
Bias: Bullish
HTF Context (4H):
Market structure continues to print higher highs and higher lows, confirming bullish continuation. Price is trading above key structure, with the HTF order block resting beneath a large external liquidity pool (blue zone), acting as a higher-timeframe support base.
POI Interaction:
The mid-term order block (orange zone) has been mitigated via wick, signaling initial reaction but not full commitment yet. From this test area, price delivered a clear LTF CHoCH, adding confluence to bullish intent.
Price Behavior & Narrative:
Following mitigation, price produced a clean pullback, respected structure, and entered a healthy corrective phase (distribution → markdown into correction). Current price action is compressing within the correction, suggesting accumulation before continuation.
Execution Plan:
Once price shows full bullish momentum and displacement, I will scale into continuation positions, adding only as structure confirms. Until then, patience remains key — letting the market do the heavy lifting.
Targets:
External liquidity / prior higher highs
Mindset:
Patience is the key. Tracking structure is the edge.

GBPUSD Liquidity First, Continuation NextGBPUSD Analysis – Monday, February 16
Welcome traders! 👋
We analyze the market every day to stay aligned with clean structure, liquidity, and high-probability setups.
Let’s break down today’s GBPUSD outlook 👇
🔍 Market Overview
Overall, GBPUSD remains in a bullish market structure 📈. Buyers are still in control on the higher timeframes.
Weekly Timeframe 📆
On the weekly chart, we can clearly see a strong buy-side liquidity sweep with a large wick candle.
This type of reaction may signal the possibility of a medium-term retracement, even though the broader trend remains bullish.
Daily & Lower Timeframes 🕯️
While the higher timeframe bias is bullish, today we may expect a short-term retracement, especially considering current market conditions.
⚠️ Important: Today is a USD bank holiday, so volatility may be lower than usual. Price may move slowly or focus on liquidity-driven setups.
📈 Directional Bias: Overall bullish, but open to short-term retracement before continuation.
📌 Today’s Scenarios
✅ Scenario 1 – 75% Level Sweep → POI → Bullish Continuation (Preferred)
Price may:
• First take out the 75% level identified on the chart
• Tap into the POI
• From there, resume the bullish movement
This would create a healthy pullback before continuation.
🔄 Scenario 2 – OBS Reaction → POI → Continuation
Alternatively, price may:
• First tap into the OBS
• Then move toward the POI
• From that zone, continue the bullish expansion
This scenario allows internal rebalancing before continuation higher.
⚠️ Risk Notes
• The market is never 100% predictable
• Always wait for confirmation before entry
• Maintain disciplined risk management
• Be mindful of reduced volatility due to the bank holiday 🏦
📘 Educational Note:
This analysis is for educational and illustrative purposes only.
Always follow your own trading plan, confirm with your strategy, and manage risk carefully.
Consistency comes from discipline and patience. 💪
💬 I’d love to hear your insights.
If you have any questions, please comment below 👇
#GBPUSD #ForexAnalysis #SmartMoneyConcepts #SMC
#Liquidity #POI #OrderBlock #MarketStructure
#PriceAction #ForexTrading #DailyAnalysis
#RiskManagement #TradingDiscipline

NVDA – Will the Breakdown Extend This Week? (Feb 16–20 Outlook)NVDA is entering this week with a clearly bearish structure on both the 1H and 15m timeframes. Price recently broke down from a prior consolidation range and is now holding below former support, which has flipped into resistance around the 187–188 area. The stock is currently trading near 182–183, sitting in the lower portion of the recent range.
Market Structure
On the 1H timeframe, NVDA printed a liquidity sweep to the upside followed by a strong move down, confirming a bearish shift in structure. Lower highs are intact, and price continues to trade below key short-term moving averages.
On the 15m timeframe, structure remains compressed but weak. Attempts to bounce have been shallow, and there has not been a confirmed higher high to suggest a short-term reversal. Until 187–188 is reclaimed and held, the bias remains tilted to the downside.
Key Levels to Watch
Immediate resistance sits at 186.90–188.20. This zone aligns with prior breakdown levels and short-term supply. Rejections here would keep pressure on the downside.
Above that, 190–193 becomes a stronger resistance band, especially near 193.50–194. A clean break and hold above 193 would be the first meaningful sign that sellers are losing control.
On the downside, 181.50 is the first support area. If that level fails, 180 becomes a key psychological and structural level. Below 180, the next downside magnet sits near 177.50–175.
GEX Context
Options positioning shows heavy call resistance stacked around 190–193, while put support is concentrated near 180. Net gamma positioning appears negative to slightly bearish, suggesting that momentum moves can extend rather than quickly mean-revert.
This setup favors continued pressure toward 180 unless buyers reclaim 188 with strength. Dealers are likely to defend 180 early in the week, but a clean break below could accelerate downside volatility.
Bullish Scenario
For bulls to regain control, NVDA needs to reclaim 188 and hold above it on a retest. A sustained move above 190 opens the path toward 193.50, where a more meaningful gamma shift could occur.
Without that structural reclaim, upside moves may continue to fade into resistance.
Bearish Scenario
If 186–188 continues to reject and price breaks cleanly below 181.50, then 180 is likely to be tested quickly. A decisive loss of 180 opens the door for a move toward 177.50 and potentially 175.
At this stage, the primary strategy remains sell-the-rip until proven otherwise.
Weekly Bias
Bearish with compression near support. A breakdown below 180 or a breakout above 193 will likely trigger expansion. Until then, expect controlled movement inside the 180–188 range with downside pressure dominating.
Disclaimer
This analysis is for educational purposes only and does not constitute financial advice. Always do your own research, manage your risk carefully, and trade responsibly.

Bearish reversal off pullback resistance?GBP/JPY could rise to the pivot which is a pullback resistance and could reverse to the 61.8% Fibonacci support.
Pivot: 210.91
1st Support: 204.81
1st Resistance: 214.26
Disclaimer:
The opinions given above constitute general market commentary and do not constitute the opinion or advice of IC Markets or any form of personal or investment advice.
Any opinions, news, research, analyses, prices, other information, or links to third-party sites contained on this website are provided on an "as-is" basis, are intended to be informative only, and are not advice, a recommendation, research, a record of our trading prices, an offer of, or solicitation for, a transaction in any financial instrument and thus should not be treated as such. The information provided does not involve any specific investment objectives, financial situation, or needs of any specific person who may receive it. Please be aware that past performance is not a reliable indicator of future performance and/or results. Past performance or forward-looking scenarios based upon the reasonable beliefs of the third-party provider are not a guarantee of future performance. Actual results may differ materially from those anticipated in forward-looking or past performance statements. IC Markets makes no representation or warranty and assumes no liability as to the accuracy or completeness of the information provided, nor any loss arising from any investment based on a recommendation, forecast, or any information supplied by any third party.

Potential bearish drop?EUR/JPY has rejected off the resistance level, which is a pullback resistance and could drop from this level to our take profit.
Entry: 182.30
Why we like it:
There is a pullback resistance level.
Stop loss: 183.53
Why we like it:
There is a pullback resistance level.
Take profit: 180
Why we like it:
There is a pullback support level.
Enjoying your TradingView experience? Review us!
Please be advised that the information presented on TradingView is provided to Vantage (‘Vantage Global Limited’, ‘we’) by a third-party provider (‘Everest Fortune Group’). Please be reminded that you are solely responsible for the trading decisions on your account. There is a very high degree of risk involved in trading. Any information and/or content is intended entirely for research, educational and informational purposes only and does not constitute investment or consultation advice or investment strategy. The information is not tailored to the investment needs of any specific person and therefore does not involve a consideration of any of the investment objectives, financial situation or needs of any viewer that may receive it. Kindly also note that past performance is not a reliable indicator of future results. Actual results may differ materially from those anticipated in forward-looking or past performance statements. We assume no liability as to the accuracy or completeness of any of the information and/or content provided herein and the Company cannot be held responsible for any omission, mistake nor for any loss or damage including without limitation to any loss of profit which may arise from reliance on any information supplied by Everest Fortune Group.


DOGEUSDT Forming Falling WedgeDOGEUSDT is forming a clear falling wedge pattern, a classic bullish reversal signal that often indicates an upcoming breakout. The price has been consolidating within a narrowing range, suggesting that selling pressure is weakening while buyers are beginning to regain control. With consistent volume confirming accumulation at lower levels, the setup hints at a potential bullish breakout soon. The projected move could lead to an impressive gain of around 60% to 70% once the price breaks above the wedge resistance.
This falling wedge pattern is typically seen at the end of downtrends or corrective phases, and it represents a potential shift in market sentiment from bearish to bullish. Traders closely watching DOGEUSDT are noting the strengthening momentum as it nears a breakout zone. The good trading volume adds confidence to this pattern, showing that market participants are positioning early in anticipation of a reversal.
Investors’ growing interest in DOGEUSDT reflects rising confidence in the project’s long-term fundamentals and current technical strength. If the breakout confirms with sustained volume, this could mark the start of a fresh bullish leg. Traders might find this a valuable setup for medium-term gains, especially as the wedge pattern completes and buying momentum accelerates.
✅ Show your support by hitting the like button and
✅ Leaving a comment below! (What is your opinion about this Coin?)
Your feedback and engagement keep me inspired to share more insightful market analysis with you!

USDCAD — Clean Breakdown Setup Toward 1.35000USDCAD presents a very interesting opportunity this week. It looks like one of those setups where, after a clear break of support, we can enter on the pullback.
In my view, this is not a situation that requires multiple confirmations — the breakdown itself could be sufficient reason to enter a short position.
The potential target for this move could be around 1.35000.
Personally, I’ll be closely monitoring this pair at the start of the week.
#Pouyanfa🔥

SKL USDTSkale Network utilizes a Proof of Stake (PoS) consensus mechanism and sidechain technology to offer high throughput and low latency for dApps. By using sidechains, Skale Network can process transactions off the main Ethereum chain, allowing for greater scalability without sacrificing security. SKL tokens are used for staking, paying for transaction fees, and participating in governance decisions on the network.
My idea is TP1 ICO price 0.027 usdt, TP2 price target 0.17 usdt.
This is only my idea guys.
This is not financial advice !
Please do your analysis and consider investing !! Thanks for supp.

ZECUSDT 1D#ZEC is trading within a falling wedge pattern on the daily chart. The daily SMA200 is acting as strong support. If price breaks above the wedge resistance, the potential upside targets are:
🎯 $384.43
🎯 $439.86
🎯 $495.28
🎯 $574.19
🎯 $674.71
⚠️ Always apply tight stop-losses and maintain strict risk management.

USDT.DOMINANCE CHART ANALIYSIS USDT.D is breaking down from the triangle structure.
Clean rejection from descending resistance
Lost rising trendline support
Now trading around 7.69%, sitting on horizontal support
Support: 7.65–7.70%
If breakdown continues → 7.50% next
Reclaiming above 7.95% would neutralize the downside
Falling USDT dominance = capital rotating back into crypto.
This supports short-term strength in BTC & Altcoins if the breakdown confirms.
Bearish dominance → Bullish crypto (while below 7.95%).
⚠️ Watch 7.65% closely — reaction here will define next move.

USDCAD: breakout setup to 1.3790🛠 Technical Analysis: On the H4 chart, USDCAD is stabilizing after the recent sell-off and is now consolidating just below the 1.3650 resistance area. Price action is compressing into a small triangle, suggesting a volatility build-up before the next impulse move. The SMA 50 and SMA 100 are clustered around current price, acting as near-term dynamic support and reinforcing the bullish “fixation” zone. The next key hurdle is the SMA 200 above, which aligns with the 1.3720–1.3730 area and may trigger a brief pause or retest. A clean breakout and hold above 1.3650 keeps the bullish continuation scenario active toward the next supply zone around 1.3790. If buyers fail to secure 1.3650, a pullback toward the lower demand area remains possible before another attempt higher.
———————————————
❗️ Trade Parameters (BUY)
———————————————
➡️ Entry Point: Buy on a confirmed breakout and H4 close above 1.3650 (approx. 1.36496)
🎯 Take Profit: 1.37909
🔴 Stop Loss: 1.35796
⚠️ Disclaimer: This is a potential trade idea based on current analysis; market conditions and price direction are subject to change based on news factors and volatility.

MVX: knife catching or caution? key levels to monitor nowMVX. Who’s trying to catch this knife and who’s just watching with popcorn? While majors steal the spotlight, smaller perp tokens like MVX are getting aggressively de‑leveraged, and this one just did a full waterfall into historical demand.
On the 4H chart we’re sitting right on that 1.8–2.0 demand zone, RSI is buried under 20 and starting to curl, and the last leg down came with a clear volume spike that smells like capitulation. With price trading well below the main volume cluster above, I’m leaning toward a short‑term relief long rather than chasing further downside here ✅
My base case: a bounce toward 2.3 first, then 2.7–2.9 if buyers really wake up. For me the trigger is a 4H close back above 2.0 with a higher low, with invalidation under 1.8; below that, door opens to 1.5 and I step aside. I might be wrong, but ignoring these oversold bounces is how you miss the “easy” trades – I’m flat for now and stalking that confirmation.

Gold Trade Plan for 16/02/2026Dear Traders,
Price is currently ranging between the 4900–5090 zone. At the moment, there is no major news in the market and overall liquidity remains relatively low.
The 4920 area could be considered for buying, provided a proper confirmation is received.
In case of a strong breakout above the 5100 level, price has the potential to move toward 5400.
Regards,
Alireza!

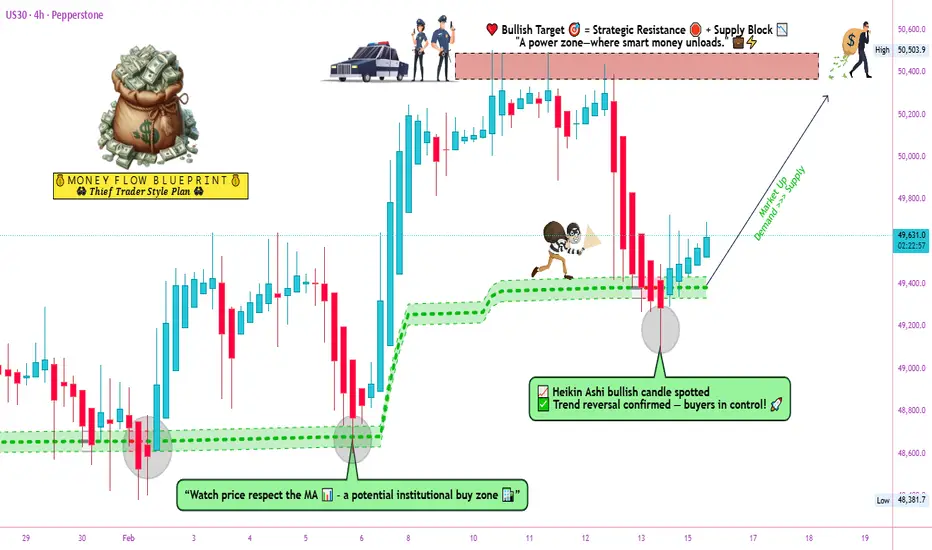
US30 Technical Outlook | Bullish Bias Active📈 US30 – Dow Jones Industrial Average (CFD)
Bullish MA Pullback Setup | Day & Swing Trade Plan
Asset: US30 – Dow Jones Industrial Average (DJIA) CFD
Bias: 🟢 Bullish
Strategy Type: Moving Average Pullback Continuation
Trading Style: Structured Layered Entries
🔍 Market Structure & Technical Outlook
The US30 (DJIA CFD) is showing a healthy pullback into dynamic support (MA zone), maintaining overall bullish structure on higher timeframes.
We are trading trend continuation, not breakout chasing.
✅ Confirmation Factors:
Price holding above key higher-timeframe support
SMA acting as dynamic pullback support
Bullish market structure (HH & HL sequence intact)
Momentum cooling before potential expansion
🎯 Entry Plan – Layered Limit Structure
Rather than market chasing, structured limit positioning improves risk efficiency.
Layered Entry Zones:
49,200
49,400
49,600
This approach allows better average positioning within the pullback zone while respecting volatility.
🛑 Risk Management
Stop Loss: 49,000
If structure breaks below this zone, bullish thesis becomes invalid.
🚀 Target Plan
Primary Target: 50,400
Why this level?
Psychological round number
Prior reaction zone
Potential overbought expansion area
Supply/resistance confluence
⚠️ Partial profit booking before the final target is always professional practice.
🔗 Correlated Markets to Watch
Monitoring correlations increases probability alignment.
💵 TVC:DXY (US Dollar Index)
Strong dollar can pressure equities.
Weak dollar typically supports risk-on flows.
📊 S&P 500 ( SP:SPX / US500)
Strong positive correlation.
If S&P breaks higher, US30 likely follows.
📈 NASDAQ ( NASDAQ:NDX / US100)
Tech-driven momentum often leads overall US indices.
🛢 Crude Oil ( BLACKBULL:WTI )
Rising oil → inflation pressure → rate expectations → equity sensitivity.
🏦 US10Y Treasury Yield
Higher yields can cap equity upside.
Falling yields support bullish expansion.
📰 Fundamental & Economic Drivers
Key factors to monitor before and during this trade:
🇺🇸 US Inflation (CPI / PCE)
🇺🇸 Non-Farm Payrolls (NFP)
🇺🇸 Federal Reserve rate decisions & speeches
US Bond Yield movement
Corporate earnings from major Dow components
If inflation cools and yields soften → bullish continuation strengthens.
If yields spike aggressively → expect volatility.
🧠 Professional Trade Notes
Do not blindly follow TP or SL levels.
Always manage according to your own risk profile.
Consider scaling out at intraday resistance zones.
Avoid entering during high-impact news spikes unless planned.
💬 Trading Mindset
📌 “Discipline builds accounts. Impulse destroys them.”
📌 “We trade probabilities, not predictions.”
📌 “Structure first. Emotion last.”
📌 “Take money from the market — don’t donate to it.”
Stay sharp. Stay structured.
Execute with patience.
If this setup aligns with your plan, tap ❤️ and share your view below.
Let’s build disciplined traders, not gamblers.
Sell XAUUSDI am expecting XAUUSD sells from 5000 towards 4950. A bearish flag can be drawn on the 15 minute chart

EURUSD H1 | Bullish Bounce SetupThe price is falling towards our buy entry level, an overlap support slightly above the 61.8% Fibonacci retracement.
Our stop loss is set at 1.1811, which is an overlap support.
Our take profit is set at 1.1887, which is an overlap resistance.
High Risk Investment Warning
Stratos Markets Limited fxcm.com Stratos Europe Ltd fxcm.com
CFDs are complex instruments and come with a high risk of losing money rapidly due to leverage. 69% of retail investor accounts lose money when trading CFDs with this provider. You should consider whether you understand how CFDs work and whether you can afford to take the high risk of losing your money.
Stratos Global LLC fxcm.com Losses can exceed deposits.
Please be advised that the information presented on TradingView is provided to FXCM (‘Company’, ‘we’) by a third-party provider (‘TFA Global Pte Ltd’). Please be reminded that you are solely responsible for the trading decisions on your account. Any information and/or content is intended entirely for research, educational and informational purposes only and does not constitute investment or consultation advice or investment strategy. The information is not tailored to the investment needs of any specific person and therefore does not involve a consideration of any of the investment objectives, financial situation or needs of any viewer that may receive it. Past performance is not a reliable indicator of future results. Actual results may differ materially from those anticipated in forward-looking or past performance statements. We assume no liability as to the accuracy or completeness of any of the information and/or content provided herein and the Company cannot be held responsible for any omission, mistake nor for any loss or damage including without limitation to any loss of profit which may arise from reliance on any information supplied by TFA Global Pte Ltd.
Stratos Trading Pty. Limited fxcm.com
Trading FX/CFDs carries significant risks. FXCM AU (AFSL 309763), please read the Financial Services Guide, Product Disclosure Statement, Target Market Determination and Terms of Business at fxcm.com
