XAU/USD:Rejection at $5,115 Supply The Slide to Discount SupportThe price is currently showing signs of directional uncertainty, characterized by a spinning top formation on the daily chart. After an attempt to fill the overhead imbalance, gold was met with a "Bearish Belt Hold" pattern in the $4,996 – $5,052 range, signaling that sellers are defending the area aggressively. With capital outflows (declining MFI) and a neutral-to-downward RSI, the path of least resistance points toward the lower liquidity pools.
Technical Evidence for the Short:
FVG Resistance Hold: The $5,090 – $5,145 zone remains a fortress for bears. A sustained failure to break above $5,113 keeps the "Rising Wedge" breakdown in play.
Institutional Selling: VWAP and major moving averages are currently sitting above the market price, confirming institutional pressure is capping any relief rallies.
Liquidity Magnet: The next major Discount Zone is clustered around $4,800 – $4,862, which aligns with a significant technical base and a V-shaped rebound anchor.
External Pressure: Upbeat inflation data has spurred rate-cut bets, but until a decisive breakout above $5,100 occurs, the market remains trapped in a corrective phase.
Neutral / Invalidation Dashboard
Bearish Bias: Dominant as long as the price stays below the $5,050 supply level.
Neutral Zone: $4,990 – $5,050 (Intraday chop area due to light holiday volume).
Invalidation: A breakout and volume-supported close above $5,145 would negate the short bias and aim for $5,431.
Final Thought: The "fill and drop" is well underway. Gold is "well squeezed" and a break below $4,985 would likely trigger an impulsive drop toward the $4,800 discount level.
Trend Analysis
Gold (xauusd): Triangle Breakdown, Pullback Then ContinuationHi!
Market Context
Gold is showing early weakness after breaking the lower boundary of the triangle structure. The previous dynamic support (trendline) is now acting as resistance, which usually signals a shift in short-term momentum.
Structure & Key Signals
Triangle bottom trendline → Broken
Retest attempt → Weak reaction
Lower high formation → Bearish pressure building
Scenario Outlook
Price may attempt a small pullback toward the broken structure, but as long as price stays below the supply zone and trendline, downside remains the higher-probability path.
Target Zones 🎯
First downside target: 4,880 – 4,850
Main target (as marked): ≈ 4,805 support zone
Invalidation
Sustained reclaim above the supply zone and trendline would weaken the bearish setup.
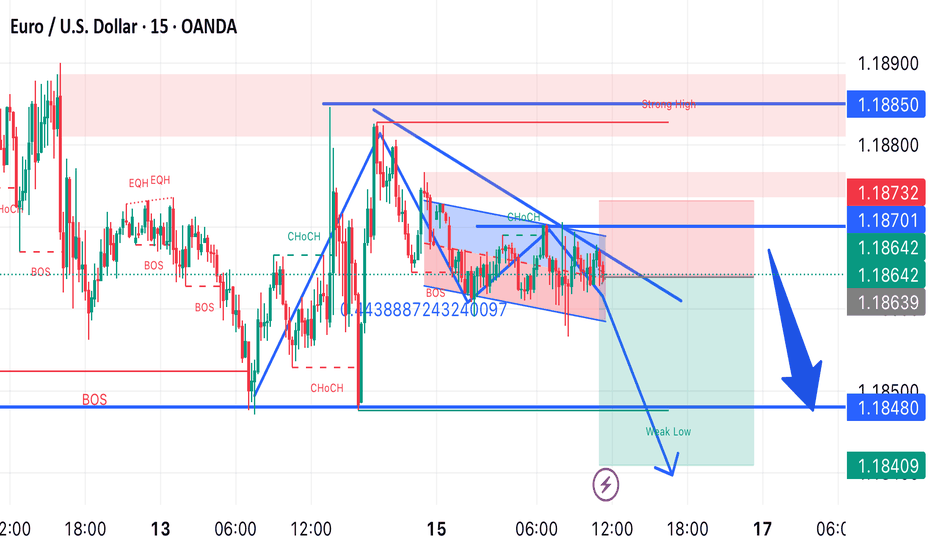
EUR/USD Bearish SMC Setup | CHoCH + Supply Tap at Strong HighThis analysis explores a high-probability short opportunity on the EUR/USD 15m timeframe, following a clear rejection from a premium supply zone.
Market Context:
The price recently mitigated a "Strong High" around the 1.18850 level. After hitting this supply, we observed a significant displacement to the downside, creating a series of structural shifts.
Key Technical Indicators:
• CHoCH (Change of Character): Price has broken the previous internal higher low, signaling that the short-term bullish trend has ended and bearish momentum is taking over.
• BOS (Break of Structure): Follow-through selling has confirmed the bearish intent by breaking minor support levels.
• Supply Zone: The entry is positioned near a refined supply block (highlighted in red) where the most recent lower high was formed.
• Liquidity: Notice the EQH (Equal Highs) marked earlier in the chart; these acted as "inducement" before the sweep and subsequent drop.
XAGUSD Strategy: Can Silver Hold the $77.50 Resistance
Silver (XAG/USD) Technical Analysis
Feb 16, 2026
Pivot Point: $77.50 Current Outlook: Bearish below Pivot
Main Scenario (Bearish):
As long as the price trades below the $77.50 pivot level, the selling pressure remains dominant. With price stability below this level (especially on the 1H timeframe), we expect the following targets:
Target 1: $75.10 (Testing the first support level).
Target 2: $73.80 (If the first support is broken).
Target 3: $72.10 (Extended bearish target).
Alternative Scenario (Bullish):
The trend will only shift to bullish if the price manages to break back above the $77.50 pivot point and stabilizes there. In this case, the targets will be:
Target 1: $79.20
Target 2: $81.00
Key Levels at a Glance:
Pivot Point: $77.50
Resistance (Upside): $79.20 | $81.00
Support (Downside): $75.10 | $73.80 | $72.10
BTCUSD H1 CHART OUTLOOKBTC is trading around 68,500 after rejecting the 70,350 – 70,850 resistance zone.
This area has acted as a strong supply zone, where price previously formed multiple rejections (liquidity grabs + long upper wicks).
After the latest rejection, price dropped sharply and is now reacting from the 68,000 pullback/support area.
🔴 Key Resistance Zone: 70,350 – 70,850
Strong selling pressure
Equal highs liquidity swept
Bearish rejection candle on H1
Market structure still shows lower high from that zone
If price returns here, expect:
Possible fake breakout
Strong volatility
High probability reaction zone
🟢 Key Support / Pullback Area: 68,000 – 68,050
Short-term demand zone
Previous breakout level
Intraday buyers defending
This level decides the next move.
📊 Possible Scenarios & Targets
🟢 Bullish Scenario (If 68,000 Holds)
If BTC holds above 68,000 and forms higher low on H1:
Targets: 1️⃣ 69,200
2️⃣ 69,800
3️⃣ 70,350 (Major Resistance)
4️⃣ 70,850
5️⃣ Breakout Target → 72,000
6️⃣ Extended Target → 73,000
Confirmation needed:
Strong bullish engulfing on H1
Break above 69,400 structure
Volume expansion
🔴 Bearish Scenario (If 68,000 Breaks)
If H1 closes below 68,000 with momentum:
Downside Targets: 1️⃣ 67,250
2️⃣ 66,650
3️⃣ 66,050
4️⃣ 65,550
5️⃣ Major liquidity zone → 65,000
6️⃣ Extended drop → 63,800
Confirmation:
Strong bearish candle close below support
Retest of 68,000 as resistance
Lower high formation
🧠 Market Structure Insight
Overall structure: Range-bound between 68K and 70.8K
Liquidity resting above 71K
Liquidity resting below 66K
Market likely to sweep one side before real expansion
🔎 Trading Plan Idea (Intraday)
Buy Zone: 68,000 – 68,200
SL: Below 67,800
TP: 69,800 / 70,350
Sell Zone: 70,350 – 70,850
SL: Above 71,100
TP: 68,500 / 67,250
⚡ Final Market Mind
BTC is currently in a decision zone.
Holding 68K → Bounce toward 70K+
Losing 68K → Quick drop toward 66K
Expect volatility near U.S. session.
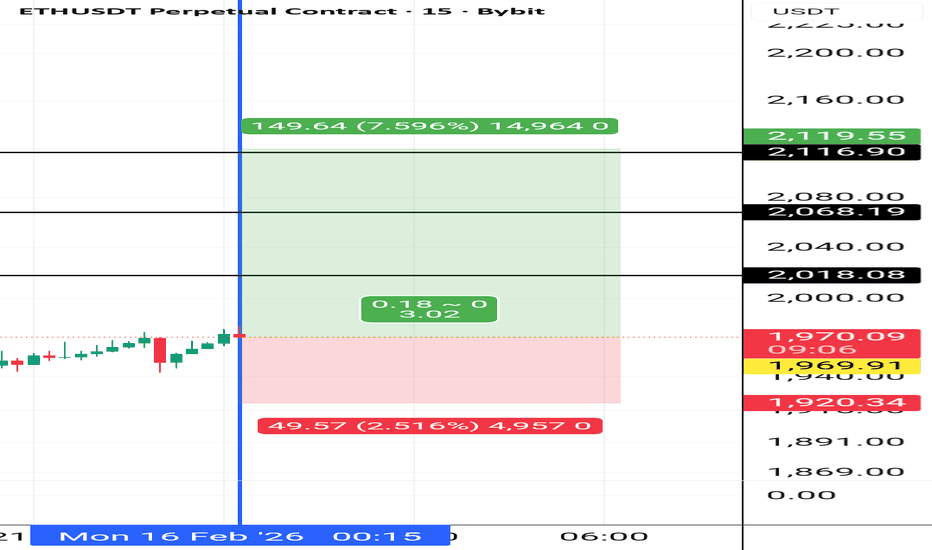
ETH: Still No Love For ETH.ETH is not showing that is building muscle. There's is a huge liquidity area down to $1600 and looks like it will go and test it once Bitcoin starts its next wave down.
ETH needs to keep above the $2500 mark before Bitcoin starts its next move down otherwise ETH will go below $1500. My goodness.
Play it right...........Play it safe...........Play it The NumberFive Way.
Boost..........Follow............Comment.
Natural Gas Stock Forecast | Oil | Dollar | Silver | Gold0:00 Weekly Commodities Outlook (Natural Gas, Oil, Dollar, Gold, Silver)
0:26 Natural Gas Forecast (NG) – Key Support & Breakdown Levels PEPPERSTONE:NATGAS
4:48 Crude Oil Technical Analysis (WTI) – Range & Resistance Watch NYMEX:CL1!
7:39 US Dollar Index (DXY) Analysis – Bear Flag or Reversal?
10:15 Gold Price Forecast (XAUUSD) – Blow-Off Top & Key Support COMEX:GC1!
13:45 Silver Price Analysis (XAGUSD) – Relative Weakness vs Gold COMEX:SI1!
17:12 Weekly Summary & Levels to Watch
Netflix at Channel SupportThe chart shows Netflix, Inc. (NFLX) on the daily timeframe trading inside a long-term ascending channel.
Current price: ~76.8
Major horizontal support: ~70
Price is now sitting near the lower boundary of the rising channel, which makes this a critical reaction zone.
🔎 Structural Overview
• Long-term structure: Still bullish (ascending channel intact)
• Recent move: Sharp corrective pullback from ~130 area
• Momentum: Bearish short-term (price below MA)
• Key support confluence: Channel base + horizontal support (70–75)
This is a high-decision zone.
🟢 Bullish Scenario (Channel Support Holds)
If:
• Price holds above 70
• Strong bullish reaction candle forms
• Reclaims 85
Upside targets:
• 95
• 110
• 120+ (mid to upper channel)
This would confirm a healthy correction inside a broader uptrend.
Long Invalidation:
• Daily close below 68
• Strong breakdown with volume
🔴 Bearish Scenario (Structure Breakdown)
If:
• Clean break below 70
• Follow-through selling
Downside targets:
• 60
• 50
• Possible deeper retrace toward 40
That would signal a full structural shift from bullish channel to corrective/downtrend phase.
Short Invalidation:
• Reclaim above 85
Risk Perspective
This setup offers:
• Clear invalidation level
• Defined structure
• Strong R/R potential
Bitcoin POSSIBLE Bearish (MUST READ IT)Hello Traders! I hope you are all doing well.
As many of you know, our first Bitcoin trade idea was highly successful and reached our targets. I am excited to share my second BTC idea with you all today.
I would love to hear your perspectives as well:
What are your current thoughts on Bitcoin?
Key Points
📍 Resistance & Target
🟥 Resistance Zone: 71.300
🟩 1 TARGET 66.000
🟩 2 TARGET 64.000
Stay with us for more updates and keep in touch with us and don't forget to share our idea with your friends and family
#BITCOIN #Btc #Forex #PriceAction #TrendlineBreakout #SafeHaven #TradingView #ResistanceTarget #IntradayTrading #SHAY_ANALYTICS
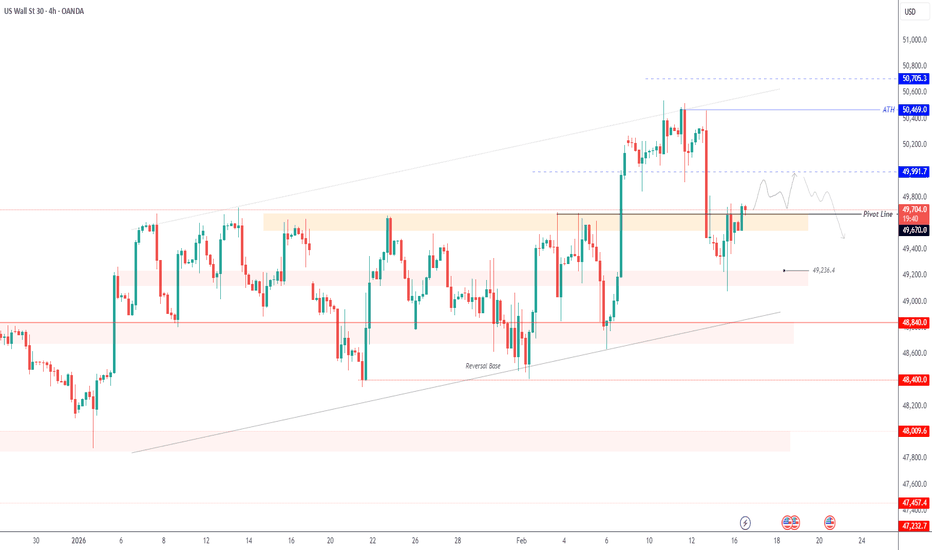
US30 HOLDS ABOVE 49670 — BULLISH MOMENTUM TOWARD 49990US30 — Breakout Holds Above Major Resistance
U.S. indices continue to trade in low-liquidity holiday conditions, making key technical levels especially important.
Technical Outlook:
Price has stabilized above the strong resistance level at 49670, turning it into a key support zone.
As long as price holds above 49670, bullish momentum may continue toward 49990, after which the market may consolidate between 49990 and 49670 before the next breakout.
However, a 1H candle close below 49550 would invalidate the bullish scenario and shift momentum lower toward 49240 and 48840.
Pivot Line: 49670
Support: 49540 – 49240 – 48840
Resistance: 49990 – 50470
Excellent Profits on re-Buy ordersAs discussed throughout my last week's commentary: 'My position: I have done excellent re-Buy orders throughout yesterday's session especially Buying #5,027.80 rejection to the upside which delivered #5,057.80 extension where I closed my set of Buying orders in Profit. This morning I have Bought #5,006.80, and closed my order on #5,027.80 extension. Also followed with #5,022.80 - #5,027.80 / #100 Lot re-Buys. Bottom line my practical suggestion is to continue Trading with re-Buy zones and close the orders at will. #5,042.80, #5,027.80, #5,012.80, #5,002.80 key entry points.'
My position: My each session starting by making key re-Buy points (of course, I am not Selling Gold at least more than a Year) as I turn all my attention to Buying. I am making spectacular Profits on Intra-day basis, especially on Thursday's session where Gold dipped aggressively and I Bought in extension local Low's on multiple occasions. Friday's session #4,985.80 set of Buying orders delivered excellent Profits and now I do await Lower Values on Gold to Buy more. Keep in mind that today is Bank holiday and Volume will be less than usual so tomorrow's session will bring decent moves. Keep Buying / never Sell for maximum Profit.
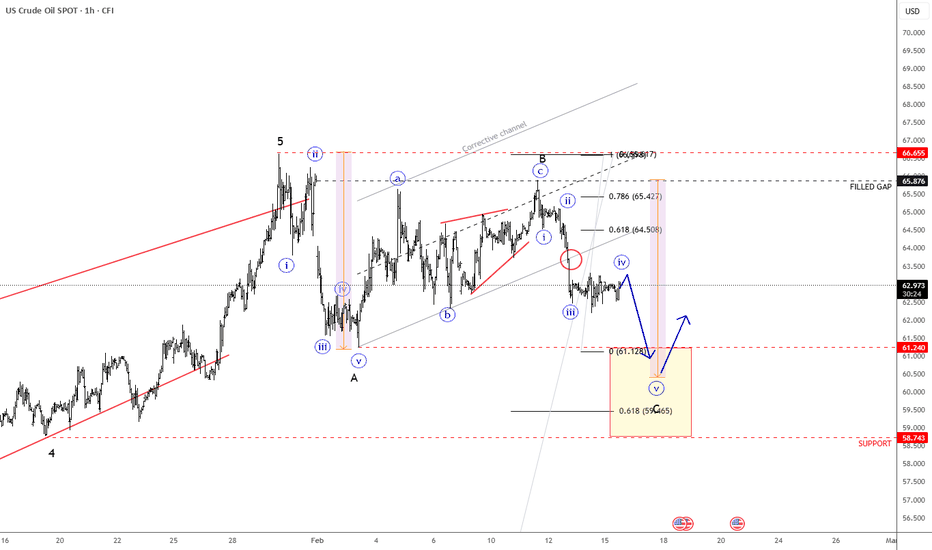
Crude Oil Intraday Analysis: Correction Underway Toward $60Crude oil remains in a short-term corrective pullback within a broader bearish wave structure. Price action suggests one more decline toward the $60 support zone before a potential larger recovery phase begins.
Crude oil is currently trading within an intraday subwave iv pullback, indicating a temporary corrective phase inside a broader impulsive decline. According to the Elliott Wave structure, the market appears to be forming subwave v, which would complete an impulse sequence within wave C of a larger ABC zig-zag correction. As long as price remains below key intraday resistance levels, the structure favors another leg lower. The next downside target is the $60 support area, where subwave v is expected to terminate. This level represents a critical technical zone that could attract buying interest and potentially trigger a broader recovery phase.
GBPUSD Liquidity First, Continuation NextGBPUSD Analysis – Monday, February 16
Welcome traders! 👋
We analyze the market every day to stay aligned with clean structure, liquidity, and high-probability setups.
Let’s break down today’s GBPUSD outlook 👇
🔍 Market Overview
Overall, GBPUSD remains in a bullish market structure 📈. Buyers are still in control on the higher timeframes.
Weekly Timeframe 📆
On the weekly chart, we can clearly see a strong buy-side liquidity sweep with a large wick candle.
This type of reaction may signal the possibility of a medium-term retracement, even though the broader trend remains bullish.
Daily & Lower Timeframes 🕯️
While the higher timeframe bias is bullish, today we may expect a short-term retracement, especially considering current market conditions.
⚠️ Important: Today is a USD bank holiday, so volatility may be lower than usual. Price may move slowly or focus on liquidity-driven setups.
📈 Directional Bias: Overall bullish, but open to short-term retracement before continuation.
📌 Today’s Scenarios
✅ Scenario 1 – 75% Level Sweep → POI → Bullish Continuation (Preferred)
Price may:
• First take out the 75% level identified on the chart
• Tap into the POI
• From there, resume the bullish movement
This would create a healthy pullback before continuation.
🔄 Scenario 2 – OBS Reaction → POI → Continuation
Alternatively, price may:
• First tap into the OBS
• Then move toward the POI
• From that zone, continue the bullish expansion
This scenario allows internal rebalancing before continuation higher.
⚠️ Risk Notes
• The market is never 100% predictable
• Always wait for confirmation before entry
• Maintain disciplined risk management
• Be mindful of reduced volatility due to the bank holiday 🏦
📘 Educational Note:
This analysis is for educational and illustrative purposes only.
Always follow your own trading plan, confirm with your strategy, and manage risk carefully.
Consistency comes from discipline and patience. 💪
💬 I’d love to hear your insights.
If you have any questions, please comment below 👇
#GBPUSD #ForexAnalysis #SmartMoneyConcepts #SMC
#Liquidity #POI #OrderBlock #MarketStructure
#PriceAction #ForexTrading #DailyAnalysis
#RiskManagement #TradingDiscipline
NVDA – Will the Breakdown Extend This Week? (Feb 16–20 Outlook)NVDA is entering this week with a clearly bearish structure on both the 1H and 15m timeframes. Price recently broke down from a prior consolidation range and is now holding below former support, which has flipped into resistance around the 187–188 area. The stock is currently trading near 182–183, sitting in the lower portion of the recent range.
Market Structure
On the 1H timeframe, NVDA printed a liquidity sweep to the upside followed by a strong move down, confirming a bearish shift in structure. Lower highs are intact, and price continues to trade below key short-term moving averages.
On the 15m timeframe, structure remains compressed but weak. Attempts to bounce have been shallow, and there has not been a confirmed higher high to suggest a short-term reversal. Until 187–188 is reclaimed and held, the bias remains tilted to the downside.
Key Levels to Watch
Immediate resistance sits at 186.90–188.20. This zone aligns with prior breakdown levels and short-term supply. Rejections here would keep pressure on the downside.
Above that, 190–193 becomes a stronger resistance band, especially near 193.50–194. A clean break and hold above 193 would be the first meaningful sign that sellers are losing control.
On the downside, 181.50 is the first support area. If that level fails, 180 becomes a key psychological and structural level. Below 180, the next downside magnet sits near 177.50–175.
GEX Context
Options positioning shows heavy call resistance stacked around 190–193, while put support is concentrated near 180. Net gamma positioning appears negative to slightly bearish, suggesting that momentum moves can extend rather than quickly mean-revert.
This setup favors continued pressure toward 180 unless buyers reclaim 188 with strength. Dealers are likely to defend 180 early in the week, but a clean break below could accelerate downside volatility.
Bullish Scenario
For bulls to regain control, NVDA needs to reclaim 188 and hold above it on a retest. A sustained move above 190 opens the path toward 193.50, where a more meaningful gamma shift could occur.
Without that structural reclaim, upside moves may continue to fade into resistance.
Bearish Scenario
If 186–188 continues to reject and price breaks cleanly below 181.50, then 180 is likely to be tested quickly. A decisive loss of 180 opens the door for a move toward 177.50 and potentially 175.
At this stage, the primary strategy remains sell-the-rip until proven otherwise.
Weekly Bias
Bearish with compression near support. A breakdown below 180 or a breakout above 193 will likely trigger expansion. Until then, expect controlled movement inside the 180–188 range with downside pressure dominating.
Disclaimer
This analysis is for educational purposes only and does not constitute financial advice. Always do your own research, manage your risk carefully, and trade responsibly.
Asian session: Firmly maintain a buy-on-dips strategy!
Gold opened at around 5035 today, touched a low of 5000, and rebounded. This movement validates my weekend strategy of buying on dips. We continue to maintain this strategy, but it's crucial to have a safety net to protect against unexpected market movements. Looking at the daily chart, Friday's long bullish candle with a slight lower wick indicates a return to bullish momentum, with various indicators showing signs of turning upwards. Our strategy remains to buy on dips, focusing on short-term support around the 5000 level, and specifically looking for support around 4960-65. Those interested in gold but unsure where to start or experiencing trading difficulties can leave a message to discuss and exchange ideas.
From the 4-hour chart, watch for short-term resistance at 5083-5100 and support at 4960-4965. Continue to trade within this range, prioritizing a conservative approach. Specific trading strategies will be provided during the trading session; please pay close attention. Gold Trading Strategy: Buy gold on a pullback to the 4993-5000 level, add to the long position on a pullback to the 4960-4966 level, with a target of 5080-5100. Hold the position if the price breaks through.
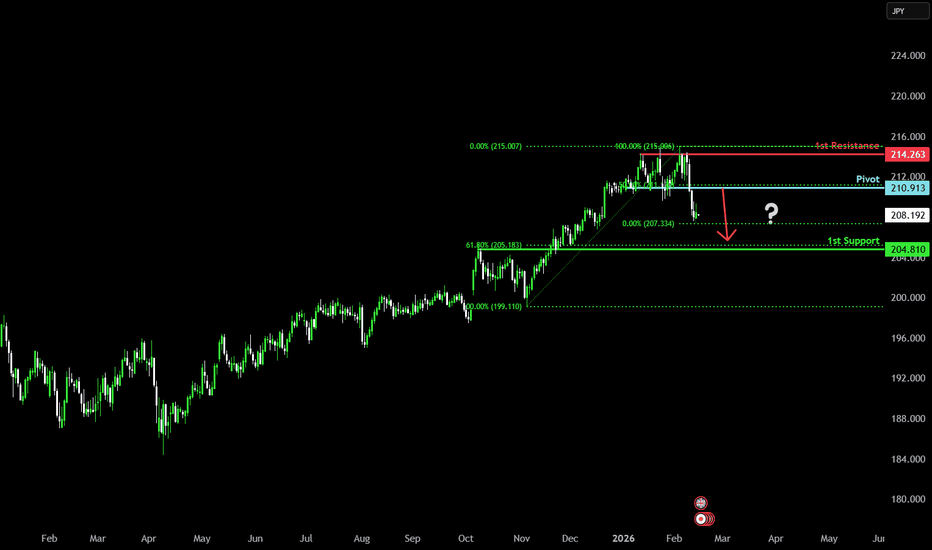
Bearish reversal off pullback resistance?GBP/JPY could rise to the pivot which is a pullback resistance and could reverse to the 61.8% Fibonacci support.
Pivot: 210.91
1st Support: 204.81
1st Resistance: 214.26
Disclaimer:
The opinions given above constitute general market commentary and do not constitute the opinion or advice of IC Markets or any form of personal or investment advice.
Any opinions, news, research, analyses, prices, other information, or links to third-party sites contained on this website are provided on an "as-is" basis, are intended to be informative only, and are not advice, a recommendation, research, a record of our trading prices, an offer of, or solicitation for, a transaction in any financial instrument and thus should not be treated as such. The information provided does not involve any specific investment objectives, financial situation, or needs of any specific person who may receive it. Please be aware that past performance is not a reliable indicator of future performance and/or results. Past performance or forward-looking scenarios based upon the reasonable beliefs of the third-party provider are not a guarantee of future performance. Actual results may differ materially from those anticipated in forward-looking or past performance statements. IC Markets makes no representation or warranty and assumes no liability as to the accuracy or completeness of the information provided, nor any loss arising from any investment based on a recommendation, forecast, or any information supplied by any third party.
XAUUSD Bullish Channel Pullback – High RR Continuation Setup TowHigher highs + higher lows inside the channel.
Strong impulsive move after the sharp selloff → clear shift in momentum.
Current consolidation is happening above internal support, not breaking structure.
That’s bullish behavior.
🎯 Trade Idea Breakdown
Entry Zone: ~5022
Stop Loss: ~5005
Target: ~5126
RR: Around 1:6+ (very healthy)
Why this makes sense:
Entry sits at channel mid-support + horizontal structure.
Stop below recent support and minor liquidity sweep area.
Target aligns with channel resistance + previous high supply zone.
This is basically a classic:
Break → Pullback → Continuation setup
🚨 What Would Invalidate It?
Clean 15M close below 5005 with strong bearish momentum.
Loss of channel structure (not just a wick, but structural breakdown).
💭 Overall Bias
As long as price holds above that 5005–5010 support pocket, buyers are still in control. This looks like accumulation before another push higher.
If momentum kicks in, that 5120–5130 zone could get tapped fast.
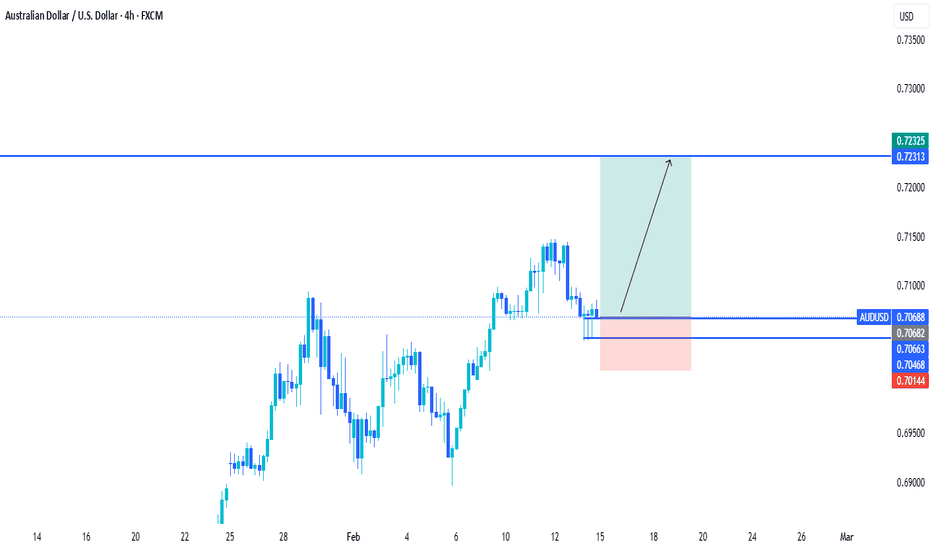
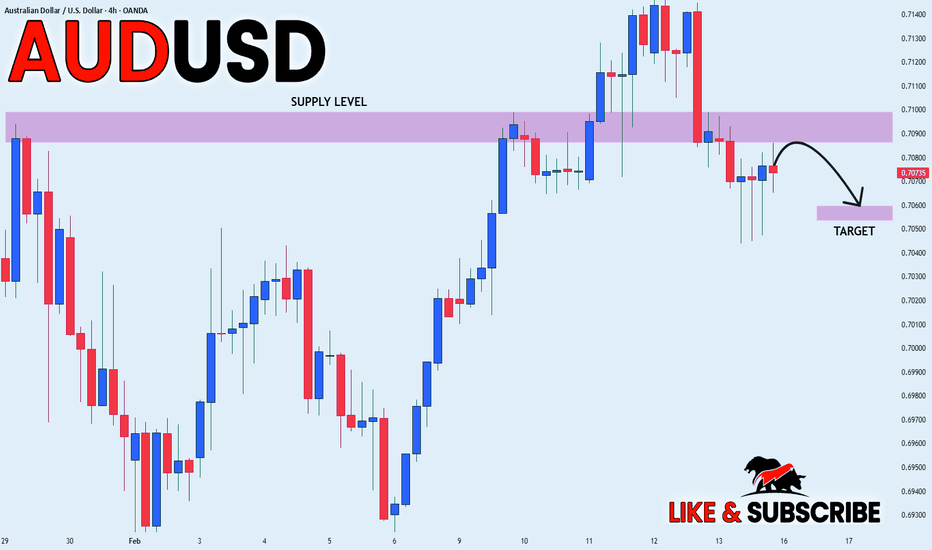
AUDUSD MOVE DOWN AHEAD|SHORT|
✅AUDUSD bearish rejection from 4H supply with shift in structure and strong displacement. Price trading back in premium, expecting continuation toward sell-side liquidity and discount imbalance at target.Time Frame 4H.
SHORT🔥
✅Like and subscribe to never miss a new idea!✅


