GOLD SHORT FROM SUPPLY AREA|
✅XAUUSD trades into a premium supply zone after strong displacement. Weak follow-through and bearish reaction signal mitigation, with sell-side liquidity resting below. Time Frame 2H.
SHORT🔥
✅Like and subscribe to never miss a new idea!✅
Trend Analysis

$ALAB - Long term tradeContext: Astera makes the "connectivity" chips that allow massive clusters of GPUs to talk to each other.
The Setup: A Triple Bottom recovery on strong volume.
⚠️ Earnings Alert: Earnings are in 2 days. Stocks showing volume before earnings often know something. Watch, but be careful holding through the event.

Bitcoin Faces Key Test as Macro Pressures Influence Price ActionRecent Market Forces Shaping Bitcoin’s Direction
Bitcoin sentiment has shifted noticeably since late 2025 as optimism about greater institutional adoption met a more challenging macroeconomic environment. The most important headline for Bitcoin has been the change in expectations around global liquidity. Since November 2025, markets have repriced the path of rate cuts as US inflation data re-accelerated and labor markets remained resilient. This pushed bond yields higher and strengthened the US dollar, creating a headwind for Bitcoin and other risk assets.
Another specific driver has been ETF related flows. Spot Bitcoin ETF inflows slowed materially through November and December after a strong first half of the year. Several weeks of flat to negative net flows reduced the marginal bid that had supported higher prices earlier in 2025. At the same time, miners increased hedging activity into year end, adding incremental supply during a period of weaker demand.
Across the broader crypto complex, performance has been mixed to weak. Large cap altcoins have underperformed Bitcoin, while smaller tokens saw sharper drawdowns as liquidity thinned. This has reinforced a defensive tone within crypto, with capital rotating back toward Bitcoin dominance rather than expanding risk. Overall sentiment can best be described as cautious and reactive rather than outright bearish, with participants focused on where longer term value may re-emerge.
What the market has done
• Since the end of October 2025, buyers lost control of 110000, which aligned with the 2025 developing VPOC. Sellers were then able to take control and offer prices back down toward the 87700 to 83100 area, which corresponds with the 2024 VAH and a key yearly level.
• From November 2025 through January 2026, the market balanced between 98600 and 83100 as buyers and sellers fought for control. This period reflected uncertainty around macro policy direction, slower ETF inflows, and reduced risk appetite across global markets.
• In the past week, buyers failed to defend the 83100 area. Price auctioned aggressively through the 2024 value area and reached the 60200 area, which marks the 2024 VAL. Buyers have responded at this level, suggesting responsive demand at longer term value.
• The broader decline since November 2025 has occurred alongside tighter financial conditions, a firmer US dollar, and fading expectations for near term monetary easing, all of which historically pressure Bitcoin valuations.
What to expect in the coming weeks
Key levels to watch are 82000, which aligns with a yearly level and offer block 2 low, and 60200, which represents the 2024 VAL.
Neutral scenario
• Expect the market to consolidate and auction two way between 82000 and 60200 as value is rebuilt.
• This scenario would likely align with stable macro data, no major policy surprises from central banks, and muted ETF flows that neither add nor remove significant demand.
Bullish scenario
• If buyers are able to step up bids within the current range, it may be an early signal that the bullish scenario is developing.
• A break and acceptance above 82000 would open the door for a move back through offer block 2 toward the 100000 area, which aligns with the 2025 LVN, where sellers are expected to respond.
• A bullish outcome would likely require renewed ETF inflows, easing financial conditions, or a clear shift toward more accommodative monetary policy.
Bearish scenario
• If sellers begin to step down offers within the range and compress price toward the 60000 area, it would hint that the bearish scenario is in play.
• A break and acceptance below 60000 would suggest continuation lower toward the 40000 area, which aligns with the 2023 VAL, where buyers are expected to respond.
• This path would likely coincide with further tightening in financial conditions, stronger dollar trends, or renewed risk off behavior across global markets.
Conclusion
Bitcoin is currently trading at a critical inflection point where longer term value is being tested against a challenging macro backdrop. Technically, the response at the 2024 VAL near 60200 is constructive, but acceptance back above 82000 is needed to shift the balance in favor of buyers. Fundamentally, the next sustained move will depend on liquidity conditions, ETF flows, and how global markets price the path of monetary policy. Until clarity emerges, Bitcoin is likely to remain in an environment where patience and level awareness matter most.
Let me know how you are positioning around these key levels and which scenario you think is most likely to play out.
Disclaimer: This is not financial advice. Analysis is for educational purposes only; trade your own plan and manage risk.
Acronyms:
C - Composite
w - Weekly
m - Monthly
VAH - Value Area High
VAL - Value Area Low
VPOC - Volume Point of Control
LVN - Low Value Node
HVN - High Value Node
LVA - Low Value Area
SP - Single print

Silver oversold bounce back supported at 7157The silver remains in a neutral trend, with recent price action showing signs of a corrective pullback within the broader uptrend.
Support Zone: 7157 – a key level from previous consolidation. Price is currently testing or approaching this level.
A bullish rebound from 7157 would confirm ongoing upside momentum, with potential targets at:
9363 – initial resistance
9816 – psychological and structural level
10187 – extended resistance on the longer-term chart
Bearish Scenario:
A confirmed break and daily close below 7157 would weaken the bullish outlook and suggest deeper downside risk toward:
6850 – minor support
6526 – stronger support and potential demand zone
Outlook:
Neutral bias remains intact while the Silver trades around pivotal 7157 level. A sustained break below or abve this level could shift momentum.
This communication is for informational purposes only and should not be viewed as any form of recommendation as to a particular course of action or as investment advice. It is not intended as an offer or solicitation for the purchase or sale of any financial instrument or as an official confirmation of any transaction. Opinions, estimates and assumptions expressed herein are made as of the date of this communication and are subject to change without notice. This communication has been prepared based upon information, including market prices, data and other information, believed to be reliable; however, Trade Nation does not warrant its completeness or accuracy. All market prices and market data contained in or attached to this communication are indicative and subject to change without notice.

BTCUSD H1 Breakdown Risk | 68,600 Sell Toward 62,000 On the H1 timeframe, BTCUSD continues to show a bearish market structure. Although price briefly broke the short-term bearish trendline, the move failed to sustain. Price faced a clear rejection below the 200 DMA, confirming that higher levels are still being sold. The RSI around 37–40 indicates weak bullish momentum and supports the bearish continuation bias. Additionally, the Fixed Range Volume Profile (FRVP) high-volume area is being respected as a strong resistance zone, keeping selling pressure active.
Trade Setup
Sell Entry: 68,600
Stop Loss: 71,500 (Above 200 DMA and resistance zone)
Target: 62,000 (Previous demand zone / liquidity retest)
As long as price remains below the 200 DMA and FRVP resistance, the downside scenario remains valid, with a high probability of a retest toward the 62,000 level.
Disclaimer
This analysis is for educational and informational purposes only and does not constitute financial advice. Trading cryptocurrencies involves significant risk, and market conditions can change rapidly. Always conduct your own analysis and use proper risk management before entering any trade. The author is not responsible for any financial losses incurred.

BTCUSD: Structural Recovery and Demand Zone Defense – Target 78kMarket Context: Bitcoin is exhibiting a strong bullish recovery on the 15-minute timeframe after successfully defending the major demand zone near 64,911. This level has served as a solid structural floor, leading to a decisive momentum shift.
Technical Breakdown:
Demand Zone Defense: The price found aggressive buying interest at the 64,911 level, initiating a "V-shaped" recovery and reclaiming previous local resistance.
Structural Momentum: We are observing a series of higher highs and higher lows, with the price now pushing toward the blue ascending trendline.
Projected Trajectory: The analysis anticipates a minor corrective retest of local support followed by an impulsive move to clear overhead supply.
Liquidity Targets: The primary objective for this move is the significant supply cluster located near 77,916.
Trade Execution Details:
Entry Area: Around 68,725 – 69,360 (Current Market Interest).
Stop Loss (SL): 64,911 (Safely placed below the demand floor).
Take Profit (TP): 77,916 (Major overhead liquidity target).

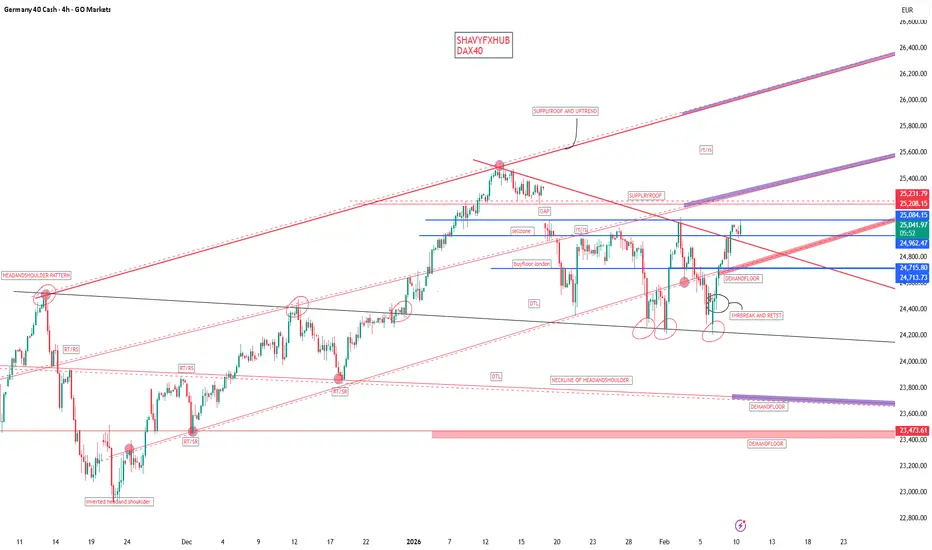
DAX40 direction DAX40 market structure key support on 4hr chart.
daxx current price =25,031.6
demand floor=24,708.9
demand floor =24,951.0
supply roof =25,092-25,074 break and close on 4hr holding support target 1 will be 25,5990-25,529
target 2 upper trendline based on strategy will be 26,003-26068 or more
what is dax40???
The DAX 40 is Germany's primary stock market index. It tracks the performance of the 40 largest and most liquid blue-chip companies listed on the Frankfurt Stock Exchange.
Formerly the DAX 30, it expanded to 40 constituents in September 2021 to better represent the German economy across sectors like industrials, tech, pharma, and finance. The index is a total return benchmark, meaning it includes reinvested dividend. It's managed by Deutsche Börse and reviewed periodically based on market cap, liquidity, and profitability criteria.
Key Constituents
Major companies include Siemens, SAP, Allianz, Deutsche Telekom, Airbus, and Bayer, spanning automotive, insurance, chemicals, and telecom sectors.
dax40 serves as key European market barometer for forex traders .
DAX40 VS ECB rate
ECB interest rate decisions significantly influence the DAX 40 by altering borrowing costs, investor sentiment, and economic growth prospects for its export-heavy companies. Rate cuts typically boost the index, while hikes or pauses can pressure it.
Rate Cuts Boost DAX
Lower ECB rates reduce corporate borrowing costs, enhancing profitability for DAX firms in sectors like industrials, autos, and finance. They make stocks more attractive versus bonds, driving inflows and often pushing the index to records—as seen after 2025's 25 bps cuts to 2.65%. A weaker euro from cuts also aids exporters like Siemens and Volkswagen.
Rate Hikes or Pauses Pressure DAX
Higher rates raise financing expenses, slowing investment and curbing growth-sensitive stocks in the index. Prolonged hawkish policy fuels recession fears, leading to sell-offs in cyclicals; for example, ECB pauses in 2025 amid 2.1% inflation kept volatility high despite stimulus. Export competitiveness suffers if the euro strengthens.
The DAX 40 and EU10Y
The EU10Y (Eurozone 10-year government bond yield, often proxied by German Bunds) share an inverse relationship driven by investor risk appetite, discount rates, and monetary policy signals.
Inverse Correlation
Rising EU10Y yields typically pressure the DAX 40 downward, as higher yields signal tighter policy or inflation fears, making bonds more competitive with stocks and increasing corporate discount rates. Historical data shows a modest negative correlation: around -0.25 monthly and -0.30 weekly between DAX prices and German 10Y yields, reflecting competition for capital. On February 10, 2026, EU10Y eased to 2.83%, supporting DAX stability amid ECB holds.
Key Drivers
Yield spikes hurt growth stocks (e.g., SAP, Siemens) by raising borrowing costs and valuation multiples.
Falling yields boost equities, as seen in ECB cut cycles, by favoring risk assets and weakening the euro for exporters.
Volatility rises during ECB events, with Bond yields as a real-time policy gauge influencing DAX flows.
#DAX40 #EU10Y
Oracle Positioned to POP!!!We believe Oracle is well positioned for a bounce from current levels. Since the breakout in March 2020, the stock has traded within a clearly defined ascending channel, consistently respecting both support and resistance.
Following a test of the channel’s upper boundary in September, Oracle experienced a sharp pullback as investor concerns grew around its exposure to OpenAI. In our view, this sell-off has been overdone. At a P/E of ~26, Oracle is now trading at a meaningful discount to peers, making the current valuation increasingly attractive.
Technically, the stock is sitting at the lower bound of the ascending channel, coinciding with the Value Area High (VAH) of the VRVP. This represents a strong confluence of support.
If this level holds, we would look to initiate a position, targeting a move back toward the mid-to-upper range of the channel.
If you enjoyed and were helped our idea, please boost it. If you're interested in any future idea we may have feel free to follow us!!!

NZDUSD Bulls in control while above 0.59NZD/USD has broken out above the descending trendline of its multi-year descending triangle formation on the weekly timeframe, with price action currently holding above prior resistance — now support. As long as price holds above this breakout zone, bullish momentum is expected to continue, with upside targets in the 0.618 (0.6719) and 0.5 (0.6484) Fibonacci retracement area in the medium term. It will be worth monitoring the Sigma Pulse MTF confluence meter for any short-term bearish signals, as these could present potential buying opportunities on pullbacks once momentum flips back in favor of bulls.

XAUUSD Bullish Continuation Toward 5100 | Channel Respecting StrStrong impulsive leg up.
Followed by a controlled pullback (healthy correction, not a breakdown).
Price held above previous minor support and bounced.
Current consolidation looks like a bullish continuation flag inside the channel.
That orange circle area marks the rejection zone — buyers stepped in aggressively there.
📈 Trade Idea Breakdown
Entry: 5028.923
Stop Loss: 5018.312
Target: 5100.366
This setup makes sense technically because:
Entry is above short-term consolidation.
Stop is below structure support (not random — it protects against breakdown).
Target aligns with channel resistance and psychological 5100 zone.
Risk-to-reward is solid as long as structure holds.
🧠 What Needs to Happen for Bulls to Win
Price must hold above 5025–5020 zone.
Continued higher lows on lower timeframes.
Break above 5055–5060 area should accelerate momentum toward 5100.
⚠️ Invalidation
If price closes strongly below 5018–5020, that would:
Break minor structure.
Increase probability of a deeper pullback toward channel support.
Overall Bias
Still bullish as long as the ascending channel holds. This looks like a continuation setup, not a reversal.
If momentum kicks in, 5100 is very realistic.

USDCAD – Sell Trade UpdateUSDCAD – Sell Trade Update 📉
Following up on the earlier USDCAD short. Price is now approaching the projected lows, and downside momentum is starting to slow.
This area is a good place to protect gains, as I don’t expect a strong break to new lows based on the current fundamentals.
Trade Management Update:
• Price is nearing downside targets 🎯
• Momentum is slowing near the lows ⚠️
• Trailing stops now makes sense 🛑
• Consider taking partial profits on a potential 10R trade 💰
Outlook:
Further downside may be limited — this looks more like a completion zone than a breakdown.
Call to Action:
Lock something in, trail stops, and let the rest run wisely 👀📊

NZD/USD SELLERS WILL DOMINATE THE MARKET|SHORT
Hello, Friends!
NZD/USD pair is in the uptrend because previous week’s candle is green, while the price is evidently rising on the 4H timeframe. And after the retest of the resistance line above I believe we will see a move down towards the target below at 0.599 because the pair overbought due to its proximity to the upper BB band and a bearish correction is likely.
Disclosure: I am part of Trade Nation's Influencer program and receive a monthly fee for using their TradingView charts in my analysis.
✅LIKE AND COMMENT MY IDEAS✅

LINKUSDTPrice has reached the bottom of the wedge, and now it’s time for it to move toward the top of the wedge. This move could take several months to complete.

Euro Dollar - Smart Money Buys Below DiscountUsing Fibonacci's Allows Traders To Gauge Whether A Specific Market Is Trading In A Premium Or Discount.
Observing 1.18060 As The 1st Draw On Liquidity With 1.18012 - 1.17944 Being Deep Discount Price Ranges
Market Is In A Discount On The Daily However, Euro Is Trading Inside A Premium Range On The Hourly
This Presents Short-Term Opportunity For Those Who Scalp Or Even Day Trade.
Not As Juicy As British Pound (Check Out My Most Recent Post) But 10-20+ Pips Up For Grabs Is Still Enough To Pay The Bills!

GBPUSD – Preparing for Political Event Driven Volatility Preparing for Political Event Driven Volatility
So far, increased UK political uncertainty has had a limited downside impact on GBPUSD. In fact, the pair has strengthened over the past couple of sessions as general dollar weakness drifts across the G7 currency space. This has taken it from lows at 1.3509 seen on Friday, back up to 1.3672 at the time of writing (0630 GMT). However, this does not guarantee that further upside is on the cards and FX traders may need to stay alert to real time news flow in case unexpected headlines trigger renewed price volatility.
Currently, Keir Starmer is indicating his determination to remain PM and potential rivals for his position are sitting on the sidelines, biding their time while deciding whether to attempt a leadership challenge. This is a developing situation which could change at any time triggering a period of increased volatility and sudden price moves in either direction, making prudent risk management essential for UK‑related assets. This may include the consideration of reduced position sizes, refreshing awareness of key support and resistance levels, and ensuring that stop‑losses are placed in a timely and appropriate manner.
Checking the Pepperstone economic calendar for important scheduled UK and US data releases across the week can also be useful. US Retail Sales for December is due later today at 1330 GMT. This number could shed light on US consumer spending over the Christmas period at a time when consumer confidence has been falling. Any surprise deviation from expectations could impact the dollar (USD) side of the GBPUSD pair.
The same could be said for the delayed US Non-farm Payrolls release, which is now due at 1330 GMT on Wednesday. This update could be more significant for currency markets and while the headline number may remain volatile, FX traders could choose to focus on the unemployment rate, which unexpectedly fell to 4.4% in the previous reading, before deciding where GBPUSD may move next.
Thursday sees a shift back to the UK or GBP side of the equation, when the preliminary Q4 2025 GDP growth update is released. The Bank of England were very close to cutting interest rates last week, and a weaker reading could see traders become more confident that a cut may be due sooner rather than later, while a stronger update could see current rate cut expectations pared back.
Then finally, the latest US CPI is scheduled for release at 1330 GMT on Friday, the outcome of which could ensure that any GBPUSD volatility may continue right up to the weekly close.
Technical Update: Identifying Potential Support and Resistance Levels to Monitor
Potential Support Levels:
Although the rally from the 1.3509 February 6th low has impressed, the chart currently shows little evidence of a sustained trend developing. As a result, traders may focus on potential support at 1.3599, which represents half of the latest up move, as the first interim level to watch.
A closing break below this support at1.3599 could open the door to further downside. Such a move might point toward a deeper decline, first suggesting risks to test the 1.3509 February 6th low, and if that level gives way, extending toward 1.3339, which is the January 19th downside extreme.
Potential Resistance Levels:
While the support at 1.3599 continues to hold on a closing basis the risks may still lean toward further attempts at price strength. However, renewed upside could require a closing break above initial resistance at 1.3733, which is the February 4th high, to confirm fresh momentum.
A closing break above the 1.3733 high could potentially see traders looking for continued attempts toward higher levels. As the chart above highlights, the next resistance could sit at 1.3869, which is the January 27th high, with scope for further gains if that level is also broken above on a closing basis.
The material provided here has not been prepared accordance with legal requirements designed to promote the independence of investment research and as such is considered to be a marketing communication. Whilst it is not subject to any prohibition on dealing ahead of the dissemination of investment research, we will not seek to take any advantage before providing it to our clients.
Pepperstone doesn’t represent that the material provided here is accurate, current or complete, and therefore shouldn’t be relied upon as such. The information, whether from a third party or not, isn’t to be considered as a recommendation; or an offer to buy or sell; or the solicitation of an offer to buy or sell any security, financial product or instrument; or to participate in any particular trading strategy. It does not take into account readers’ financial situation or investment objectives. We advise any readers of this content to seek their own advice. Without the approval of Pepperstone, reproduction or redistribution of this information isn’t permitted.

EURUSD rallyYesterday, EURUSD continued its upward move and broke above 1,1900.
This created additional opportunities for long positions and profit-taking.
The next key resistance level is at 1,1960.
Watch for higher lows and a move toward the previous high.

XAUUSD (SHORT)
Dollar index showing strength
therefore expecting Gold sells as we have key fundermental news to push gold down

BTC SHORTBTC rejecting the 70.8K 0.5 retrace and failing to reclaim intraday structure.
Momentum shifting down with clean liquidity sitting below 68K → 66.6K.
As long as price stays under 70.5K, short bias remains valid.
Invalidation above 71K.


DDOG Earnings: Polymarket Override Signals Bullish BreakoutDDOG QuantSignals V4 Earning 2026-02-09
⚡ QS V4 ELITE: DDOG (Earnings)
Time Horizon: Binary Event / Short-term (Exit at next market open)
Risk Grade: 🚨 EXTREME (Binary Event)
🔹 Core Thesis
Despite technical weakness and Katy AI's cautious bearishness, 88% Polymarket "Beat" probability suggests institutional expectations are high for an EPS surprise.
Likely triggers a momentum squeeze above the 50-day MA.
Katy AI Bias: Bearish | Probability: 61% | Projected Move: -1.66%
Polymarket Override: Bullish due to extreme beat expectations.
🔹 Tactical Observation
RSI: Not specified (likely oversold/weak technically)
MACD & technicals show caution, but fundamental expectations dominate.
Options flow suggests a high-probability short-term bullish event.
Market pricing anticipates a $15.48 move, nearly double the historical average of $8.45.
🔹 Strategy (Options)
Bull Call Spread (Vertical Debit Spread)
Buy: $115 Call
Sell: $125 Call
Expiry: 2026-02-13
Entry Price: $4.20 debit
Max Potential: $5.80 (+38%)
Max Risk: $4.20 (Premium Paid)
R:R: 1:1.38
Execution Notes:
Exit 100% at market open on 2026-02-10.
Do not hold through post-earnings volatility crush.
🔹 Risk / Thesis Error
If DDOG beats EPS but guides lower on revenue or AI progress → stock may follow Katy AI’s bearish vector (~$105).
Binary event risk is EXTREME.
Strategy mitigates risk with defined spreads and strict exit protocol.

USDCHF: Growth & Bullish Continuation
The analysis of the USDCHF chart clearly shows us that the pair is finally about to go up due to the rising pressure from the buyers.
Disclosure: I am part of Trade Nation's Influencer program and receive a monthly fee for using their TradingView charts in my analysis.
❤️ Please, support our work with like & comment! ❤️

Gold extends gains: Key levels to watchGold was trading somewhat comfortably above the $5K hurdle again by late afternoon trading in London. It was potentially gearing up for a bullish breakout above the next band of resistance seen between $5,070ish to $5,100ish. This zone is where it had previously found support on a couple of occasions before breaking lower. We saw gold already test this area of resistance a few days ago, where it sold off from, which led to another breakdown that ultimately failed to make a new lower low.
So, we are back at that area once again. Let’s see what happens here. If it were to reclaim this area, I think that would be obviously bullish, in which case we could see an extension of the rally all the way to the levels highlighted on the chart, at around $5,290, or even $5,390, marking the previous breakdown areas. So those are the key targets to watch on the upside in the event of a bullish breakout.
But it’s important that reclaimed support levels hold now, because if they don’t and we see a breakdown below them, this could well trigger renewed selling in the market. A couple of those levels are at $5,000 initially, followed by $4,950 and then $4900, formerly resistance. Additional support is at $4800 where we have a trend line in place.
By Fawad Razaqzada, market analyst with FOREX.com

Confluence supportApplovin has bounced of the trendline and horizontal support.
Applovins dip was a huge overreaction and i expect a fast recovery heading into earnings and after.
First resistace now would be $500
