GBPJPY - Bullish Channel Retest: Demand Zone Buy SetupHello Traders! 👋
What are your thoughts on GBPJPY?
Price is in a clear uptrend within a rising channel and has pulled back into a marked demand zone / channel support, so the idea is to look for long entries here expecting continuation higher.
Don’t forget to like and share your thoughts in the comments! ❤️
Trend Analysis

USDJPY (LONG)
Major support ZOne on Jpy pairs Across
USD strength as per dollar index
confirming bullish momentum and ellitos wave in play
Pivots support level on weekly

Nikkei 225 Retreats From Record HighNikkei 225 Retreats From Record High
As the chart shows, the Nikkei 225 index reached a historic high near 58,500 points on Monday. Bullish sentiment was driven primarily by political developments.
According to media reports, the rally followed the decisive victory of the Liberal Democratic Party (LDP) under Sanae Takaichi, who has signalled aggressive fiscal stimulus measures (a package exceeding $135 bn), food tax cuts, and the continuation of an accommodative monetary policy stance.
However, today the Nikkei 225 is showing signs of a pullback. It is possible that major market participants have begun taking profits amid the wave of optimism, as Takaichi’s victory had already been largely priced in, and official confirmation of a parliamentary supermajority may have acted as a trigger to close long positions.
From a technical perspective, a retracement also appears justified.
Technical Analysis of the Nikkei 225 Chart
It is worth noting that:
→ after the RSI moved into extreme overbought territory, it formed a bearish divergence with price;
→ price action itself produced a bearish triple top pattern.
As the decline unfolds, a local trendline (shown in purple) has shifted from acting as support to functioning as resistance.
In light of the above, it is reasonable to assume that an extended pullback could drive the Nikkei 225 towards the median of the long-term ascending channel.
In the event of a deeper correction, the support zone below the 56,000 level may come into play, where a previous bullish imbalance formed characteristics of a Fair Value Gap pattern.
This article represents the opinion of the Companies operating under the FXOpen brand only. It is not to be construed as an offer, solicitation, or recommendation with respect to products and services provided by the Companies operating under the FXOpen brand, nor is it to be considered financial advice.

GBPJPY TRADE IDEA FOR FEB 12TH, 2026Price is on an overall DT, but currently on retracement, so if price breaks above and retains, then we BUY, if it rejects consistently, we sell.

EURUSD NFP Reaction Confirms Supply StrengthQuick Summary
The strong 90+ pip drop after NFP confirms the strength of the supply zone and Price has not fully reached the main supply area yet
Current movement may represent liquidity engineering and a sweep above Equal Highs is likely before bearish continuation
Selling before liquidity is taken may be premature
Full Analysis
The sharp 90+ pip bearish reaction following the NFP release reinforces the idea that the supply zone above remains significant and respected by the market. Strong fundamental catalysts often reveal where real institutional orders are positioned, and this reaction suggests active sellers are present.
However, price has not yet fully tapped into the primary supply level. This raises the probability that the current structure is part of a broader liquidity-building phase rather than the start of an immediate sustained decline.
The recent price behavior indicate potential accumulation of liquidity. Equal Highs sitting above current price act as a clear liquidity magnet. From a market structure perspective, it would be logical for price to push higher, sweep those resting buy stops, and only then initiate the true bearish continuation.
For that reason, initiating short positions before a liquidity sweep above the Equal Highs may be premature. A cleaner scenario would involve:
1 - Liquidity sweep above EQH
2 - Clear rejection or bearish displacement
3 - Lower timeframe CHOCH confirming shift in control

NQSDAQ 100 Futures: the odds for a bearish wave aheadanalysis per time frame:
shows signs for downside wave that just started.
shows clear trading range, with mild preference to the sellers.
shows pattern that prefers selling the bounces which shows more corrective nature within the bigger picture, bounces that does not represent a pure bullish trend up to the weekly time frame.
trading strategy: the 1D and 4H charts showing price clusters that does not require wide price movement to get firm evidence that trying the positional short strategy is wrong. personally, I do not see a reason to be stubborn about the short side. it is pure Risk/Reward ratio that prefers to try shorts during this week, to sell bounces on the 4H chart. targets to the downside off the daily chart are the recent 2 lows, followed by lower prices showing on the weekly chart through the Fibonacci drawn on the weekly chart and 200 DMA with NASDAQ:NDX and not the NQ.
pay attention to the moving averages ribbon as showing on the daily chart.
all in all, downside target is under 23800 and failure of the resistance cluster to hold as showing on the 4H chart to open the way for 26600 and higher.
good luck, in case you need to clarify a certain point, do not hesitate to contact me. I would love to help you if possible.
happy trading !

EURUSD Capped on 8-Month Resistance, NFP ResultsKey Events
• EURUSD pulls back below 1.19 on a 7-month high NFP print
• DXY challenges a multi-year trendline, keeping currency markets and precious metals on edge
• Energy prices tilt to the upside, potentially reinforcing rate hold policies should inflation risks resurface
From a monthly perspective, EURUSD’s bullish bias is challenging a trendline connecting higher highs since July 2025, with the latest spike reaching 1.2080 and a monthly close near 1.1850.
Given the broader fundamental backdrop and the potential for dollar strength to hold, unless a clear daily or weekly close above 1.1950 emerges, EURUSD may face renewed selling pressure toward 1.1760 and 1.1580 before a deeper drawdown toward the 1.12 zone unfolds.
The monthly RSI is hovering at overbought levels last seen in 2021 and 2018, increasing the risk of a corrective move should the 1.180–1.1760 zone give way.
On the upside, a sustained close above 1.1950 would target highs last seen in 2021 and 2018 at 1.23 and 1.25, respectively.
The chart that remains in focus is the DXY, holding above its multi-year trendline, defining either a structural shift in the 18-year cycle below the 95 mark or a continuation of the broader bullish structure.
- Razan Hilal

GBPUSD | FRGNT DAILY FORECAST |Q1 | W6 | D12 | Y26📅 Q1 | W6 | D12 | Y26
📊 GBPUSD | FRGNT DAILY FORECAST |
🔍 Analysis Approach
I’m applying a developed version of Smart Money Concepts, with a structured focus on:
• Identifying Key Points of Interest (POIs) on Higher Time Frames (HTFs) 🕰️
• Using those POIs to define a clear and controlled trading range 📐
• Refining those zones on Lower Time Frames (LTFs) 🔎
• Waiting for a Break of Structure (BoS) as confirmation ✅
This process keeps me precise, disciplined, and aligned with market narrative, rather than reacting emotionally or chasing price.
💡 My Motto
“Capital management, discipline, and consistency in your trading edge.”
A positive risk-to-reward ratio, combined with a high-probability execution model, is the backbone of any sustainable trading plan 📈🔐
⚠️ On Losses
Losses are part of the mathematical reality of trading 🎲
They don’t define you — they are necessary, expected, and managed.
We acknowledge them, learn, and move forward 📊➡️
🙏 I appreciate you taking the time to review my Daily Forecast.
Further context and supporting material can be found in the Links section.
Stay sharp 🧠
Stay consistent 🎯
Protect your capital 🔐
— FRGNT 🚀📈
FX:GBPUSD

EUR/USD Break of Structure + Liquidity Targeting🎯 EUR/USD "THE FIBRE" - Bullish Breakout Strategy 🚀
Day/Swing Trade Opportunity | Forex Major | Risk Management Priority
📊 EXECUTIVE SUMMARY
Current Price (Feb 11, 2026): $1.1908 USD | 52-Week High: $1.2082 (Jan 28, 2026) | Bullish Bias: ✅ ACTIVE
The Euro is approaching multi-year resistance levels as the ECB maintains an accommodative stance while the Federal Reserve signals a cautious pause on rate cuts. Real-time market sentiment remains bullish with speculative long positions at 163.4K contracts (highest since Aug 2023). This setup presents a clean breakout opportunity above structural resistance with solid technical confluence.
🎪 TRADE SETUP: BULLISH BREAKOUT PLAN
Entry Strategy 📍
Primary Entry Zone: ANY PRICE LEVEL POST-RESISTANCE BREAKOUT @ $1.19300 – $1.19400 (confirmed above daily resistance)
Confirmation Method: Wait for 4-hour candle closure ABOVE $1.1930 with volume expansion
Secondary Entry: Pullback-and-retest of $1.1925 after initial breakout confirmation
Entry Type: Pending order activation OR live market entry on impulse break
⚠️ Technical Rationale: This level represents the convergence of:
February psychological resistance ($1.19 handle)
55-day Simple Moving Average (SMA) proximity
Previous swing high resistance zone
Bollinger Band upper band extension trigger
🎯 PROFIT TARGETS (TP) – LIQUIDITY SWEEP STRATEGY
TP1: "First Liquidity Grab Completed" ✨
Target Level: $1.19800
Rationale: Initial supply capture + seller breakeven liquidation zone
Action: PARTIAL PROFIT TAKE (40% position size)
Purpose: Lock in early gains + reduce risk exposure
Technical Confluence: Intermediate resistance + previous weekly highs
TP2: "The Big Money Exit – Final Liquidity Sweep" 💰
Target Level: $1.20500
Rationale: Psychological $1.20 barrier + major multi-year resistance zone (previously tested Jan 28 high @ $1.2082)
Action: FULL POSITION CLOSURE (remaining 60%)
Purpose: Capture the full breakout move with systematic profit extraction
Confluence Factors:
$1.20 psychological level = institutional buy/sell equilibrium
200-week EMA approximation
Prior 4-year resistance tested in January 2026
🛑 RISK MANAGEMENT: STOP LOSS STRUCTURE
Stop Loss Level: $1.1860 (Hard Stop)
Pips at Risk: ~70 pips from entry ($1.1930)
Rationale: Break below the 50-day exponential moving average (EMA)
Logic: Entry invalidated if this structural support fails
Position Sizing Rule: Risk NO MORE than 1-2% of your trading capital per trade
Example: If trading $10,000 account, max loss = $100-$200
At 75-pip stop = ~0.54% account risk ✅ PROFESSIONAL LEVEL
⚠️ CRITICAL NOTE TO ALL THIEF TRADERS & OG's:
"This stop loss is a SUGGESTED technical level – NOT a mandatory requirement. You are the captain of your own ship. Adjust your SL based on YOUR risk tolerance, account size, and personal trading style. A 50-pip stop or 100-pip stop may suit YOUR plan better. The goal is CONSISTENT MONEY MANAGEMENT, not copying mine. Trade YOUR edge, not mine. Your winners keep you in the game, your discipline keeps you IN the game." 🎖️
📈 CORRELATION PAIRS TO WATCH
📊 Watch List for Smart Traders:
1. GBP/USD (Current: $1.3590) 🇬🇧💵
Correlation: Positive (+0.85 to +0.92) — Moves in SAME DIRECTION as EUR/USD
Why It Matters: UK pound strength = Euro strength signal
Current Setup: Testing key support at 1.3267 (200-day EMA); rebound could confirm EUR/USD bullish bias
Action: If GBP/USD breaks above 1.3700, expect EUR/USD to extend beyond $1.20
Watch Level: 1.3350-1.3400 = Confluence zone with EUR/USD momentum
2. USD/JPY (Current: ~155.50) 🇺🇸🇯🇵
Correlation: Negative (-0.70 to -0.78) — Moves in OPPOSITE direction
Why It Matters: USD weakness = JPY weakness; JPY weakness = EUR/USD BULLISH pressure
Current Setup: Testing 154.45-155.00 support zone; recovery here = USD strength headwind
Action: If USD/JPY breaks DOWN below 154.45, EUR/USD will have STRONG BULLISH tailwind
Risk Alert: Japanese Ministry intervention at 160.00 could suddenly flip this dynamic
3. EUR/JPY (Current: ~186.17) 🇪🇺🇯🇵
Correlation: Positive (+0.80 to +0.88)
Why It Matters: Euro weakness vs Yen = potential weakness signal for EUR/USD
Technical Note: Recently formed evening-star pattern; showing lower-high formation
Support Zone: 182.65-183.16 is critical support; break below = caution signal for EUR/USD bulls
4. GBP/JPY (Current: ~214.13) 🇬🇧🇯🇵
Correlation: Strong positive (represents overall risk appetite)
Why It Matters: Carry trade health indicator; when it rallies = risk-on environment = EUR/USD bullish
Technical Setup: Testing 213.50-214.50 resistance zone after 18-year high
Interpretation: Continued strength = confidence in European assets
5. US Dollar Index (DXY) (Current: ~96.60) 💹
Inverse Correlation: For every 1% DXY drops = EUR/USD can add 30-50 pips
Current Trend: Down 10% for the year; multi-day lows suggest weakness persists
Critical Level: 98.00 = psychological resistance; break above = USD strength resumes
Fed Proxy: DXY tracks Fed easing cycle expectations
💼 FUNDAMENTAL & ECONOMIC DRIVERS
🏛️ EUROZONE FACTORS (Supporting Bullish EUR)
ECB Stance: HAWKISH HOLD 📍
Current Policy Rate: 2.15% (Main Refinancing Rate) — UNCHANGED since July 2025
February 5 Decision: ECB kept rates flat as expected; President Lagarde signaled COMFORT with Euro strength
Key Quote from Lagarde: "Inflation outlook remains in a GOOD PLACE" ✅
Implication: ECB willing to tolerate higher EUR/USD; NO urgency to cut rates
Market Pricing: <10% probability of 25bp rate cut by Feb 2026
Inflation Performance: SOFT LANDING ACHIEVED ✅
January 2026 Headline Inflation: 1.7% YoY (BELOW 2% target – unexpected positive!)
Core Inflation: 2.2% YoY (lowest since Oct 2021)
ECB Reaction: Comfortable with current stance; inflation on track to stabilize at 2% target
Trader Takeaway: NO EMERGENCY rate cuts needed; ECB can stay patient and firm = EUR support
Growth Outlook: RESILIENT DESPITE HEADWINDS 💪
2026 Growth Forecast: 0.8-1.2% (modest but stable)
Support Drivers: Higher defense spending + infrastructure investment announced
Risks: German auto sector weakness (-5% output); potential Trump reciprocal tariffs on EU goods
Signal: Growth sufficient to prevent emergency easing; EUR constructive long-term
Positioning Sentiment: EXTREME BULLISH SKEW 📊
Speculative Long Positions: 163.4K contracts (highest since August 2023!)
Implication: Momentum is REAL but crowded; watch for profit-taking
Risk Management: Position likely getting extended; set stops for protection
🇺🇸 UNITED STATES FACTORS (Pressuring USD Weakness)
Federal Reserve: CAUTIOUS PAUSE MODE ⏸️
Current Fed Funds Rate: 3.50%-3.75% (UNCHANGED since January 28, 2026)
2026 Rate Path: Markets pricing 2 additional cuts (June + September consensus)
Powell Stance: "Neutral" rate achieved; no urgency to cut aggressively
BUT: Committee divided on how many cuts acceptable in 2026
Market Reaction: Rate cut expectations already priced into USD weakness
Labor Market: SOFTENING SIGNALS 📉
Recent NFP Data: Softer than expected (latest week: 199K claims vs 219K expected)
Wage Growth: Moderating but still above 3% annually
Implication: Labor market cooling = potential for 2-3 Fed cuts in 2026
EUR/USD Signal: Soft jobs data = USD pressure = EUR/USD bullish trigger
Inflation: STICKY BUT MANAGEABLE 📈
CPI Trend: Fed willing to live with inflation above 2% for longer
Key Risk: If US inflation re-accelerates, Fed cuts could be delayed = USD reversal signal
Watch: This week's CPI release (Friday) = critical volatility catalyst
Trump Policy Uncertainty: MASSIVE WILDCARD 🃏
Tariff Plans: Proposed 10-20% tariffs on EU goods + reciprocal tariff threat
Capital Flow Impact: Risk-off sentiment could flip positions quickly
Geopolitical Risk: Elevated uncertainty pushing traders toward safe havens (JPY/EUR strength)
Trade Note: Geopolitical premium = currently supporting EUR/USD above natural levels
📅 UPCOMING ECONOMIC EVENTS TO MONITOR
THIS WEEK (Feb 10-14, 2026):
🔴 Feb 12 🇺🇸 NFP — Soft = EUR/USD UP ⬆️
🔴 Feb 14 🇺🇸 CPI — Hot CPI = USD RALLY ⬆️
🟡 Feb 12 🇺🇸 Jobless Claims — Labor trend
🟡 Feb 14 🇺🇸 Retail Sales — Consumer check
NEXT MONTH (March 2026):
🔴 March 5 🇪🇺 ECB Decision — MAJOR
🔴 March 19 🇺🇸 Fed FOMC Meeting — Key decision
🎯 RISK MANAGEMENT CHECKLIST ✅
Before You Enter This Trade:
Is your stop loss set at 1.1825? (Non-negotiable SL placement)
Have you calculated position size for max 1-2% account risk?
Are you monitoring the USD/JPY pair for correlation confirmation?
Did you set alerts on GBP/USD 1.3700 (confirmation level)?
Are you aware this is FRONT-RUN by institutional players at 1.20?
Do you have an EXIT PLAN if NFP/CPI surprises hurt USD?
💭 THIEF TRADER WISDOM & MINDSET QUOTES 🎖️
On This Trade Specifically:
"THE FIBRE is playing with big money right now. Institutional players are building positions into $1.20. They'll trap retail both ways – first stop them at 1.1825, then reverse at 1.20. Know their game, execute YOUR plan, take YOUR profits at MY targets. Don't be greedy." — Thief OG's Trading Code 🏴☠️
"At 1.19300, you're buying the breakout where retail panic-buys. Smart money is already 200 pips higher on leveraged positions. Let them do the heavy lifting; you just ride the momentum wave. Lock profits at TP1, then milk the remaining move. This is not a lottery ticket – it's a systematic extraction of value." 💰
General Thief Trading Mentality:
"Money moves in trends, emotions move in noise. The chart doesn't lie, but prices lie often. Enter at confluence zones, exit at institutional resistance. Your biggest enemy is not the market – it's your fear of missing out and your greed for 'just a few more pips.' Take your target and sleep easy." — OG's Philosophy
"Stop losses are your insurance premium, not your enemy. A trader who respects stop losses lives to trade another day. A trader who moves stops dies a thousand deaths. Be disciplined or be broke – there's no middle ground." 🎖️
"The best trades feel boring when you're in them. If you're thrilled and checking every minute, you're over-leveraged. Real money is made in boring accumulation phases, not exciting crash moments. Boring = Profitable." 📊
"Every time you add to a losing position, you're not being brave – you're being BANKRUPT in slow motion. Your first loss is your best loss. Let it go and move to the next setup. Pride kills accounts faster than any bad trade." 🛑
Regarding This Specific Setups' Risks:
"THE FIBRE is strong, but it's also tired after a 600+ pip run from 1.15. When something runs this hard this fast, profit takers are EVERYWHERE above 1.20. Don't be the last fool buying breakout highs. Hit your target 2 at 1.20500 and WALK AWAY. The next 200 pips aren't worth the risk of reversal." ⚠️
📝 FINAL DISCLAIMER (Read This!) ⚖️
This is NOT financial advice. I am NOT recommending you take this trade. I am sharing a technical setup based on real market data as of February 11, 2026.
You are 100% responsible for:
✅ Your entry decision
✅ Your exit decision
✅ Your position sizing
✅ Your stop loss placement
✅ Your profit targets
✅ Your account risk management
Markets can gap through your stops. Forex can move 100+ pips in seconds on economic data. Position sizing incorrectly = account liquidation. Use proper leverage (1:5 max for majors recommended).
This trade has 60%+ probability of hitting TP2 based on technical confluence, but that means 40% probability of loss. Risk/reward = 1:1.75 = Professional standard.
Trade the setup, not the money. Execute the plan, not your emotions. 🎯
Chart Setup Summary:
🟢 BUY SIGNAL: Entry on breakout above 1.1930
⏹️ STOP LOSS: 1.1860 (70 pips risk)
🎯 TARGET 1: 1.1980 (50 pips gain) – Take 40% profits
🚀 TARGET 2: 1.2050 (120 pips gain) – Close remaining 60%
📊 Risk/Reward Ratio: 1:1.75 ✅ PROFESSIONAL GRADE
Trade with a plan. Manage your risk. Respect the market. Make money. 🏴☠️💰📈
Good Luck, Thief OG's & Fellow Traders! 🎖️

Bullish bounce off?Loonie (USD/CAD) has bounced off the pivot and could potentially rise to the 1st resistance.
Pivot: 1.3556
1st Support: 1.3524
1st Resistance: 1.3624
Disclaimer:
The opinions given above constitute general market commentary and do not constitute the opinion or advice of IC Markets or any form of personal or investment advice.
Any opinions, news, research, analyses, prices, other information, or links to third-party sites contained on this website are provided on an "as-is" basis, are intended to be informative only, and are not advice, a recommendation, research, a record of our trading prices, an offer of, or solicitation for, a transaction in any financial instrument and thus should not be treated as such. The information provided does not involve any specific investment objectives, financial situation, or needs of any specific person who may receive it. Please be aware that past performance is not a reliable indicator of future performance and/or results. Past performance or forward-looking scenarios based upon the reasonable beliefs of the third-party provider are not a guarantee of future performance. Actual results may differ materially from those anticipated in forward-looking or past performance statements. IC Markets makes no representation or warranty and assumes no liability as to the accuracy or completeness of the information provided, nor any loss arising from any investment based on a recommendation, forecast, or any information supplied by any third party.

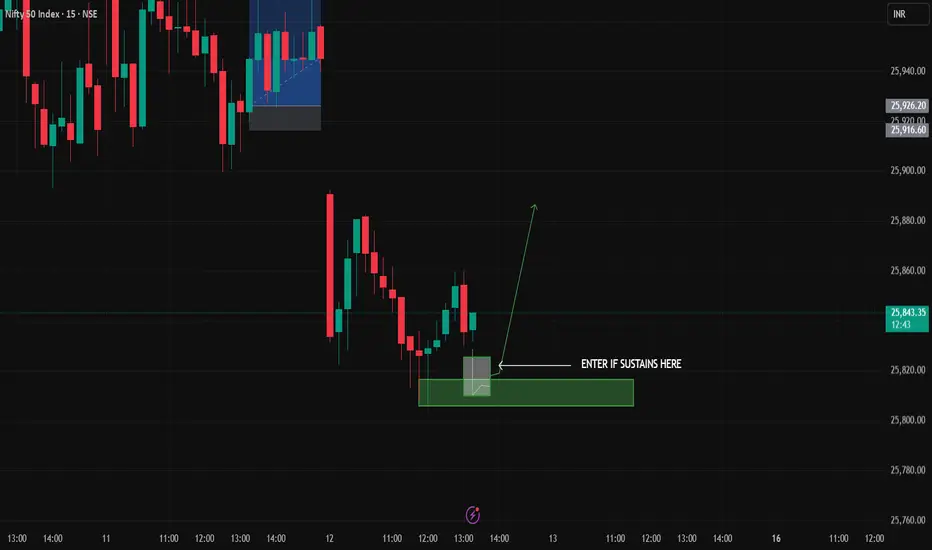
NIFTY TRADE If the candle sustains on 5-10 min timeframe in the white zone.
It could be a good entry to target day high.
Study by yourself before entering
EURAUD H4 | Bearish Continuation SetupBased on the H4 chart analysis, we could see the price rise to our sell entry level at 1.6829, which is an overlap resistance that aligns with the 38.2% and the 23.6% Fibonacci retracement.
Our stop loss is set at 1.6996, which is a pullback resistance level slightly above the 38.2% Fibonacci retracement.
Our take profit is set at 1.6632, which is a pullback support.
High Risk Investment Warning
Stratos Markets Limited fxcm.com Stratos Europe Ltd fxcm.com
CFDs are complex instruments and come with a high risk of losing money rapidly due to leverage. 69% of retail investor accounts lose money when trading CFDs with this provider. You should consider whether you understand how CFDs work and whether you can afford to take the high risk of losing your money.
Stratos Global LLC fxcm.com Losses can exceed deposits.
Please be advised that the information presented on TradingView is provided to FXCM (‘Company’, ‘we’) by a third-party provider (‘TFA Global Pte Ltd’). Please be reminded that you are solely responsible for the trading decisions on your account. Any information and/or content is intended entirely for research, educational and informational purposes only and does not constitute investment or consultation advice or investment strategy. The information is not tailored to the investment needs of any specific person and therefore does not involve a consideration of any of the investment objectives, financial situation or needs of any viewer that may receive it. Past performance is not a reliable indicator of future results. Actual results may differ materially from those anticipated in forward-looking or past performance statements. We assume no liability as to the accuracy or completeness of any of the information and/or content provided herein and the Company cannot be held responsible for any omission, mistake nor for any loss or damage including without limitation to any loss of profit which may arise from reliance on any information supplied by TFA Global Pte Ltd.
Stratos Trading Pty. Limited fxcm.com
Trading FX/CFDs carries significant risks. FXCM AU (AFSL 309763), please read the Financial Services Guide, Product Disclosure Statement, Target Market Determination and Terms of Business at fxcm.com

BTCUSD SHORT VIEWS!!Crypto-linked stocks traded unevenly in overnight action on Wednesday, with a handful of names attempting to stabilize after a sharp selloff while larger players remained under pressure.

Stop!Loss|Market View: AUDUSD🙌 Stop!Loss team welcomes you❗️
In this post, we're going to talk about the near-term outlook for the AUDUSD currency pair☝️
Potential trade setup:
🔔Entry level: 0.70784
💰TP: 0.69414
⛔️SL: 0.71865
"Market View" - a brief analysis of trading instruments, covering the most important aspects of the FOREX market.
👇 In the comments 👇 you can type the trading instrument you'd like to analyze, and we'll talk about it in our next posts.
💬 Description: Buying momentum on AUDUSD and NZDUSD is surprising compared to other major pairs, and further gains are possible this week. Specifically, for AUDUSD, this represents a potential rise to 0.72, but the medium-term selling pressure remains strong. A likely reversal signal would be a price close below resistance at 0.71000. A false breakout in this case would pull the price toward support at 0.69000, with a more ambitious target near 0.67000 also a viable option.
Thanks for your support 🚀
Profits for all ✅

TRB Ready to Explode... or Crash?Yello Paradisers, are you watching what’s unfolding on TRB/USDT right now? After weeks of steady bleeding, the price has finally arrived at a critical decision point. This isn’t just another dip; this is a major support test, and what happens next could shape the next big move.
💎#TRBUSDT has been trading inside a well-defined descending channel, with the price respecting both resistance and support trendlines in a clean, controlled structure. At the time of writing, #TRB is sitting precisely on the lower boundary of that formation, rebounding off the $12.70 zone, a level we've had marked as key support.
💎What makes this moment even more interesting is the presence of bullish divergence on the MACD indicator. This is often a strong early signal that downside momentum is fading, and that a reversal could be in play if bulls respond with strength.
💎However, this setup only becomes valid with a confirmed breakout above the descending channel, followed by a successful retest of the broken resistance. Without that retest holding with momentum, any breakout would likely be a trap. If the structure holds, the first major resistance comes in at $16.76. If momentum carries further, the next logical targets are the $23.60 to $24.48 zone, where profit-taking pressure could start to build.
💎On the flip side, all bullish expectations are invalidated if #TRB breaks below $9.91. A breakdown beneath this level would mark a failure of the current structure and likely trigger deeper downside movement. Until that happens, this remains a high-probability setup that deserves full attention.
🎖Strive for consistency, not quick profits. Treat the market as a businessman, not as a gambler.
MyCryptoParadise
iFeel the success🌴

A Comparative Study on KFINTECH vs NAUKRI-ITC-SYNGENECMP: 990
TF: Daily
The set up is very similar to that of ITC, NAUKRI and SYNGENE before their vertical fall of more than 15%.
My post explaining the same is copied below (On Naukri)
Going by this, we can expect 850-800 in the coming days on this counter
Disclaimer: I am not a SEBI registered Analyst and this is not a trading advise. Views are personal and for educational purpose only. Please consult your Financial Advisor for any investment decisions. Please consider my views only to get a different perspective (FOR or AGAINST your views). Please don't trade FNO based on my views. If you like my analysis and learnt something from it, please give a BOOST. Feel free to express your thoughts and questions in the comments section.

Falling towards key support?Aussie (AUD/USD) is falling towards the pivot, which acts as an overlap support and could bounce to the 1st resistance.
Pivot: 0.7090
1st Support: 0.7040
1st Resistance: 0.7185
Disclaimer:
The opinions given above constitute general market commentary and do not constitute the opinion or advice of IC Markets or any form of personal or investment advice.
Any opinions, news, research, analyses, prices, other information, or links to third-party sites contained on this website are provided on an "as-is" basis, are intended to be informative only, and are not advice, a recommendation, research, a record of our trading prices, an offer of, or solicitation for, a transaction in any financial instrument and thus should not be treated as such. The information provided does not involve any specific investment objectives, financial situation, or needs of any specific person who may receive it. Please be aware that past performance is not a reliable indicator of future performance and/or results. Past performance or forward-looking scenarios based upon the reasonable beliefs of the third-party provider are not a guarantee of future performance. Actual results may differ materially from those anticipated in forward-looking or past performance statements. IC Markets makes no representation or warranty and assumes no liability as to the accuracy or completeness of the information provided, nor any loss arising from any investment based on a recommendation, forecast, or any information supplied by any third party.

EURUSD after NFPYesterday, the U.S. jobs data was released.
With results better than expected, we saw the USD strengthen in the first minutes after the news.
Tomorrow, the inflation data will be released, which could determine the next move.
Mark the news candle and watch for a breakout.

EUR/JPY | Is This the Smart Money Reversal Zone?EUR/JPY is currently testing a high-confluence technical area after an aggressive bearish impulse that wiped out the latest bullish structure.
From a price action perspective, the daily candle shows a strong displacement move directly into a macro demand zone that originates from the previous imbalance. This area aligns with a Fair Value Gap (FVG) that has not yet been fully mitigated, a condition that often attracts institutional flows.
🔹 COT Data (Commitment of Traders)
The latest report shows a clear divergence between currencies:
EUR: Non-commercial traders remain heavily net long, although positioning slightly reduced. This tells me that speculative money is still structurally bullish on the euro.
JPY: Large speculators remain net short, reinforcing the broader bearish bias on the yen.
When combining the two, the medium-term positioning still favors upside on EUR/JPY.
🔹 FX Sentiment
Retail positioning shows roughly 59% of traders long.
Normally, this would suggest downside risk. However, sentiment must be interpreted in context:
The long exposure increased after the selloff.
This behavior typically reflects reactive retail positioning rather than informed flows.
In strong higher-timeframe demand, retail longs do not automatically invalidate a bullish scenario, instead, they often provide liquidity.
🔹 Seasonality
February historically transitions into a more constructive period for EUR/JPY after early-year softness.
Short-term seasonality can still produce volatility, but the broader tendency supports stabilization and potential upside rotation into March.
This strengthens the probability that the current zone acts as a reaction base rather than a breakdown level.
Technical Game Plan
I am watching two primary scenarios:
Bullish Scenario (Preferred)
If price holds above the demand/FVG area and prints a clear shift in structure on lower timeframes, I will look for continuation toward:
184.50
185.80 (volume imbalance)
186.50 macro resistance
Bearish Invalidation
A daily acceptance below the demand would signal that smart money is distributing, opening space toward the 179.50 region.
Until that happens, selling into this zone offers poor asymmetric risk.

SILVER FREE SIGNAL|SHORT|
✅SILVER price trades into premium FVG after bullish displacement. Weak follow-through and rejection suggest liquidity sweep, targeting sell-side imbalance below.
—————————
Entry: 84.18$
Stop Loss: 86.69$
Take Profit: 80.23$
Time Frame: 2H
—————————
SHORT🔥
✅Like and subscribe to never miss a new idea!✅

SCHWAB - Trying to Find SupportRight now, buyers might try to establish support around the $96 level after a swift selloff from $107.
This level coincides with the 0.618 of the micro trend that started with the low in November 2025.
The daily RSI is also about to reach the green line which is where we have seen strength start coming back into this market.
If price does see a bounce somewhere in this range, then a retest of the flag pattern is likely as new resistance.
The flag pattern is identified with the white trendline. Normally this would be a bear flag, but since the flag was established after an uptrend it is not as powerful as if it was established after a downtrend. However, if price rallies back to the upside then the bottom of this flag pattern is still likely to create the next lower high. That lower high is predicted to be somewhere between $99-$103.
One other quick hypothesis. If price continues to drop and finds support somewhere between $89-91 then it could be establishing a larger Head & Shoulders pattern. Price could then rally back towards the $99 level, create a right shoulder, then establish the bear trend.
Something I may revisit in the future.

NZDUSD H1 | Bullish Bounce Off Pullback SupportMomentum: Bullish
Price is currently above the ichimoku cloud.
Buy entry: 0.60488
- Pullback support
- 78.6% Fib retracement
Stop Loss: 0.60321
- Overlap support
Take Profit: 0.60742
- Swing high resistance
High Risk Investment Warning
Stratos Markets Limited (fxcm.com/uk), Stratos Europe Ltd (fxcm.com/eu):
CFDs are complex instruments and come with a high risk of losing money rapidly due to leverage. 69% of retail investor accounts lose money when trading CFDs with this provider. You should consider whether you understand how CFDs work and whether you can afford to take the high risk of losing your money.
Stratos Global LLC (fxcm.com/en): Losses can exceed deposits.
Please be advised that the information presented on TradingView is provided to FXCM (‘Company’, ‘we’) by a third-party provider (‘TFA Global Pte Ltd’). Please be reminded that you are solely responsible for the trading decisions on your account. Any information and/or content is intended entirely for research, educational and informational purposes only and does not constitute investment or consultation advice or investment strategy. The information is not tailored to the investment needs of any specific person and therefore does not involve a consideration of any of the investment objectives, financial situation or needs of any viewer that may receive it. Past performance is not a reliable indicator of future results. Actual results may differ materially from those anticipated in forward-looking or past performance statements. We assume no liability as to the accuracy or completeness of any of the information and/or content provided herein and the Company cannot be held responsible for any omission, mistake nor for any loss or damage including without limitation to any loss of profit which may arise from reliance on any information supplied by TFA Global Pte Ltd.
Stratos Trading Pty. Limited (fxcm.com/au):
Trading FX/CFDs carries significant risks. FXCM AU (AFSL 309763), please read the Financial Services Guide, Product Disclosure Statement, Target Market Determination and Terms of Business at fxcm.com/au

United Health - Losing $60bln in one day!📢United Health ( NYSE:UNH ) still overall remains bullish:
🔎Analysis summary:
Just within a couple of hours, United Health wiped out $60bln. And despite this massive -20% drop, United Health is approaching a major confluence of support. After we see bullish confirmation, a rejection higher is very likely to follow in the future.
📝Levels to watch:
$250
SwingTraderPhil
SwingTrading.Simplified. | Investing.Simplified. | #LONGTERMVISION
