XAUUSD: Bearish Continuation from Supply Zone?Market Context (M15):
Gold (XAUUSD) is currently exhibiting a textbook corrective recovery within a broader bearish structure. After the sharp sell-off observed on Feb 12th, price action has been consolidating within an ascending channel (purple trendlines), which often acts as a bearish flag or "dead cat bounce" before the next leg down.
Technical Breakdown:
The Supply Zone: We are currently approaching a critical resistance area between $5,062 and $5,080. This zone has historically seen strong selling pressure and aligns with previous breakdown points.
Trend Dynamics: The orange 15m EMA is providing immediate support for the current bounce. A break below this EMA and the rising channel support would confirm the shift in momentum back to the bears.
Price Targets: If the $5,080 resistance holds, we expect a reversal targeting the deep liquidity pool in the $4,666 – $4,729 "Target Zone."
📊 Trade Plan:
Bias: Bearish 🔴
Entry Area: $5,060 — $5,075 (Watch for bearish price action: pin bars or engulfing candles).
Stop Loss (SL): $5,105 (Above the structural high to allow for market "noise").
Take Profit (TP): $4,730 (Primary Target Zone).
Risk/Reward: Approx 1:8 (High-reward setup).
⚠️ Pro Tip: Monitor the US Dollar Index (DXY) for strength. If DXY breaks its recent highs, it will provide the necessary fuel for Gold to hit our lower targets. Always manage your risk and wait for confirmation before entry.
Disclaimer: This is for educational purposes only. Trading involves significant risk. Always use a stop loss.
Trend Analysis

#DOT/USDT Ready to go higher#DOT
The price is moving within a descending channel on the hourly timeframe. It has reached the lower boundary and is heading towards a breakout, with a retest of the upper boundary expected.
The Relative Strength Index (RSI) is showing a downward trend, approaching the lower boundary, and an upward bounce is anticipated.
There is a key support zone in green at 1.20, and the price has bounced from this level several times. Another bounce is expected.
The indicator is showing a trend towards consolidation above the 100-period moving average, which we are approaching, supporting the upward move.
Entry Price: 1.30
Target 1: 1.33
Target 2: 1.38
Target 3: 1.43
Stop Loss: Below the green support zone.
Remember this simple thing: Money management.
For any questions, please leave a comment.
Thank you.

BTC Liquidity Building Before a Key Breakout
Most indicators are starting to turn positive, especially liquidity behavior, which suggests accumulation around the current zone.
The bounce from this area is technically strong, but the real trigger remains clear:
A sustained move above 75K opens the path toward:
🎯 $80,000
🎯 $85,000
From a time perspective, February 18 is an important cyclical date and could act as a catalyst for a decisive move — either acceleration or rejection.
For now:
Structure is attempting to shift.
Liquidity is improving.
Momentum is stabilizing.
The next few sessions will be critical.
📅 I’ll update the chart and may go live depending on how price reacts around the 75K level.
Let’s see how the market responds.
#Bitcoin #BTC #Crypto #Gann #PriceAction #Liquidity #TradingView

BTC Elliott Wave AnalysisHello friends
We are witnessing the formation of a complete Elliott wave pattern on the Bitcoin chart.
A corrective wave is forming in the ABC range, with wave 5 of C being completed.
This wave has a 5_3_5 structure.
This decline can continue to the $73,500 range, and then the price should grow.
I will soon launch my YouTube channel to teach you both the waves and chart analysis together.
Good luck and be profitable.

EURCAD1. Weekly timeframe price shows uptrend
2. Price has move above a major resistance level and currently trading above the level.
3. The resistance level could be used as support level price could retest and move high.

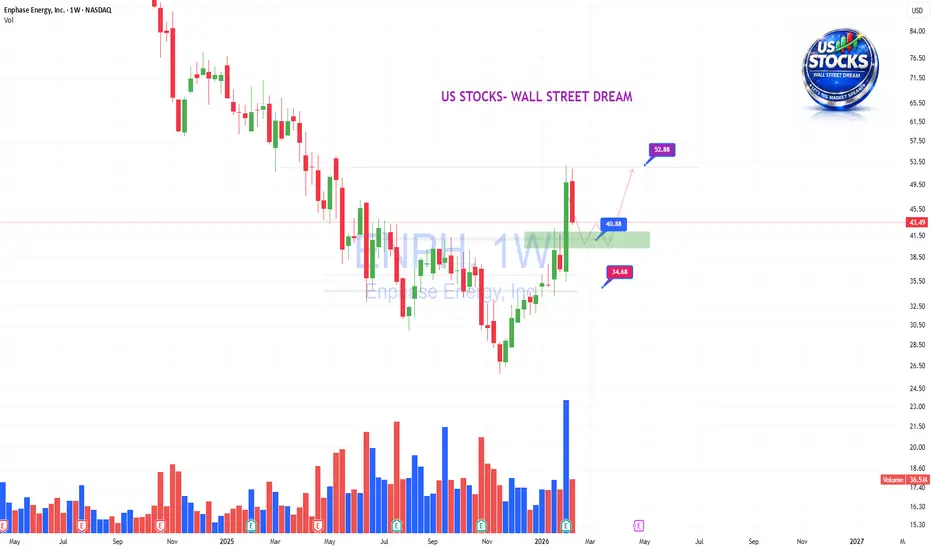
ENPH- Backtesting!NASDAQ:ENPH
.
Nice consolidation breaking out with CHOCH confirmed.
Now backtest.
.
US STOCKS- WALL STREET DREAM- LET'S THE MARKET SPEAK!
$ENSO/USDT Chart Analysis (1H Timeframe)BINANCE:ENSOUSDT is currently showing a bearish continuation setup as price retraces into a strong bearish breaker block between $1.263 – $1.270, a key supply zone where sellers previously gained control and pushed price downward.
After a clear downtrend and strong selling pressure, price is now attempting a pullback into this resistance area. If the breaker block holds, it may trigger another rejection and continuation of the bearish move.
The marked entry at $1.263 aligns with the supply zone, offering a high probability short setup with a favorable risk-to-reward structure.
✅ Trade Setup Overview
🔴 Sell Zone (Bearish Breaker Block)
$1.263 – $1.270
Strong resistance area
Institutional selling zone
🎯 Entry
$1.263 (on bearish confirmation)
🎯 Downside Targets
Target 1: $1.210 (near-term support)
Target 2: $1.143 (major liquidity zone)
❌ Risk Management
Stop Loss: $1.303
Break above supply zone → bearish setup invalidated.
📉 Market Structure Insight
Clear short-term downtrend.
Price retracing into strong supply.
Bearish market structure intact.
Further downside likely if rejection occurs from breaker block.

AUDCAD1. Price is reacting to a weekly timeframe down trend line.
2. Price is also reacting to a weekly supply level.
3. In the H4 timeframe, there is bearish engulfing candle already closed signaling price may come down.
4. Early sellers could enter the trade or wait for retest of the supply level.

BTC/USDT Liquidity Map & Order Block Analysis🚀 BTC/USDT Bullish Setup | Bitcoin vs Tether Technical Roadmap
📊 Asset: BTC/USDT — Bitcoin vs Tether
Market: Cryptocurrency
Style: Day Trade / Swing Trade
Bias: Bullish Continuation Structure
🔎 Market Structure Overview
BTC/USDT is holding above key higher-timeframe support, maintaining a bullish market structure with:
✅ Higher Highs & Higher Lows (4H / Daily)
✅ Price respecting dynamic Moving Average support
✅ Liquidity sweep completed below recent swing low
✅ RSI recovering from mid-zone (bullish momentum rebuild)
✅ Volume expansion on upside impulse
The broader crypto market sentiment remains constructive as long as BTC defends key structural demand zones.
🎯 Trade Plan
Entry:
Flexible execution — look for pullbacks into intraday demand zones, previous breakout levels, or dynamic MA support for refined risk positioning.
Target: 75,000 USDT
Major psychological resistance
Previous liquidity pool
Potential distribution zone
Overbought condition likely near that level
If price approaches this region with weakening momentum or bearish divergence, profit protection is recommended.
Stop Loss: 67,000 USDT
Below key structural swing low
Below liquidity cluster
Invalidates bullish continuation structure
⚠️ Always adjust risk based on your account size and strategy. Risk management defines survival.
📈 Technical Confluence
🔵 50 & 200 Moving Averages acting as dynamic support
🔵 Bullish order block respected on 4H
🔵 MACD momentum building
🔵 Market structure intact above previous breakout zone
🔵 Liquidity imbalance partially filled
As long as BTC trades above the 67K structural support, upside continuation toward 75K remains technically valid.
🔗 Related Pairs to Watch (Correlation Insight)
Monitoring correlated assets strengthens conviction:
ETH/USDT → Ethereum strength confirms broader crypto risk appetite. If ETH outperforms BTC, bullish continuation probability increases.
BTC/USD → Spot USD pricing gives additional macro perspective vs stablecoin pricing.
TOTAL (Crypto Total Market Cap) → Expansion confirms risk-on environment.
DXY (U.S. Dollar Index) → Inverse correlation. Strong USD = pressure on BTC. Weak USD = supportive for crypto.
NASDAQ (US100) → Positive correlation with risk assets. Equity rally often supports BTC upside.
If DXY weakens while NASDAQ and ETH push higher → bullish confluence strengthens.
🌍 Fundamental & Macro Drivers
Key economic and crypto-specific catalysts influencing BTC:
🏦 U.S. Macro Factors
Federal Reserve interest rate expectations
CPI (Inflation Data)
Core PCE
NFP (Non-Farm Payrolls)
Treasury yields movement
🔎 Lower inflation + dovish Fed tone = supportive for BTC
🔎 Strong USD + rising yields = short-term pressure
💰 Crypto-Specific Catalysts
Spot Bitcoin ETF inflows/outflows
Institutional accumulation data
On-chain exchange reserve changes
Mining hash rate trends
Stablecoin liquidity expansion (USDT supply growth)
Growing ETF inflows + declining exchange reserves = bullish supply dynamics.
🧠 Trading Psychology Reminder
Markets reward discipline, not emotion.
Secure profits when momentum weakens.
Protect capital before chasing targets.
This plan outlines structure — execution and risk control remain personal responsibility.
If this setup aligns with your analysis:
👍 Drop a like
💬 Share your target in comments
🔔 Follow for structured crypto breakdowns
Precision. Patience. Profit.

XRP Dips UNDER $2 - Are we Heading BACK TO $1 ??Have you been watching XRP lately?
I was quite surprised that it held above the $2 as long as it did, to be honest.
But now, as the entire market dips, XRP drops... and it is notoriously know to dump and lose all bullish season gains.
Apart from all the controversy, if and I say IF you managed to held the $1 bag up until now - you would be in profit. Buying over $2 would have been high risk, and now we are likely approaching another few key buy zones, depending on where the price finds a bounce. The questions is.... worth it to accumulate or not?
Seeing price action in the 4h under the moving averages is always bearish for the SHORT term, which we do:
The massive wick in July 2025 already indicated the beginning of the bear market, and the lower moving averages is likely where we will find major support - 1.40 ish.

BTCUSDT IDEA,BTCUSDT is price is entring a strong demand zone, watch here for a clear confirmation of bounce and take long. No confirmation= no trade. If price breakdown that area then avoid long.

TURBOUSDT IDEA.TURBOUSDT price is reacting from inside strong support zone. Watching for bullish confirmation here. If support hold then 0.0010 possible.

GU ShortW: Uptrend, respecting the lows
D: Uptrend, price made a new high
H4: Downtrend, price retraced 50% + retested MA
1H: Downtrend, price hit retraced 88.6% with a double-top
CURRENTLY: I'm looking for price to continue short to previous support / resistance areas

How to interpret the current movement
Hello, fellow traders!
Follow us to get the latest information quickly.
Have a great day.
-------------------------------------
The key points to watch are the HA-Low indicator and the DOM (-60) indicator.
If the HA-Low and DOM (-60) indicators provide support, then that's a good time to buy.
Accordingly, the key question is whether the price can rise after finding support in the 68687.84 ~ 70580.26 range.
-
The StochRSI 20, 50, and 80 indicators are displayed on the chart because they provide useful information for detailed trading.
The StochRSI indicator can also be viewed as an indicator that reverts to its mean based on the 50 level.
Therefore, we need to carefully monitor the trend when the StochRSI crosses the 50 level.
While the StochRSI indicator is typically interpreted based on when it enters or exits overbought or oversold levels, this provides useful information when interpreting auxiliary indicators.
Currently, the order is StochRSI 20 > StochRSI 80 > StochRSI 50.
In other words, to break out of the low zone (oversold zone), the StochRSI must rise above the 20 level. Therefore, ultimately, we can see that the StochRSI must rise above the 20 level (75719.90).
However, the StochRSI 80 level is formed at 71453.53, indicating that a short-term peak has been formed.
This suggests that the current trend is likely a rebound from a downtrend.
Even if the StochRSI rises above the 80 level, if it fails to rise above the 20 level, it is highly likely that the price will eventually decline.
However, if the price remains above the StochRSI 50 level, the upward movement may trigger a change in the positions of the StochRSI 20 and StochRSI 80 indicators, potentially signaling a continued uptrend. Therefore, it's important to monitor whether the price can remain above the StochRSI 50 level (70130.00).
-
To break above a key point or range and continue the uptrend, the StochRSI, BSSC, and OBV indicators must show upward trends.
If possible,
1. The StochRSI indicator should not enter the overbought zone.
2. The BSSC indicator should remain above the 0 level.
3. The OBV indicator should remain above the High Line.
When the above conditions are met, the uptrend is likely to continue.
The current behavior of these auxiliary indicators indicates that the conditions for a sustained uptrend are not yet met.
Therefore, when support is found near the 68,687.84 ~ 70,580.26 range, we should examine whether the above conditions are met.
-
Summary of the above:
1. Support range: 68,687.84 ~ 70,580.26
2. Beginning of a full-blown short-term uptrend: 75,719.90
3. Volatility range: 71,453.53 ~ 75,719.90
Therefore, if support is found at the support range and the trend reverses while moving sideways in the volatility range, we can interpret this as indicating a potential continuation of the uptrend.
Since indicators change position over time, their interpretation may vary depending on the position at the time of the change.
-
Thank you for reading to the end.
I wish you successful trading.
--------------------------------------------------

sbi LONG in this stock , it have retest its 1 day trendline 3 days ago , and if we follow trend resistance on weekly frame it can go up to 1370-1485 minimun , rest is your own decision

APPLE: Free Trading Signal
APPLE
- Classic bullish formation
- Our team expects growth
SUGGESTED TRADE:
Swing Trade
Buy APPLE
Entry Level - 255.79
Sl - 251.80
Tp - 264.27
Our Risk - 1%
Start protection of your profits from lower levels
Disclosure: I am part of Trade Nation's Influencer program and receive a monthly fee for using their TradingView charts in my analysis.
❤️ Please, support our work with like & comment! ❤️

DOGEUSDT at Critical Zone — Reversal Setup or Continuation LowerThe Dogecoin / Tether (DOGEUSDT) pair on the 5-Day timeframe is currently in a macro downtrend phase after failing to maintain a higher-high structure in the upper distribution zone.
Price continues to form:
Lower Highs
Lower Lows
Sustained selling pressure since rejection at the 0.28 area
At the moment, price has returned to a historical demand zone (yellow block) which previously acted as a major accumulation base before the 2024–2025 bullish impulse.
Key zone: 0.099 – 0.084
---
Structure & Pattern Formation
1. Macro Downtrend Structure
Clearly visible:
Distribution at 0.28
Structure breakdown at 0.19
Failed reclaim at 0.153
Continuation lower into demand
This confirms sellers still dominate the higher-timeframe structure.
---
2. Descending Continuation / Bearish Market Structure
Sequence observed:
LH → LL → LH → LL
Every pullback rejected at resistance
As long as there is no Break of Structure (BOS) above 0.153, the trend remains bearish.
---
3. Demand Zone Reaction Area
Yellow block (0.099 – 0.084) represents:
Previous accumulation base
Origin of major bullish impulse
Likely institutional interest zone
An early reaction is visible via a long lower wick (buying response), but no confirmed reversal yet.
---
Key Levels
Resistance
0.116 → Minor supply / recent rejection
0.153 → Structure resistance
0.199 → Mid distribution
0.284 → Macro supply
Support / Demand
0.099 → Upper demand
0.084 → Extreme demand
0.071 → Macro low invalidation
---
Bullish Scenario
Bullish continuation is valid if demand holds.
Confirmation steps:
1. Price holds above 0.099
2. Forms a base / sideways accumulation
3. Break & close above 0.116
4. BOS above 0.153
Upside targets:
0.153 (major resistance)
0.199 (mid-range)
0.284 (macro supply)
Expected structure:
Double Bottom / W pattern
Accumulation range
Formation of Higher Low
If volume enters at demand, mid-term reversal potential increases.
---
Bearish Scenario
Bearish continuation occurs if demand fails.
Main triggers:
Daily / 5D close below 0.084
Lack of significant buyer reaction
Consequences:
Macro structure breakdown
Liquidity sweep of prior accumulation
Downside targets:
0.071 (macro low)
0.060 – 0.055 (next historical support)
If this plays out → it signals distribution is not finished and the market enters a deeper markdown phase.
---
Conclusion
Macro trend: Bearish
Current position: Inside major demand
Decisive zone: 0.099 – 0.084
Most likely current phase:
Re-accumulation or
Continuation distribution before final leg down
Reaction inside this zone will determine whether DOGE prepares for a mid-term reversal or continues printing new lows.
#DOGE #DOGEUSDT #Dogecoin #CryptoAnalysis #TechnicalAnalysis #Altcoin #CryptoTrading #SupportResistance #SupplyDemand #MarketStructure #TradingViewIdeas #CryptoMarket #BullishScenario #BearishScenario #Accumulation #Distribution

zilusdt longAttention followers!
Attention followers!
Entry point: yellow
SL: red
Take profit: black
Hello dear followers.
I'd like to point out that I primarily trade with 20x leverage, and my tp1 (Target 1) is placed 2.5% from the entry point and 2.5% from each other.
I'd also like to point out that my stop-loss (SL) is also 2.5% from the entry point.
Therefore, we will lose 50% of our margin if the stop-loss is triggered, and we will gain 50% at tp1 (Target 1), 100% at tp2 (Target 2), and 150% at tp3 (Target 3) if the trade is successful.
Invest what you can afford to lose, which is between 1% and 5% of your margin.
Thank you.
zilusdt
long

SpaceUSD plan 14-02-26SpaceUSD plan 14-02-26
The price has reached the supply area,
and is consolidating there.
Slightly above it is a fresh base supply area.
We'll try to hold the price in that fresh area.
Because the price is likely seeking liquidity in that area.

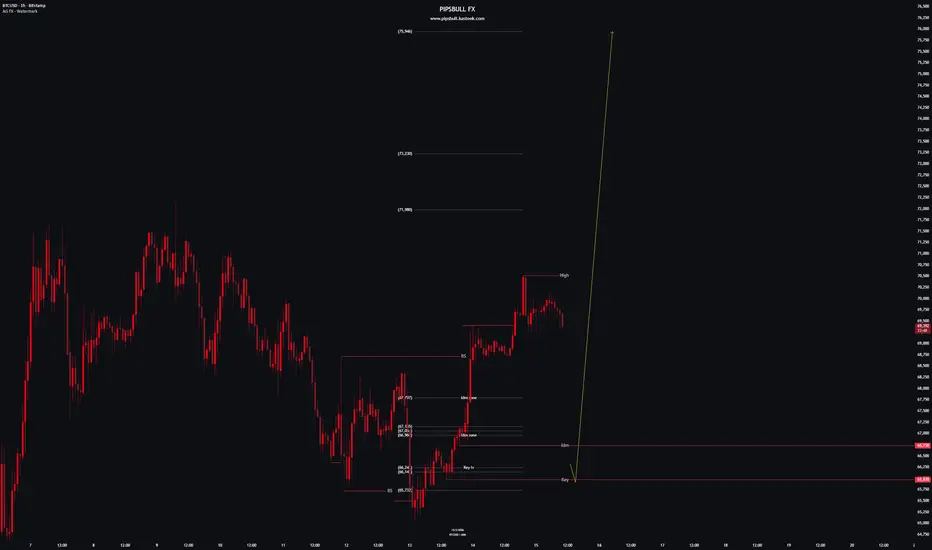
BTCUSD H1 – Key Levels Defining Bullish StructureThis idea focuses on BTCUSD on the 1-hour timeframe, highlighting price consolidation around a key structural zone following a strong bullish impulse.
After a sharp upside expansion, price reacted near the 70,300 area and has since transitioned into a controlled pullback. Current price action shows reduced momentum, suggesting the market is pausing and rebalancing after the impulsive move rather than showing immediate reversal signs.
🔎 Technical Observations:
Strong bullish impulse preceding the current consolidation
Price pulling back into a key structural / IDM zone around 66,730
65,970 acting as the key structural low defining bullish validity
Internal structure holding while momentum cools
Liquidity present both above the recent high and below the consolidation range
📌 Market Context:
This area represents a decision zone within a broader bullish structure.
Sustained acceptance above the internal displacement zone would keep the bullish framework intact, while loss of internal structure could open the door for a deeper rotation toward lower liquidity.
At this stage, price behavior reflects consolidation after expansion, not confirmation of a trend shift.
⚠️ Educational Note:
This analysis is shared to study market structure, key levels, and liquidity dynamics.
It is not intended to provide trading signals, execution guidance, or outcome predictions.
— PIPSBULL FX
The Nasdaq and the S&PThis is Sunday the 14th. I believe there's a setup for potential trades in both markets. I will be looking at the markets when they open on Sunday. even though they are the types of behavior that they have and which can create a very good return.... It's important to have context with these markets.... Instead of generating a lot of sentences here.... It's probably a little better to go to the charts and listen to them from beginning to end.


MNQ Analysis & Day Trading - Monday March 10 2025 part 2Day: 4-1, +$568.
All 1 MNQ trades, risking no more than $120.
-------------
As a learning, beginner day trader I go through the market replay predefining what I am looking for to enter a trade and walk through my thoughts as I experience the market action bar by bar throughout the entire day to see how I handle various events and assess my execution.
This is for me and others to learn if you desire.
