ETH — Price Slice. Capital Sector. 1653.90 BPC 12© Bolzen | The Architect | BPC Framework
Bolzen Market Institute
🏷 ETH — Price Slice. Capital Sector.
Publication date on TradingView: 17.02.2026
🏷 1653.90 — at the time of publication, the price had not been reached.
🏷 BPC — The Bolzen Price Covenant — Strength Index: 12
The energy block reflects the intentions of capital. The direction of capital flow is determined dynamically. The key mechanism of liquidations lies in the tendency of price to gravitate toward areas where real participants of the system are concentrated — regardless of whether they are in longs or shorts.
Such zones represent areas of asymmetric advantage: when the price approaches them, some participants are forced to close positions at a loss, others lock in profits, and a third group (institutional players) uses this flow to enter in the direction of the next concentration zone.
Institutional players generate energy blocks through miners. Subsequently, these energy blocks form the range of capital movement across various timeframes for exchange speculators. However, the ultimate goal in ensuring liquidity is to reach the energy block mark.
The results are presented in the dashboard for the international arena. It is necessary to manually determine, without third-party software, the direction of the impact node and the concentration of real system participants. This is achieved through high cognitive and intellectual effort — without templates and solely through pure chart analysis.
Three-dimensional analytics is intellectual property. The methodology is closed and does not require evaluation from the standpoint of the old world. We offer the ability to think but do not provide trading recommendations and are not educators.
We thank you and regard TradingView as an impartial platform for demonstrating the transition into a new analytical reality.
Entry Point and Market Psychology
Quantum structure of obligations and capital movement in price formation within energy blocks.
🏷 Vertical chart — Energy Grid Dashboard.
🏷 Static tape No. 1: The price is published according to the production order of the energy block.
🏷 The energy block price is already ordered — not by time but by the priority of block execution. It is important not to confuse: block priorities dynamically reorganize in response to hidden energetic impulses, while the execution order of prices fixes their manifestation in the market. Each price in the dynamic tape is linked to energy production measurement indicators, unavailable to the general public. Those who see the structure before its manifestation do not follow the price — they anticipate it.
EΞ2Φ8Ψ45Θ·ζ⁻¹·106Λ732·Ω²
📎 Screenshot:
🏷 When trading from levels, use liquidation zones from BPC 10 and higher.
🏷 Bolzen Liquidity Map — ETH (numerical equivalent of the map):
Updated versions of the Bolzen Liquidity Map — ETH are in restricted access.
The permanent Energy Grid Dashboard for ETH and BTC is publicly available and intended for international institutional review.
Dear international community,
I thank the TradingView moderation for their neutrality and support of analytical work on a global scale, as well as everyone who follows my research. This platform serves as a space to demonstrate the contribution to analytical development.
Attention and time are your key resources. ATH — is emotion; timeframes — are your best allies. Thank you.
— The Architect
BPC — The Bolzen Price Covenant
Trend Analysis

QNTUSDT Compression within the long-term rangePrice is compressing within a long-term converging range.
After a sequence of impulses and pullbacks, the structure has transitioned into an accumulation phase with reduced volatility. The current area represents a balance zone, where medium-term reversals have previously formed.
The broader context is neutral and wait-and-see: the market is building energy ahead of a structural breakout.
Key focus remains on price reaction at the range boundaries. Until a confirmed breakout occurs, price action is expected to remain range-bound and distributional in nature.

FORTINET DOUBLE BOTTOM1. Company Overview
NASDAQ:FTNT is a global leader in cybersecurity solutions, providing network security appliances and subscription services (such as firewalls, VPNs, and anti-virus software). Headquartered in the United States and listed on the NASDAQ, the company operates in a high-demand sector driven by increasing digital threats and cloud migration.
2. Timeframe & Market Context
Timeframe: Weekly (1W). Each candle represents one week of trading.
Market Context: The stock is currently in a recovery phase following a significant correction in late 2025. After dropping from highs near $115, the price found a floor around $73.
Current Trend: Short-term bullish (recovery), Medium-term neutral/sideways (within a large range).
3. Chart Pattern Analysis: Potential Double Bottom
The chart reveals a high-probability Double Bottom formation in the making.
The Pattern: This is a "W-shaped" reversal pattern. The price hit a low near $73.50 (First Bottom), rallied, returned to test that same level (Second Bottom), and is now moving higher.
Status: In progress. A breakout above the "neckline" at $87.07 is required to confirm the pattern.
Measured Move: If the pattern confirms ($87.07 breakout), the height of the formation (~$13.50) is added to the breakout point, suggesting a technical target of approximately $100.50.
4. Key Support Levels
Immediate Support ($85.50): The recent minor consolidation area and the dotted red horizontal line.
Major Support ($73.48): The established floor of the "Double Bottom." This is reinforced by historical price action and high volume nodes shown on the Volume Profile (VRVP).
Critical Support ($59.51): The "Point of Control" (POC) where the most volume has traded historically. Falling below this would signal a long-term trend breakdown.
5. Key Resistance Levels
Immediate Resistance ($87.07): The current neckline of the Double Bottom and the black horizontal line.
Major Resistance ($99.64): A heavy psychological level and previous structural peak where sellers previously stepped in.
All-Time High ($114.82): The ultimate target for long-term bulls.
6. Indicators
RSI (52.19): Currently neutral. It has climbed out of the oversold region, suggesting there is plenty of "room" to run before the stock becomes overbought.
Volume: We see a notable volume spike at the second bottom near $73, suggesting strong institutional buying (accumulation) at lower prices.
True Strength Index (TSI): Currently at -8.64 but curving upward, indicating that downward momentum is fading and a bullish crossover may be imminent.
7. Trading Scenarios
Bullish Scenario (60% Probability)
Activation: A weekly candle close above $87.07 with expanding volume.
Target 1: $95.00 (Gap fill/Moving Average resistance).
Target 2: $99.64 (Previous major structural high).
Bearish Scenario (40% Probability)
Activation: Rejection at the $87.00 level followed by a breakdown below $79.00.
Outcome: The "Double Bottom" fails, and the price likely returns to re-test the $73.48 floor or lower.
8. Stop Loss & Take Profit (Examples)
Aggressive Entry (Current Levels)
Entry: ~$85.56
Stop Loss: Below $79.00 (Recent swing low)
Take Profit 1: $99.00
R/R Ratio: ~1:2
Conservative Entry (Post-Breakout)
Entry: $87.50 (After confirmed weekly close above neckline)
Stop Loss: $82.00 (Inside the pattern range)
Target: $100.00
R/R Ratio: ~1:2.3
9. Risk Factors
Earnings: Cybersecurity stocks are highly volatile around earnings reports; check the calendar for the next release.
Market Sentiment: As a tech stock, FTNT is sensitive to interest rate changes and NASDAQ volatility.
False Breakout: The price could poke above $87.07 and immediately reverse (a "bull trap").
10. Summary
Fortinet is attempting a structural reversal via a Double Bottom.
$87.07 is the "line in the sand" for bulls to reclaim control.
Support at $73.48 has proven to be a very strong "floor."
Indicators are turning positive but remain in neutral territory.
Volume profile suggests significant interest at current levels.
Targeting the $100 range is technically feasible if the breakout holds.

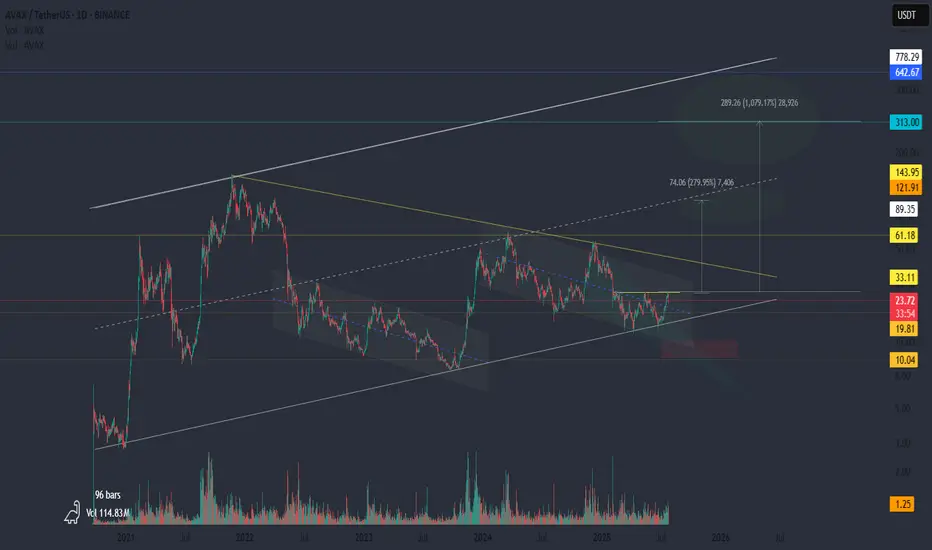
AVAX: A Quiet Rocket?This might be the calm before the cycle.
📍 All the liquidity is above.
Levels like 33 and 61 aren’t just resistance — they’re fuel. Clusters of short liquidations and forgotten limit orders are sitting right there. If we get a breakout, it could be sharp. And if there’s another pullback? Don’t panic. That would be the test — the shakeout before the move.
🚀 If the cycle kicks in, AVAX could be one of the silent leaders.
While the crowd is focused elsewhere, AVAX has been building quietly: structure, accumulation, time. The kind of setup that doesn’t scream hype, but whispers opportunity.
aprox movement for ton for the next half of the monthHere we can see the had&shoulders movement pattern for the current price and some tests of new price updates that can close the head and start to form the last right shoulder

$GBPUSD NEXT MOVE 2026 Q1B FEBRUARY 16 LONG POSSIBILITY ?EIGHTCAP:GBPUSD BULLS OR BEARS FOR 2026, It seems a breakout from this 10 months consolidation would tell if FX:GBPUSD would have a bullish or a bearish first quarter of the year.
Buyers keep in mind:
1.3278 =
1.3678 Price now but entry possibilities would present itself between this week and month's end
1.42317 = Our very first and most likely target
1.44325 = our second and likely target
1.551200 = our least likely ambitious target
CONFLUENCES :
1. HTF BIAS INDICATE POSSIBLE BULL RUN TO CREATE MSS.
2. WEAKENING Dollar index .
This is a likely possibility but im open to flow with the markets so i would update this analysis as we progress. ALWAYS REMEMBER TO DO YOUR OWN RESEARCH.

BTC/USD LongI see 2 FVGs, on 15 min & 1H time frame we have nice buy opportunity..its perfect settup

long of the VAL of the rangelong of the VAL of the range, one last fake out to take out previous low and rotation to VAH of the range

ETHUSDTI am not biased towards BBG:ETHEREUM but this chart tells me that the last support point is at $1200 and to climb above the important $1800 area we need to see a strong break above $2250... BINANCE:ETHUSDT
⚠️The crypto market is dangerous, be careful with your capital.

usdchfUSDCHF The pair has recently shown a price behavior that closely mirrors gold, with bullish momentum becoming more evident. The market has formed two consecutive higher lows, indicating strengthening buying pressure.
As long as the pair holds above the 0.758 support level, the bullish outlook remains valid, with price expected to extend toward the upside targets highlighted on the chart.

S&P 500 ES/SPX over-extended?ES/SPX has been following a series of AB=CD measured moves over the years, as marked on this chart. And typically re-tests prior highs before moving up. It is currently extended above most recent measured move target and hasn't yet retested the move from ES 6200 area. Near-term, dropping under ES 6700 will be looking for a re-test of ES 6200 area, at least. Let's see!

Goldman Sachs Wave Analysis – 16 February 2026
- Goldman Sachs reversed from support zone
- Likely to rise to resistance level 960.00
Goldman Sachs recently reversed up from the support zone between the key support level 871.00 (which has been reversing the price from December), lower daily Bollinger Band and the 50% Fibonacci correction of the upward impulse from November.
The upward reversal from this support zone formed the daily Japanese candlesticks reversal pattern Hammer.
Given the strong daily upend, Goldman Sachs can be expected to rise to the next resistance level 960.00 (top of wave b).

Ebay Wave Analysis – 16 February 2026
- Ebay reversed from support zone
- Likely to rise to resistance level 85.00
Ebay recently reversed up from the support area between the round support level 80.00 (which has been reversing the price from October), lower daily Bollinger Band and the 50% Fibonacci correction of the daily uptrend from April.
The upward reversal from this support zone formed the daily Japanese candlesticks reversal pattern Bullish Engulfing – which stopped earlier wave 2.
Given the strength of the support level 90.00, Ebay can be expected to rise to the next resistance level 85.00.

avaxusdt longInstructions:
Entry point: yellow
Stop loss: red
Take profit: black
lev x 10-20
margin 1-5%
Don't forget, above all:
always be risk and money management
Invest what you can afford to lose, which is between 1% and 5% of your margin.
Thank you.
Good luck to us all.

zilusdt longInstructions:
Entry point: yellow
Stop loss: red
Take profit: black
lev x 10-20
margin 1-5%
I'd like to point out that I primarily trade with 20x leverage, and my tp1 (Target 1) is placed 2.5% from the entry point and 2.5% from each other.
I'd also like to point out that my stop-loss (SL) is also 2.5% from the entry point.
Therefore, we will lose 50% of our margin if the stop-loss is triggered, and we will gain 50% at tp1 (Target 1), 100% at tp2 (Target 2), and 150% at tp3 (Target 3) if the trade is successful.
Don't forget, above all:
always be risk and money management
Invest what you can afford to lose, which is between 1% and 5% of your margin.
Thank you.

aaveusdt longInstructions:
Entry point: yellow
Stop loss: red
Take profit: black
lev x 10-20
margin 1-5%
Don't forget, above all:
always be risk and money management
Invest what you can afford to lose, which is between 1% and 5% of your margin.
Thank you.
Good luck to us all.

GME Solid: Ground Zero(The 3M Regime Structure)Preface: This is not a predictive chart. It is a zoomed-out macro reference of GME price action on the 3-month timeframe, meant to provide context for a larger thesis and follow-up charts on lower timeframes.
Authorship note: The framework and ideas are my own — ChatGPT helped me organize and communicate the concepts in more broadly understood terms.
Purpose of this chart: This chart is meant to show regime shifts in GME price behavior around major volatility impulse moves, not to call the next move.
Large macro channel (gray): The large corrective channel is the gray region (no boundary outlines). It is primarily defined by the volatility impulse tops in 2021 and 2024.
Macro midline (yellow): The large channel contains a yellow midline, which is partially obscured by the smaller channels. I view this midline as a macro regime pivot.
Smaller sub-channels (blue outlines): The two smaller channels split the large channel in half at the macro midline. These channels are outlined in blue and each has its own yellow centerline.
Lower sub-channel: The lower sub-channel highlights the corrective price action from the 2021 impulse up to the 2024 impulse.
Upper sub-channel: The upper sub-channel highlights the corrective price action since the 2024 impulse.
Importance of centerlines: On this timeframe, the centerlines matter as much as the channel rails. How price interacts with them is one of the most important signals in this framework.
Wicks vs bodies: On a 3-month chart, wicks into a line are meaningful rejection, while sustained candle bodies above/below a line represent acceptance.
Macro quadrants: The centerlines of the smaller channels also divide the structure into macro quadrants, which can help interpret where price is being accepted versus where it is only being probed.I label the structure into four macro quadrants, ordered from top to bottom:
Quadrant 1: upper sub-channel above its centerline
Quadrant 2: upper sub-channel below its centerline
Quadrant 3: lower sub-channel above its centerline
Quadrant 4: lower sub-channel below its centerline
Takeaways from this chart
Quadrant 1 is the “big boss of supply.” On this timeframe, price repeatedly wicks into Quadrant 1 but fails to gain acceptance with candle bodies, including after both major volatility impulse moves.
Post-2021 (the sneeze): Price spent multiple quarters oscillating between Quadrant 2 and Quadrant 3, showing prolonged indecision over where price should be accepted.
Spring 2022 regime shift: By Spring/Summer 2022, the market resolved that indecision — Quadrant 2 began behaving as supply, while Quadrants 3 and 4 became the primary arena where acceptance was fought over.
Winter 2024: Price achieved acceptance deeper into the structure, including acceptance in Quadrant 4, followed by a test of the channel boundary.
Spring 2024 volatility event: The volatility impulse launched price into the upper sub-channel, resulting in a test of upper structure (including the upper boundary).
Fall 2024: After a period of post-impulse indecision, price shifted into clearer acceptance of Quadrant 2, which remains a key macro regime marker in this framework.

MYM ShortsMYM Contract
Bearish Bias
16/02/2026
Today my bias for the MYM Contract was bearish. After this market reached a set of new ATHs, price reversed back into the daily range leaving a daily bearish Fair Value Gap. From Tom Hougaard's research into the situational analysis of the Dow, if Friday's low is lower than the low on Thursday then the probabilities are overwhelmingly high that the low of Friday will be visited on Monday. As this was a market holiday (President's Day), I am expecting Friday's low to be visited tomorrow. However, I was still going to anticipate this move today. As price action reacted off of the previous H4 high, taking the stops resting on the high, I was then watching for displacement, FVGs and CISPD. On M5 price action showed all of this criteria and I entered firstly on the CISPD and then again on the Bearish Fair Value Gap within equilibrium of the new impulse leg. My targets were decided as the hourly swing points below market.
Entry Criteria:
1) Liquidity Sweep
2) Displacement
3) Fair Value Gaps
4) CISPD

GBPUSD (Sell)Recent lows look weak and its still on a downtrend so this pair id look for sells I don't see any buys on this pair that follows my Strat so that's why I wouldn't look for buys.

CADJPY Wave Analysis – 16 February 2026- CADJPY reversed from support zone
- Likely to rise to resistance level 113.00
CADJPY currency pair recently reversed up from the support zone between the support level 112.00 (former low of wave A from January), lower daily Bollinger Band and the 50% Fibonacci correction of the upward impulse from November.
The upward reversal from this support zone is likely to form the daily Japanese candlesticks reversal pattern Morning Star.
Given the strong daily uptrend, CADJPY currency pair can be expected to rise to the next resistance level 113.00.

Elliott Wave Analysis of BTCUSDT BitcoinOn hourly chart, BTCUSDT has completed 2nd wave retracement with a complex correction combining a flat wave (W) and a zigzag (Y), retracing upto 38.6%. The next wave should be an impulse 3rd wave upwards.

Earnings calendar: Walmart, DoorDash, Palo Alto and WBD in focusIt’s a busy week ahead on the earnings calendar, with several major names across retail, technology, industrials and media set to report.
With multiple releases scheduled before the open and after the close, volatility around these windows could pick up.
If you would like platform-specific symbol details or help prepare ahead of the releases, our team is here to assist.
Here’s what to watch:
Tuesday
•Palo Alto Networks – after market close
Wednesday
•DoorDash – after market close
Thursday
•Walmart – before market open
Friday
•Warner Bros. Discovery – expected late week, timing to be confirmed.
Warner Bros. Discovery is still at the centre of an active takeover battle. WBD has an agreement with Netflix valued at around US$82.7 billion. But Paramount Skydance has come in with a higher counteroffer, estimated at roughly US$108.4 billion.
So far, WBD’s board appears to prefer the Netflix deal and has rejected eight approaches from Paramount, so far. However, activist shareholders are pushing the board to take the Paramount offer more seriously. Some analysts have suggested Paramount may increase its bid again.

Big long on monero back to $350Big long on #monero
🛑Stoploss: $319.12
🎯Target: $349.5
💰3x Reward
CRYPTOCAP:XMR
Dtt analysis suggest big relief bounce move to the upside is coming very soon. Planning to scale in once I receive another key confirmation.
