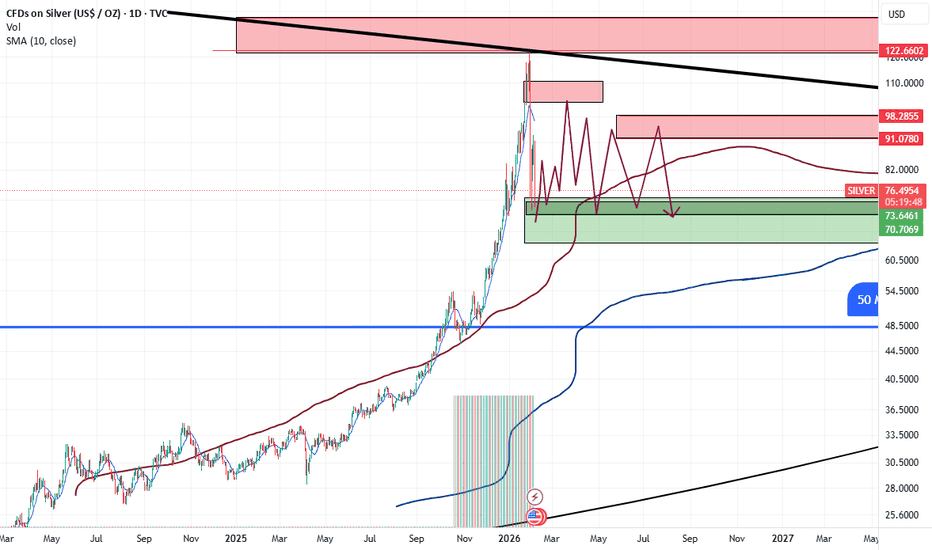
Don't Ask WHY, Ask HOW? (don't ask me)I mean it is what it is, call it what you will, where will it go, oh no who knows! Arthur Breitman is honestly just so intelligent, when you listen to him talk, he's just oozing with knowledge, how does a brain that big fit inside his skull? Some things we'll never know (maybe)!
Trend Analysis
#Nifty -1400 Points Move on Cards?Date: 30-11-2025
#Nifty Current Price: ₹ 26,202.95
Pivot Point: ₹ 26,076.70 Support: ₹ 25,713.74 Resistance: ₹ 26,442.00
Upside Levels:
L1: ₹ 26,726.85 L2: ₹ 27,011.70 L3: ₹ 27,362.33 L4: ₹ 27,712.95
Downside Levels:
L1: ₹ 25,427.72 L2: ₹ 25,141.70 L3: ₹ 24,791.08 L4: ₹ 24,440.45
#TradingView #Nifty #BankNifty #DJI #NDQ #SENSEX #DAX #USOIL #GOLD #SILVER
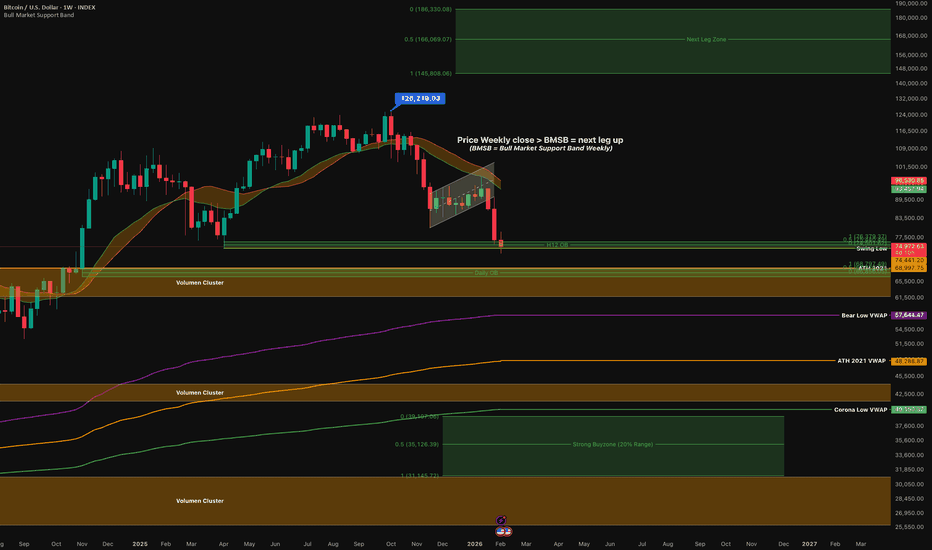
BTC Long-Term Chart – Support Zones & Personal PlaybookThis chart shows my long-term Bitcoin plan and the key support zones I’m watching over the coming weeks and months. It represents my personal playbook, not financial advice.
Not every zone needs to be revisited, but if price does return to these areas, I plan to accumulate spot positions step by step rather than all at once.
The zones are based on higher-timeframe structure, volume clusters, and major moving averages.
My focus is on patience and scaling in, not chasing momentum.
Invalidation for this idea would be a clear structural breakdown on the weekly timeframe.
As always, risk management comes first. This is just how I currently view the market and how I intend to react if price moves into these regions.
BTC Local Trend. Reversal Zone. Targets. Tactics. 23 12 25Logarithm. Time frame: 1 day.
Local downtrend. After the decline, the price is trapped in sideways consolidation for a long time (the idea is for stop-loss levels to accumulate on both sides). Price is near the breakout zone.
Buy fear in parts, sell joy in parts.
🟢 Upward breakout (trend + key local levels and, due to the short stop-loss domino effect, momentum) — fulfillment of the Dragon pattern's targets (first targets).
🔴 Downward breakout (support and long stop-loss zone) — fulfillment of the descending flag's targets (long stop-loss domino effect), at least partially.
More upside than downside, possible through stop-loss accumulation. But it's important to wait for a breakout in one direction or another.
A patient and consistent person will be rewarded, while a restless person will not.
Use trigger orders on both sides of the reversal zone:
1️⃣ for an upward breakout in the market (marker order) - 2 local zones;
2️⃣ and simultaneously for a decline - 2-3 trigger limit orders.
If you do this, you won't have to constantly monitor charts, news, opinions, and so on like a speculative addict, and you won't care at all which way the price goes. After all, your orders will trigger in the direction of the trend, and won't trigger (cancel them later) in the opposite direction. The exception is if your first orders hit a false exit, but this is taken into account in risk management and position allocation.
Risk should always be justified and controlled by you. This is the foundation of everything. If this isn't the case, you're building a speculative house on a clay foundation, trying only to guess the price. Sooner or later, it will collapse, and the later it happens, the more painful it will be.
OTHERS/BTC – Altcoins vs Bitcoin | Long-Term Bullish Setup into The OTHERS/BTC chart is showing signs of a potential long-term reversal in favor of altcoins — even while Bitcoin is breaking down on its own pairs.
After a multi-year downtrend, OTHERS/BTC is now sitting on a major historical support zone. Price has compressed into a base structure, and downside momentum is clearly weakening.
🔹 Key Technical Signals:
Monthly MACD is forming a bullish cross – often a strong early signal of trend reversal on higher timeframes.
RSI is holding above long-term support and forming a falling wedge structure, which typically resolves to the upside.
Price is stabilizing near the EMA 200 support, showing that selling pressure is drying up.
Momentum divergence is visible: price made lower lows while indicators are starting to flatten or turn upward.
🔹 Market Context:
Even though BTC is currently breaking down, history shows that altcoins often outperform after BTC dominance peaks and starts to roll over. This setup suggests that 2026 could become a bullish year for altcoins, especially in relative performance versus Bitcoin.
🔹 Trading Idea:
If the monthly MACD confirms the bullish cross and OTHERS/BTC breaks above the falling trendline resistance, it would signal the start of a new altseason cycle. This would favor rotating capital from BTC into quality altcoins for long-term positioning.
➡️ Conclusion:
Despite short-term BTC weakness, the higher-timeframe structure on OTHERS/BTC is turning constructive. If this breakout confirms, 2026 may mark the beginning of a strong altcoin outperformance phase.
XAUUSD Structural Shift: Confirmed Trendline Break & Bearish ConMarket Analysis: Gold (XAUUSD) has successfully broken below the ascending support trendline on the 15-minute timeframe, signaling a significant shift in market sentiment. This breakdown follows a rejection from the major supply zone, confirming that bearish momentum is now dominant.
Key Technical Observations:
Trendline Breakdown: The clear breach of the blue ascending trendline indicates that the previous bullish cycle has ended.
Support-turned-Resistance: The price is currently reacting to an intermediate structural level near 4,900 - 4,950. A failure to reclaim this zone will solidify the bearish bias.
Price Projection: The anticipated path suggests a series of lower highs and lower lows. Initial downside targets are set at the 4,600 support zone, with a long-term extension towards the 4,400 liquidity area.
Momentum Indicators: Higher timeframe resistance remains intact, providing further confluence for the current downward move.
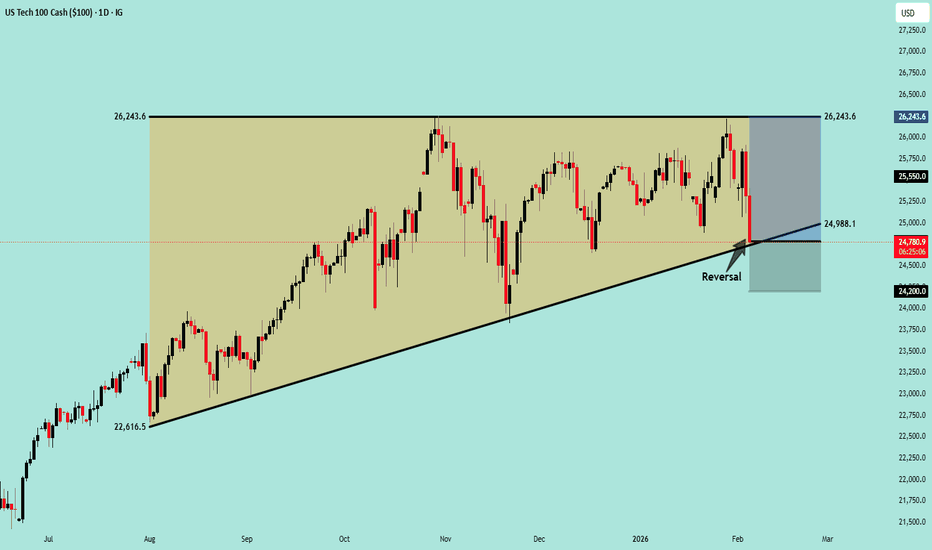
NASDAQ 100 Range Reversal Setup | Flat Top Flat Bottom (D1)NASDAQ 100 – Daily (D1) Timeframe
US Tech A clear Flat Top / Flat Bottom pattern has formed on the chart.
Price is currently moving within the range.
Price rejected from the top resistance and moved down toward the bottom support.
The bottom line is acting as a strong support level.
Buy entry is considered once a Daily (D1) candle closes above the bottom support line, confirming support holding.
Targets:
First Target: 25550.0 (Middle of the flat range)
Final Target: 26243.6 (Top flat line Resistance)
Stop loss: 24200.0 Support line below.
This setup represents a range based reversal structure, with defined risk below support and upside potential toward resistance.
This analysis is for educational purposes only and does not constitute financial advice. Always do your own research and manage risk accordingly.
CRYTPO TANKING. MY ICT ANALYSISLooking for longs on BTC at 64-66K! Watch the video for more information.
The market is collapsing, crypto, stocks, and altcoins are all under pressure.
Bitcoin, Ethereum, and TOTAL are breaking down, fear is rising, and narratives are spreading fast.
In this video, I explain why there’s no need to panic. We’re seeing extreme fear, confusion, and emotional selling and this is exactly how markets are designed to move money from impatient hands to patient ones.
I also address the Epstein narrative that’s circulating right now and explain why these types of stories often appear during major market stress. Whether true or not, they serve one purpose: amplifying fear.
This is a time for calm, discipline, and emotional control, not panic.
The market rewards those who stay rational when others lose control.
If you understand this phase, you’re already ahead of most traders.
⚠️ Disclaimer:
I am not a financial advisor. The content shared on this channel is for educational and informational purposes only and should not be considered financial advice.
Trading and investing in cryptocurrency involve high risk — you could lose some, or all, of your money. Always do your own research and make sure you understand the risks before making any financial decisions.
Historical Support Zone reached for BRZE warrants attentionsBraze (BRZE) analysis on the 1 week.
Recent price action has brought BRZE to a Major Historical Support Zone of roughly $22.77 to 24.00.
There is no price data below this zone.
We've only touched this area ONCE before in October 2022 to January 2023. Which lead to massive rally to roughly $61.00.
This recent move merits Observation and Attention on this stock.
We need to ask and look at further evidence if this price area expresses enough demand for another BOUNCE UP or we continue to SELL OFF.\
We also have a confluence of 4 indicators flashing OVERSOLD conditions on the 1 Day.
The confluence and such Oversold conditions hasnt really been seen in the history of price action for this asset.
This indicates potential for price to bounce from here in my opinion. This zone is also merits solid stop loss. Risk to reward is good in my opinion.
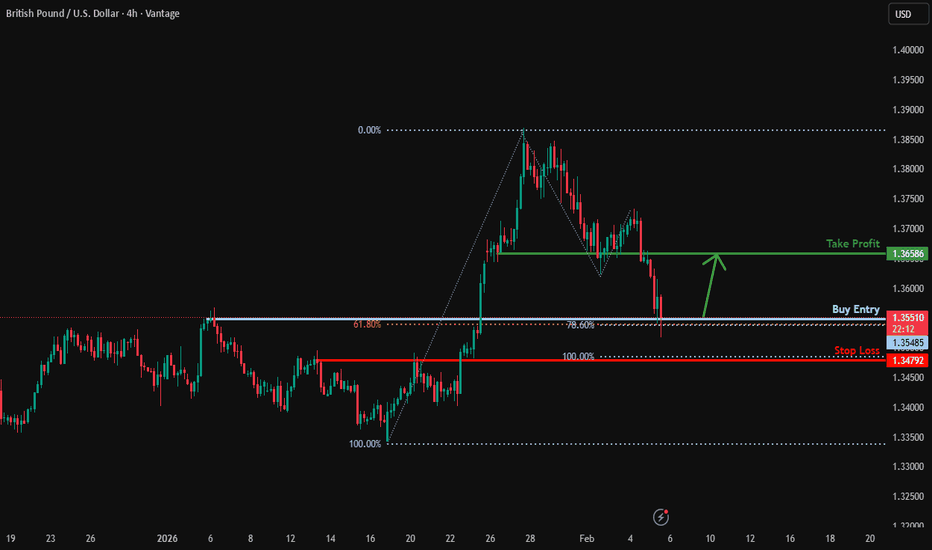
Bullish reversal off Fib levels?GBP/USD is reacting off the support level, which is a pullback support that aligns with the 61.8% Fibonacci retracement and the 78.6% Fibonacci projection, and could bounce from this level to our take profit.
Entry: 1.3548
Why we like it:
There is a pullback support level that aligns with the 61.8% Fibonaci retracement and the 78.6% Fibonacci projection.
Stop loss: 1.3479
Why we like it:
There is a pullback support level that aligns with the 100% Fibonacci projection.
Take profit: 1.3658
Why we like it:
There is a pullback resistance level.
Enjoying your TradingView experience? Review us!
Please be advised that the information presented on TradingView is provided to Vantage (‘Vantage Global Limited’, ‘we’) by a third-party provider (‘Everest Fortune Group’). Please be reminded that you are solely responsible for the trading decisions on your account. There is a very high degree of risk involved in trading. Any information and/or content is intended entirely for research, educational and informational purposes only and does not constitute investment or consultation advice or investment strategy. The information is not tailored to the investment needs of any specific person and therefore does not involve a consideration of any of the investment objectives, financial situation or needs of any viewer that may receive it. Kindly also note that past performance is not a reliable indicator of future results. Actual results may differ materially from those anticipated in forward-looking or past performance statements. We assume no liability as to the accuracy or completeness of any of the information and/or content provided herein and the Company cannot be held responsible for any omission, mistake nor for any loss or damage including without limitation to any loss of profit which may arise from reliance on any information supplied by Everest Fortune Group.
EUR/USD Bullish Reversal Setup | Inverse Head & Shoulders + RSI EUR/USD is showing early signs of a bullish reversal after an extended bearish trend. On the 1-hour timeframe, price has formed a clear Inverse Head & Shoulders pattern, supported by bullish RSI divergence, signaling exhaustion from sellers and a potential shift in momentum. With RSI holding near the neutral 50 level, this setup favors a breakout-based long entry rather than chasing price prematurely.
📊 Technical Analysis
The prior market structure remained bearish, defined by consecutive lower highs and lower lows
Price has now built a strong base and completed an Inverse Head & Shoulders, a classic bullish reversal pattern
Bullish RSI divergence confirms weakening downside momentum
RSI near 50 suggests room for expansion without overbought pressure
Entry is planned only on breakout above the right shoulder, reducing the risk of false reversals
This approach ensures structure + momentum + confirmation are all aligned before entering the trade.
🧾 Trade Plan
Pair: EUR/USD
Timeframe: 1H
Trend: Bearish (Reversal Phase)
Pattern: Inverse Head & Shoulders
Divergence: Bullish
Bias: Bullish
Execution Levels
Buy Stop: 1.18238
Stop Loss: 1.17729
Take Profit (TP1): 1.18750
Lot Size: 0.19 (1% risk on $10,000 account)
Risk : Reward: 1 : 1
🌍 Fundamental Bias
The US dollar is looking a bit weak lately as markets expect the Fed to stay cautious, which is helping EUR/USD breathe after the selloff.
On the Euro side, things look stable for now, and with risk sentiment improving, downside pressure seems limited in the short term.
🎯 Trade Insight
A confirmed breakout above 1.18238 could trigger momentum toward the 1.1875 resistance zone, while a failure below 1.1770 would invalidate the bullish structure.
⚠️ Disclaimer
This analysis is for educational purposes only and does not constitute financial advice. Forex trading involves significant risk. Always use proper risk management and trade with capital you can afford to lose.
#EURUSD
#ForexTrading
#TradingView
#PriceAction
#TechnicalAnalysis
#MarketStructure
#RSIDivergence
IREN Ready for lower $27.50Interestingly the same pattern as CRYPTOCAP:BTC which has been a leading indictor for some stock price action for some time, with stocks lagging.
Price appears to have completed wave B up, with yesterdays -17% drop.
Wave C of 4 is underway with an initial target of the 0.382 Fibonacci retracement, right at the S2 pivot and High Volume Node $27.50. The 1:1 of wave A to B.
Safe trading
NFLX Swing Trade: Oversold Setup for Multi-Day UpsideNFLX QuantSignals V4 Swing 2026-02-04
Signal: BULLISH
Horizon: 1–4 Weeks | Instrument: $85 CALL
💡 Core Thesis:
RSI extremely oversold at 18 → multi-day bounce potential
Katy AI bullish vector → target $86
Supported by strong earnings growth and fair valuation
📈 Technicals:
50DMA: $93.60 | 200DMA: $83.10 | VWAP: $83.10
MACD slightly bearish (-0.15) → potential short-term pullback
Support: $79.62 | Resistance: $116.73
⚡ Tactical Game Plan:
Entry Zone: $2.10 – $2.60 (Premium Price)
Target 1: $3.40 (+50%)
Target 2: $4.50 (+100%)
Stop Loss: $1.60 (-25%)
Alpha Expectation (R:R): 1:3
Execution: Enter on green candle close above $80, scale on VWAP reclaim
🛡 Risk Architecture:
Risk Grade: Medium
Thesis Error: Closing below $79.62 invalidates bounce
BTC triple major supportSET:BTS has arrived at the weekly 200EMA, S1 weekly pivot and major High Volume Node on weekly RSI oversold. Weekly bearish divergence has now played out. Price could go lower but this s High probability major bottom area. Wave 4 is likely to finish around the .382 Fibopnacci retracement form the 2022 bottom to 125k.
This has only ever happened 3 times with a 500%+ rally afterwards.
Sentiment is the worst it ever been for the longest at extreme fear, 11.
Safe trading
Why Rio Tinto Is a 2026 OpportunityWith Rio Tinto expected to be a key player in the coming year, driven by a supportive macro backdrop (rate cuts, fiscal stimulus, and renewed demand for industrial metals), we view the stock as a high-conviction portfolio addition. That said, timing is everything.
At this stage, two primary technical scenarios can unfold:
Scenario 1 – Rejection at first resistance (more corrective):
If Rio Tinto fails to decisively break above the $82 resistance, price may respect this level and enter a broader corrective phase. In this case, a move toward the first major confluence of support around $60 becomes likely. This zone aligns with prior structural support and would offer a far more attractive risk-reward entry for long-term positioning.
Scenario 2 – Breakout and higher consolidation (constructive):
Alternatively, a decisive break and acceptance above $82 would signal strength and open the path toward the upper resistance zone. Should price fail to break through that higher resistance on the first attempt, a healthy pullback toward the $73 support confluence would be expected. This level would act as a higher-low and potential continuation entry, assuming broader market conditions remain supportive.
At this stage, confirmation is key. Rather than anticipating the move, we will wait for price to validate one of these scenarios before committing capital. This approach allows us to align with momentum while maintaining disciplined risk management.
We will reassess the structure once either resistance or support is clearly resolved and adapt accordingly. Until then, patience remains the edge.
Safe trading, and if you have additional insights or alternative views, feel free to share them in the comments. If you agree with this outlook, your support helps this idea reach a wider audience.
SPX - Bull & Bear CyclesHistory says this bear cycle will last until March 2026 to July 2026. My guess is that if rates are cut in March 2026 then we should see progress to a bull market. The RSI still shows we are in a bull cycle, but the selling pressures as of late suggest that is about to stop.
Bull Phase Duration
458 days (Oct ’23 → Dec ’24)
304 days (Oct ’22 → Jul ’23)
456 days (Dec ’18 → Feb ’20)
731 days (Feb ’16 → Jan ’18 — extended liquidity cycle)
Takeaway:
Standard post-bear bulls cluster around 300–460 days. The 2016–2018 run is an outlier extension, not a base case.
Bear / Consolidation Duration
120 days (Jan ’25 → Apr ’25)
123 days (Jul ’23 → Oct ’23)
122 days (Sept ’18 → Dec ’18)
213 days (Aug ’15 → Feb ’16)
Takeaway:
Most corrective phases compress into ~120–125 days, with deeper macro stress extending toward ~200 days.
NZDJPY - Price Is Moving Within A Rising ChannelThis is an NZD/JPY 4‑hour chart showing an overall bullish uptrend inside an ascending channel, with a plan to buy (go long) on a pullback into a highlighted support area rather than selling the drop.
Trend and Structure 📊
Price is moving within a rising channel marked by two parallel diagonal lines, creating higher highs and higher lows, which defines a bullish market structure.
Labels like “DAILY – BULLISH” and “H4 – BULLISH” indicate that both the daily and 4‑hour timeframes are aligned upward, so the trade idea follows the dominant trend instead of fighting it. ⬆️
Current Price ActionPrice recently pushed up to the upper boundary of the channel and then sharply rejected from it, causing the current pullback you see on the right side of the chart.
This drop is treated as a correction within the uptrend, not yet a reversal, because price still trades above the lower channel line and key support zones.
Trade Idea Logic ✍️
The idea is to buy at a discount in an uptrend: enter near support with the trend, place stops below the recent swing low or below the support zone, and target the midline or upper boundary of the channel as potential take‑profit areas. 📈
If price breaks and closes clearly below the channel support and the green zone, that would invalidate the long setup here and may shift bias from bullish to neutral or bearish until a new support area is found.
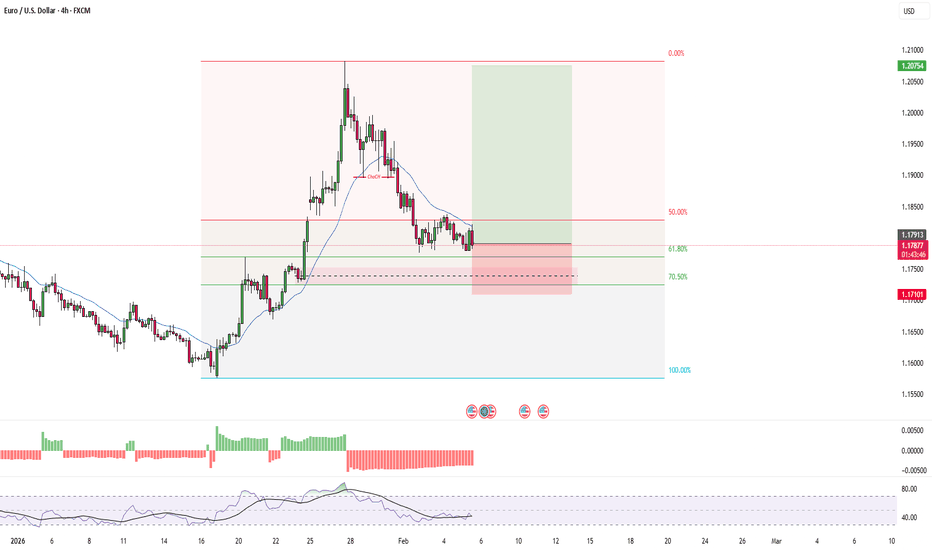
EURUSDHere is the analysis focused exclusively on EUR/USD, optimized for a TradingView publication.
🇪🇺🇺🇸 EUR/USD: Institutional "OTE" Buy Setup
Symbol: EURUSD Bias: Long (Bullish) Timeframe: 4-Hour
The US Dollar is showing signs of exhaustion, and the Euro is presenting a textbook institutional entry setup. Following a significant break of market structure (ChoCH) to the upside, the price has entered a corrective phase, offering a high-probability opportunity to join the trend at a deep discount.
Here is the technical breakdown using Smart Money Concepts (SMC).
1. Market Structure Shift
The pair has confirmed a bullish bias by breaking the previous swing high near 1.1900 with strong momentum. This impulsive move signals that control has shifted from sellers to buyers. The current decline is not a reversal, but a necessary correction to gather liquidity for the next leg up.
2. The Golden Zone (OTE)
Using the Fibonacci retracement tool from the Swing Low (origin of the move) to the recent Swing High, we can identify the specific area where algorithmic buying often steps in:
61.8% Retracement (1.1787): The price has already pierced this level, trapping early retail shorts.
70.5% OTE (1.1762): We are approaching the "Sweet Spot." This specific level (often called Optimal Trade Entry) is where smart money typically accumulates long positions to maximize Risk-to-Reward.
3. Trade Plan
We are waiting for price to tap into the 1.1760 region and show signs of rejection (wicks).
🎯 Entry Zone: 1.1760 – 1.1780 (Limit Orders)
🛑 Stop Loss: 1.1600 (Invalidation point below the 79% retracement and local structure)
🚀 Take Profit: 1.2075 (Liquidity resting above the recent swing high)
