AUDCHF: Pressure Builds at Key ResistanceAUDCHF: Pressure Builds at Key Resistance
AUDCHF is currently trading near a key technical area where price has previously reacted. The recent move shows slowing momentum, suggesting that the market is deciding between continuation and reversal.
The price is respecting a well-defined structure, with high resistance.
If AUDCHF manages to hold below the resistance area, then it will increase the chances of further declines as shown in the chart.
Given that the bullish momentum seems to have exhausted, AUDCHF could fall for correction to 0.5395. A break below this area could push it lower to the next major structure area at 0.5350.
You may find more details in the chart.
Thank you and good luck! 🍀
❤️ If this analysis helps your trading day, please support it with a like or comment ❤️
Trend Analysis

Ethereum (ETH): Smaller Timeframe Make More Sense Than Bigger RnSmaller timeframes are giving us a potential bullish setup here, which could lead the price to the $2100 area.
The movement would not be a small one if we look at it percentage-wise, which would be 9% growth but due to the fact that we were in bloody markets for the past days, this movement makes sense to us.
So during the weekend this is the movement we expect; the volume gathering is happening currently, which would most likely lead the price to BOS and then sweep the liquidity in upper zones.
Swallow Academy

GOLD ARE WE ABOUT TO SEE MASSIVE DUMP???Take a sell from 4929 SL @ 5066 (GIVES GOOD RR RATIO)
Gold has been CRAZY BULLISH FOR TIME NOW, but recent CHART start to print negative signs (making HL).
for me i will pay attention to MAIN SUPPORT ARE @ around 4497 if thats break we dip to as low as 3350 area. If thats hold then GOLD will prepare for another leg up (i can see 6297)
Anyway let see what market will give us

USDCHF - The Breakdown You Can’t Afford to IgnoreHello Traders! 👋
What are your thoughts on USDCHF?
This chart shows a bearish technical analysis for the USD/CHF (US Dollar vs. Swiss Franc) currency pair on a daily timeframe.
The overall sentiment is that the pair has broken below long-term support and is now showing signs of further weakness.
Key Takeaways
Bearish Breakdown: The price has fallen significantly below a long-standing consolidation range (the blue support zone around 0.7850).
Role Reversal: The previous "Support" (blue zone) is now acting as "Resistance." The red arrow indicates a "retest" of this level—a common technical pattern where price returns to a broken level before continuing lower.
Descending Trend: The purple lines highlight a series of "Lower Highs," indicating a sustained downward trend over the past several months.
Don’t forget to like and share your thoughts in the comments! ❤️

Gold Trade Between Premium & Discount Fed Signal XAUUSD – H1
Gold is currently in a repricing phase, not a clean trend. After a bearish BOS, price delivered liquidity into premium territory and showed clear distribution behavior. The recent push higher is corrective, engineered to rebalance inefficiencies before the next directional move.
Smart Money has already grabbed internal liquidity, then printed another BOS to the downside. This confirms a two-way liquidity environment where reactions at key zones matter more than momentum chasing.
🌐 Market Context (Today’s Hot News)
Gold volatility today is driven by:
Ongoing Fed rate path uncertainty and USD sensitivity
Market positioning ahead of US macro data & yields reaction
Risk-off flows favoring liquidity-based rotations, not trends
This backdrop supports fade-at-zone strategies aligned with Smart Money logic.
📊 Market Structure & Liquidity Read
Clear bearish BOS from prior highs
Liquidity grab into premium completed
Corrective push forming toward sell-side interest
Discount imbalance remains unmitigated below
Logic: Induce liquidity → rebalance → reprice.
Key Trading Scenarios
🔴 Premium Sell Setup – Institutional Fade
SELL GOLD: 5244 – 5246
SL: 5250
Confluence:
Premium pricing
Prior distribution zone
Liquidity delivery into highs
Expectation:
Rejection from premium → rotation back toward discount.
🟢 Discount Buy Setup – Rebalance Play
BUY GOLD: 4545 – 4543
SL: 4535
Confluence:
Deep discount (Fibo 0.786)
Liquidity support zone
Completion of corrective sell-off
Buy only after LTF bullish CHoCH / BOS confirmation.
Bias & Execution
Intraday bias: Rotational / corrective
Liquidity engineered on both sides
Patience > prediction
Wait for reaction at key zones.
Gold isn’t trending — it’s being engineered.

BTC/USDT | Dramatic drop! (READ THE CAPTION)BTCUSDT Almost hit the Weekly Bullish OB last night at 59,800, but it stopped at 60,000 in the demand zone and then went back up, currently being traded at 66,300. If it holds above 66,000, we can expect more of it, but if it fails, it may go lower to the bullish OB.

RKT road to 22$After a downtrend price is trying to stay above Fib 0.5 level. A close above $20 will push thé Price to 21-22$ in aprox 3 weeks.
NFA

Dxy about to fall Dxy is retesting the breakdown when it's complete it should start to fall 91 - 90 is the Target.

AUDUSD Will Go Down! Short!
Take a look at our analysis for AUDUSD.
Time Frame: 4h
Current Trend: Bearish
Sentiment: Overbought (based on 7-period RSI)
Forecast: Bearish
The market is testing a major horizontal structure 0.697.
Taking into consideration the structure & trend analysis, I believe that the market will reach 0.689 level soon.
P.S
Please, note that an oversold/overbought condition can last for a long time, and therefore being oversold/overbought doesn't mean a price rally will come soon, or at all.
Like and subscribe and comment my ideas if you enjoy them!

Silver - < $30/Oz coming to you by 2030I already know that this post isn't going to get any likes, and quite frankly I don't care at all. I hope you all remember this post and mark it down on your calendars; silver will trade less than $30/Oz within four years.
If you do not think that this is the standard procedure after a complete blow off top, and if you think that the price will go up forever, then I encourage you to take a look at history and see what has happened in the past.
Mark my words... the price will converge toward the 200-week SMA, which sits below $30/Oz. Your silver isn't worth the worthless fiat paper that it trades on.

SILVER (XAGUSD) — SBR Rejection + Trendline Pressure | Bearish C
After a sharp displacement move, Silver failed to reclaim the broken structure and is now reacting below a strong SBR zone. The recent upside looks corrective, not a true reversal — with price respecting a descending trendline and showing weakness near resistance.
📉 Structure Insight:
• Clean bearish momentum followed by weak pullbacks
• SBR zone acting as dynamic resistance
• Lower highs forming under trendline pressure
• Liquidity resting below recent lows
🎯 Bearish Scenario:
As long as price stays below the trendline + SBR area, downside continuation remains the higher-probability path. Current structure suggests liquidity sweep potential toward lower levels rather than sustained upside.
⚠️ Invalidation:
A strong reclaim and acceptance above the SBR + trendline zone cancels the bearish bias. Until then, patience and confirmation matter more than prediction.
This idea focuses on structure, not hype — markets reward discipline, not emotions.
If you see the same pressure building, drop your perspective below. Real discussion builds real traders.

Silver Monthly Thesis: A Multi-Decade Cup and Handle With Asymme
This is a long term thesis for silver based on the monthly timeframe. While I do not typically place heavy emphasis on classical chart patterns such as cup and handles, I believe this is a rare exception where the structure is both precise and meaningful.
On the monthly chart, silver appears to be completing a massive cup and handle formation that has been developing over the course of multiple decades. The scale and duration of this structure alone suggest that any resolution should be viewed as a long term repricing rather than a short term trade.
The cup itself is well defined, and the handle has retraced cleanly into approximately 50 percent of the cup value area. This is consistent with classical handle behavior, particularly on higher timeframes where volatility is naturally compressed. Importantly, the handle has already broken out, signaling that the structure is active rather than speculative.
Because this is a monthly pattern, I do not expect price to move in a straight line. Volatility, consolidations, and multi month pullbacks should be expected. However, as long as higher timeframe structure remains intact, I believe silver is in the process of climbing a much larger ladder.
Using a value area based measurement rather than wick extremes, the cup depth measures approximately 89 percent. Projecting that percentage expansion from the breakout zone produces a long term target near the 194 level. This is not intended to be an exact price, but rather a high level destination zone consistent with historical proportional moves following large scale consolidations.
At present, silver is interacting with the golden Fibonacci region within the monthly Fibonacci channel. This area is often associated with extended volatility and digestion rather than immediate continuation. For that reason, I expect choppier conditions and potential consolidation heading into the 2026 window. That behavior would be consistent with a market transitioning from breakout to trend development rather than exhaustion.
The duration of this structure is a critical part of the thesis. This is a cup that has taken decades to form. Moves that follow structures of this magnitude tend to express themselves over years, not months. As such, this outlook is explicitly long term and not designed for short term trading decisions.
From a relative value perspective, I believe silver offers more asymmetric upside than gold over the long run. While I remain bullish on gold and expect it to eventually challenge its prior all time highs, silver historically exhibits greater percentage expansion once secular moves begin. Platinum also has constructive potential, but silver stands out to me as the value play when measured on a percentage basis.
I do expect some tapering across the metals complex following the sharp advances seen in 2025. That does not invalidate the broader bullish thesis. It simply suggests digestion before continuation. Longer term outcomes will also depend on macro forces, including institutional positioning, monetary policy, and government intervention. A more pronounced bearish macro environment in 2026 could delay or reshape the path, but it would not automatically invalidate the higher timeframe structure.
- Scenario Probability Weighting -
These probabilities reflect current structure, timeframe, and historical behavior of long duration bases. They should be updated as new monthly information becomes available.
Primary scenario: Continued long term advance toward the 194 target zone following consolidation
Estimated probability: 55% to 60%
Alternative scenario: Extended multi year consolidation before higher continuation
Estimated probability: 20% to 25%
Bullish failure scenario: Structural breakdown that invalidates the cup and handle
Estimated probability: 15% to 20%
- Invalidation and Hypothesis Change Levels -
This thesis would be materially weakened or invalidated under the following conditions:
A sustained monthly breakdown back below the handle low, signaling failure of the post breakout structure
Loss of the broader monthly channel support with continued acceptance below it
A prolonged inability to hold above the former rim zone, indicating a false breakout rather than trend initiation
As long as silver maintains higher timeframe structure and continues to hold above the breakout region on a monthly closing basis, I remain constructive on the long term outlook.
- Summary -
This is not a short term trade idea. It is a long duration hypothesis based on a multi decade base, value area based measurement, and proportional expansion rather than nominal price targets.
Volatility should be expected. Time should be respected. But if the structure continues to hold, I believe silver has the potential to deliver one of the more compelling long term percentage returns within the metals complex.
Time and structure will ultimately determine the outcome.

GOLD H1 – CHOCH CONFIRMED, FVG HOLD COULD FUEL NEXT LEG UPMarket Context (Macro → Flow)
Gold remains highly sensitive to USD strength, yield volatility, and Fed expectations. With markets still repricing the pace of future rate cuts, capital continues to rotate defensively rather than trend cleanly. This keeps gold in a reaction-based environment, where liquidity zones matter more than momentum.
Technical Structure (H1)
Clear CHOCH confirmed after the corrective leg
Price is pulling back within the ascending channel, not a trend breakdown
Current move is a technical retracement into imbalance (FVG)
Bias stays constructive as long as demand is respected.
Key Zones (H1)
Primary BUY Zone (FVG): 4,760 – 4,689
Invalidation / Breakdown Level: H1 close below 4,689
Channel Support (soft): ~4,780
Upside Targets (If Reaction Confirms)
TP1: 4,950 (prior structure high)
TP2: 5,080 – 5,120 (channel mid / liquidity pocket)
TP3: 5,212 (major H1 resistance & extension)
Scenarios (If–Then)
Bullish Continuation:
If price holds the FVG and forms a higher low on H1 → continuation toward 5,12x–5,21x
Bearish Extension:
If H1 closes below 4,689 → structure weakens, deeper pullback likely
Trading Mindset
This is not a chase market.
Let price come into the zone → wait for confirmation → manage risk.
🧠 In volatile macro conditions, discipline at key levels beats prediction.

NQ Short (02-04-26)NAZ ready to test some lower levels under the Churn Zone. Upper move would be above 25,740 - 875 and lower under 25,413 - 284. Watch the nearby Diablo for a strong U Turn back up, look Short under or rotation lower. Yellow circles to the left are KL's lower. I will leave this Post open for awhile as this plays out.

Good zone for sell goldI think this area is a good sales opportunity. Let's see what happens. PRICE IS EVRY THING

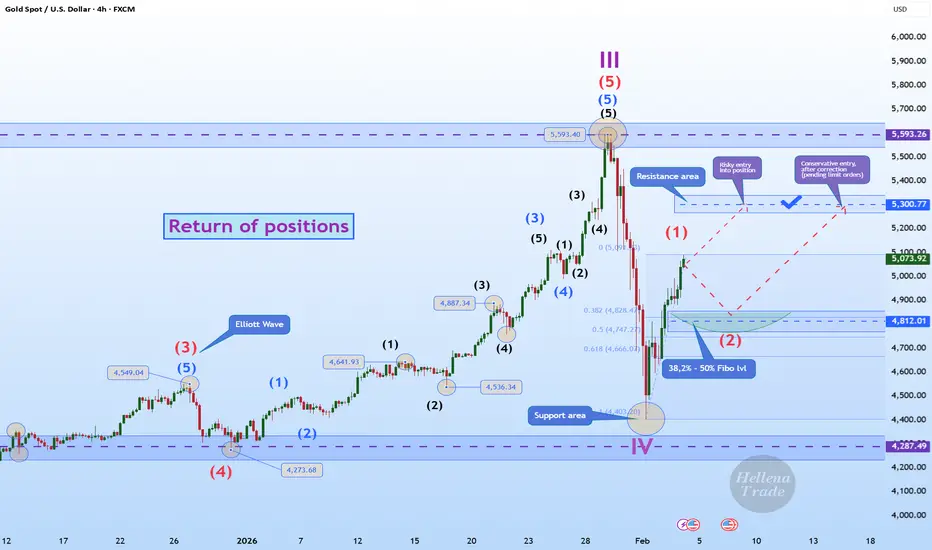
Hellena | GOLD (4H): LONG to 5300 area (Wave 3).Colleagues, the price has shown a positive upward trend, and I believe that wave “1” is either complete and wave ‘2’ correction will begin, or wave “1” will be extended.
In any case, I expect the price to reach 5300 as the nearest target. This movement after the correction will confirm the structure.
A correction in wave “2” should be expected in the range of 38.2% - 50% Fibonacci levels at 4800.
Manage your capital correctly and competently! Only enter trades based on reliable patterns!
GOLD BREAKOUT - UPSIDE OR DOWNSIDE?Price is compressing near the trendline + technical bounce zone, indicating an impulsive move is coming. Watch for confirmation.
Bullish Breakout
• Buy above: 153,600 (above falling trendline)
• T1 157,800 - T2160,000
• Invalidation - below 152,000
Rejection & Breakdown
• Sell below: 152,000( Failure to hold technical bounce zone)
• Targets: 150,200 / 148,500 /146,800
• Invalidation reclaim above 153,600
Note: This is a decision zone. Trade only after confirmation. Volatility expansion likely in the next few candles.

SilverXAGUSD
- Change of Characteristics
- Fair Value Gap
- Demand Zone
- Completed " 12345 " Impulsive Waves and " ABC " Corrective Waves
- Fibonacci Level - 78.60%

BTC USD - Bitcoin's Sharp DeclineBitcoin's Sharp Decline: A Deep Dive into Market Mechanics, Whale Behavior, and Structural Liquidity Pressures
Bitcoin recently underwent a severe and rapid price decline, briefly pushing its value toward the psychologically significant $60,000 level. This sell-off exhibited characteristics reminiscent of the cascading liquidations seen during the 2022 FTX collapse, driven not by a single, identifiable catalyst, but by a confluence of observable, mechanical pressures within the market's plumbing.
While the price has since recovered to approximately $69,800, the event underscored critical vulnerabilities and shifting dynamics. On-chain data from Glassnode highlighted the severity of the drop relative to key investor cost bases: the Short-Term Holder (STH) cost basis stood at $94,000, the Active Investors Mean at $86,800, and the True Market Mean at $80,100—all far above the spot price at the nadir. This dislocation indicates a broad swath of recent buyers were plunged into deep unrealized losses, creating fertile ground for panic and forced selling.
The Narrative Vacuum and the Search for a "Smoking Gun"
As prices fell, social media platforms, particularly X, became a breeding ground for speculative narratives attempting to explain the move. Traders floated theories ranging from a hidden Hong Kong hedge fund implosion and yen-carry trade unwinds to more exotic fears about quantum computing threats to cryptography. However, these narratives shared a common flaw: a lack of verifiable, real-time evidence. This pattern is typical in fast-moving digital asset markets; a sharp liquidation creates a vacuum that is quickly filled with speculation, often obscuring the more mundane, yet powerful, underlying drivers.
The Core Drivers: ETF Outflows, Leverage Unwind, and Whale Supply
A more durable and measurable explanation for the decline lies in three interconnected factors: persistent spot ETF outflows, a violent derivatives liquidation cascade, and on-chain signals of whale distribution.
The Erosion of the Steady Bid: Spot ETF Outflows
The landscape for U.S. spot Bitcoin ETFs has shifted dramatically from the relentless inflows seen after their launch. Data from firms like SoSo Value indicates these funds have experienced net outflows exceeding $6 billion over the past four months. This persistent selling pressure matters profoundly for market structure. Inflows provided a constant, price-insensitive source of demand that could absorb sell orders. Sustained outflows remove this "automatic dip buyer," leaving the market more susceptible to breakdowns when other forms of selling emerge. As noted by Bloomberg ETF analyst James Seyffart, ETF holders are facing their largest unrealized losses since the products launched, with the drawdown from peaks approaching 42%. This context of embedded losses can dampen the appetite for bargain-hunting among this investor cohort.
The Mechanical Cascade: Forced Leverage Liquidations
Once selling pressure pushed Bitcoin below key technical levels, it triggered a self-reinforcing cycle of forced liquidations in the derivatives market. Data from CoinGlass showed that over $1.2 billion in leveraged long and short positions were liquidated as the price descended. This process is mechanical and reflexive; when prices fall, exchanges automatically close overleveraged positions to prevent losses, which generates more selling pressure, leading to further liquidations. This dynamic can dominate price discovery in thin liquidity environments, creating the appearance of a coordinated dump when the reality is often a systemic flush of excess leverage.
On-Chain Evidence of Distribution and Capitulation
Blockchain analytics provided clear signals of distress and supply movement from large holders (whales):
Realized Losses Spike: Glassnode reported that Bitcoin's Entity-Adjusted Realized Loss hit $889 million per day on February 4th, the highest level since November 2022. This metric confirms that a significant volume of coins was being sold at a loss, indicative of capitulation.
Whale Exchange Deposits Surge: Data from CryptoQuant showed the Exchange Whale Ratio for Binance spiking to 0.447, its highest level since March 2025. This indicates that a disproportionately large share of exchange inflows came from whale-sized wallets. Furthermore, total Bitcoin inflows to Binance reached approximately 78,500 BTC in early February, with whale wallets contributing roughly 38,100 BTC (48.5%). While such deposits can be for hedging or collateral purposes, during a sell-off they are widely interpreted as preparatory moves for selling, adding to bearish sentiment.
Supply Redistribution: Santiment data revealed that wallets holding 10 to 10,000 BTC collectively reduced their holdings by 81,068 BTC over eight days, falling to a nine-month low of 68.04% of total supply. Concurrently, "shrimp" wallets (holding <0.01 BTC) accumulated to a 20-month high. This signals a distribution from large holders to smaller retail investors, a pattern often observed during corrective phases.
The Macro Context: A Broader Risk-Off Liquidity Squeeze
Bitcoin's decline did not occur in a vacuum. The move coincided with a broader risk-off sentiment across global markets. Reuters reported an unwind of leveraged positions across speculative assets, with commodities like gold and silver also selling off sharply. U.S. equities, particularly tech stocks, faced pressure as investors reassessed the timelines and profitability of massive AI investments. Additionally, concerning labor market data, including the highest January layoff announcements in 17 years, contributed to a macroeconomic environment of caution and deleveraging. As a liquidity-sensitive risk asset, Bitcoin is often one of the first to feel the impact of such broad-based portfolio rebalancing and margin calls.
Technical Framework: Key Support and Resistance Levels
For traders navigating this volatility, key technical levels provide a roadmap for potential price action:
Critical Support Zones:
Primary Support: $50,000 – A major psychological and technical level that has served as a foundational support in previous cycles.
Secondary Support: $40,000 – A deeper, stronger support zone that would represent a more severe correction but a potential long-term accumulation area.
Fibonacci Retracement Take-Profit Levels (from the recent high to the swing low):
Initial Resistance/Target: $75,587 – Corresponding to the 0.236 Fibonacci retracement.
Secondary Target: $85,273 – Aligning with the 0.382 Fibonacci level.
Major Resistance/Target: $93,101 – The 0.5 Fibonacci retracement, a key midline often watched for trend strength.
Full Trend Recovery Target: $100,929 – The 0.618 Fibonacci level, which would signal a robust recovery of the prior downtrend.
Conclusion: A Liquidity Event, Not a Fundamental Break
In summary, Bitcoin's steep decline is best understood as a complex liquidity event rather than the result of a single, hidden catastrophe. The interplay of persistent ETF outflows eroding structural support, a violent liquidation cascade in derivatives, observable whale distribution on-chain, and a broader macro risk-off mood created a perfect storm. This episode serves as a stark reminder of the market's current fragility when the steady institutional bid retreats and leverage is forcibly unwound. While the long-term thesis for Bitcoin may remain intact for many investors, the path forward is likely to be dictated by the re-establishment of a stable bid, the absorption of excess supply from large holders, and a calming of macro liquidity conditions. The identified support and resistance levels will be critical in gauging the market's healing process or vulnerability to further downside.

Taking Profit on BTC Shorts; Looking to Get Tiny Long ExposureOriginally Posted: 02/05/2026
Reposted: 02/06/2026
BTC and MSTR are at potential PCZs of Bullish Gartley; The two assets moved down leading to MSTR earnings and negative unrealized losses expectations. I do think that BTC will ultimately move back down, but from where it is now, looking at all of the downside short leverage that has been building at these lower levels, I think there is a high chance of it short squeezing to the upside and for it to be fast and violent move up to around 90-106k before then confirming a lower high and going back down to even lower lows in a fashion similar to the green projection I have drawn out. Meanwhile we could see MSTR pump back to around $200. In this scenario I would see these pumps as nothing more than Bear Cat Bounces and would be looking to reenter my shorts on these bounces where we could then continue the main bearish trade. Here is a link to a chart of the original underlying bearish trade :
If we can get a quick short squeeze we could get something similar to what we got near the end of 2019 where BTC was in a bear trend but rallied 40% in 2 days within that bear trend before continuing much lower into 2020. Here is the chart focused around that time period:
At the time it was the greatest BTC short squeeze in the history of the asset yet despite how great it was it still ultimately went lower later so I will be on the lookout for this kind of movement once more as short positions accelerate not only at the bullish trendline but also at the PCZ of Bullish Gartleys on both MSTR and BTC.
I suspect MSTR could pump 20-40% from the PCZ and in terms of BTC I think we will get price action similar to what I have projected in the white brush marker.
I actually posted this yesterday but it was taken down by a mod for dumb reasons so this is a repost which should now be compliant enough for the; Since then, BTC is already up 15% and MSTR is up over 20% but we have way more to go if my projection is correct but the best entry level was yesterday I have mainly reposted this for archival purposes.

$1.13 - $0.62 Backtest LevelsXRP needs a backtest on 1.13 and wick to 0.62.
Enjoy the rally to the ATH?.... if so, this chart is invalidated.
$0.86 is a great price to get in.

Bitcoin in a corrective phase after the euphoriaOn this weekly BTC/USD chart, we observe a reversal structure following a strong uptrend in 2024–2025, marked by the break of the ascending channel and a clear rejection below the previous highs around $110,000–$120,000.
The price has now returned to test a key support zone around $62,000–$66,000, formerly an accumulation area and market pivot, making it a decisive level for the next moves. As long as this support holds, a technical rebound toward $75,000 remains possible, corresponding to a former intermediate resistance.
Conversely, a clear break of this zone would open the way to a deeper correction toward major lower supports around $30,000, or even the extreme zone near $18,000, corresponding to the previous cycle’s lows.
The current dynamics remain fragile: the market has moved from a phase of euphoria to a corrective phase, and only a sustained reclaim of $75,000–$80,000 would restore a medium-term bullish bias, while below $62,000, the bearish scenario would clearly dominate for the coming months.

Bitcoin: The bad the good and the ugly.Bitcoin Price Analysis and Market Structure Overview
Bitcoin continues to experience elevated volatility, with recent price action showing a decisive move below prior consolidation ranges. On the daily timeframe, the structure reflects sustained selling pressure rather than a short-term pullback, suggesting that market participants are actively reassessing risk.
This analysis focuses on technical structure and historical behavior rather than price prediction.
Technical Breakdown of the Current BTC Structure
The BTCUSDT chart highlights several important zones based on Fibonacci extensions and prior market reactions:
• Sell Zone
The upper retracement area aligns with previous resistance and distribution zones. Multiple rejections from this region indicate that sellers remain dominant at higher levels.
• Acceleration to the downside
The impulsive drop below intermediate support suggests limited demand absorption in the mid range, increasing the probability of further downside exploration.
• Potential Buy Zone (reversal area)
The region near the 1.618 Fibonacci extension often attracts liquidity and short covering. This zone may act as a technical reaction point, especially if volume and momentum conditions shift.
• Macro demand region
If bearish momentum persists, historical structure points toward a broader demand range between $23,000 and $26,000, an area that previously functioned as a strong accumulation zone.
These zones represent areas of interest, not guarantees. Market conditions can change rapidly depending on liquidity, macro events, and overall sentiment.
Market Behavior During High Volatility
Strong directional moves often impact more than price alone. Network activity, transaction congestion, and execution speed can also become relevant during volatile periods.
During sharp market moves:
• Traders sometimes use BTC swap services instead of spot trading to reposition exposure without relying on order books.
• Privacy-focused users may rotate through XMR swap routes when market uncertainty increases.
• High network usage can result in delayed or unconfirmed Bitcoin transactions, especially during periods of heavy selling or panic.
These behaviors are common during volatility and are not tied to any specific market outcome.
Infrastructure Considerations
In fast-moving markets, some users rely on non-custodial tools to manage execution and transaction flow.
For example:
Crypto Swap is commonly used for direct BTC swaps and XMR swaps without accounts or custodial risk.
A Bitcoin accelerator may be used when a transaction becomes stuck due to mempool congestion, particularly during high-volume market events.
Such tools do not influence price direction but can help users manage operational issues that arise during volatile conditions.
Conclusion
This analysis outlines a technical view of Bitcoin’s current structure based on historical price behavior and Fibonacci extensions. It is not a forecast and should not be interpreted as financial advice.
Understanding market structure is important, but understanding execution, swaps, and transaction handling during volatility is equally relevant for participants operating in the Bitcoin ecosystem.
Always conduct your own research and assess risk independently.
