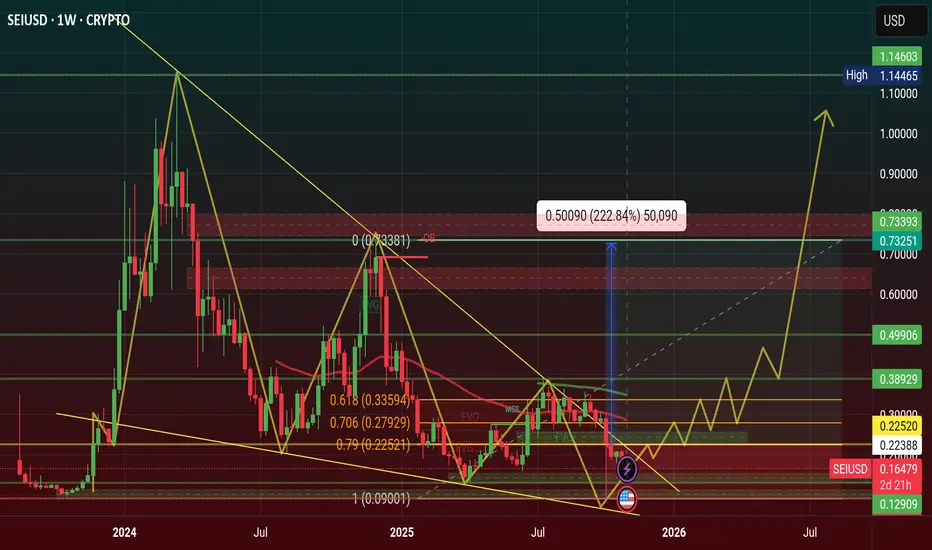
$SEI Price will hit $1.22 in 2026, Falling Wedge Pattern WeeklySEI price is showing a Bullish Pattern of Falling Wedge Pattern, when this pattern will create on chart after price will be upward direction.
Price Will hit $1.11 in 2026 and 2027 is $2.22, $3.33
Entry Point is $0.22, $0.27, $0.33 and Stoploss point $0.09
2026 Target point $0.49, $0.77, $1.11
2027 Target point $2.22, $3.33
#trending #Highlight #trendingideas #SEI #SUBROOFFICIAL
Disclaimer: This article is for informational purposes only and does not constitute financial advice. Always conduct your own research before making any investment decisions. Digital asset prices are subject to high market risk and price volatility. The value of your investment may go down or up, and you may not get back the amount invested. You are solely responsible for your investment decisions and Binance is not available for any losses you may incur. Past performance is not a reliable predictor of future performance. You should only invest in products you are familiar with and where you understand the risks. You should carefully consider your investment experience, financial situation, investment objectives and risk tolerance and consult an independent financial adviser prior to making any investment.
Trendingsignal
$XAU will hit $5,555 Incredible Price In 2026Gold Price Showing Bullish Accending Triangle Pattern in chart, this pattern move Upward Direction and price up ATH area. than price Consolidate this area than price Move Up $4,545, $4,747, $4,949 area and $5,252 area in 2026, Surprised Price Will Be $5,555 best of the year of Gold.
TVC:XAU Buy Position Setup
Three Buy Zone of Golden Fibonacci levels, areas is $3,933, $3,980, $4,029, it's a Key Support area. Stoploss area $3,815 and it's Strong Support areas.
Dynamic Resistance area Is new ATH area $4,398, and Three Target area, $4,103, $4,233, $4,375, of 11.11% Roi. if price up Retested than Breakout Key Support area.
#gold #smartmoneyconcept #highlight #XAU #SUBROOFFICIAL
Disclaimer: This article is for informational purposes only and does not constitute financial advice. Always conduct your own research before making any investment decisions. Digital asset prices are subject to high market risk and price volatility. The value of your investment may go down or up, and you may not get back the amount invested. You are solely responsible for your investment decisions and Binance is not available for any losses you may incur. Past performance is not a reliable predictor of future performance. You should only invest in products you are familiar with and where you understand the risks. You should carefully consider your investment experience, financial situation, investment objectives and risk tolerance and consult an independent financial adviser prior to making any investment.

$PUMP Pumping Hard this Bull Run $0.011220 in 2026 NYSE:PUMP COIN INFO
Support Level Price $0.002259 and Resistance level price $0.008969 and it's a Historical ATH level price $0.008999 , in 2026 parabalic bull run price will rising $0.011222 surge 222% Roi in 3 months
Pump.fun’s native token PUMP has quickly become one of the most talked-about memecoins in the Solana ecosystem. Built as a creator-first launchpad, Pump.fun lets communities directly back their favorite creators while sharing in their success.
With its viral “no-code” model, Pump.fun aims to disrupt traditional Web2 social platforms and carve a dominant role in Solana’s DeFi landscape.As of writing, the PUMP price has proven to be a bigger attraction after showing fantastic price action in Q3 2025. As a result, the token has surged in popularity across exchanges and social media, and many experts are raising questions about its potential to climb even higher in the coming years.
Major Developments That Fueled PUMP’s Rally
The Q3 saw many altcoin’s rally including PUMP, this happened with a trigger from Binance US listing. It turned out as a major catalyst for the surge in PUMP price, accompanied by a 350 million PUMP reward campaign that caught traders’ attention. In September alone, PUMP gained over 180% to $0.00899 creating a new ATH before a pullback.
Meanwhile, Pump.fun has been using more than 98% of its platform revenue to buy back tokens, directly supporting price action. This aggressive strategy has turned Pump.fun into one of the most profitable DeFi projects on Solana, boosting trader confidence.
PUMP.Fun Price Analysis For October 2025
From a short-term technical viewpoint, the PUMP price chart showed significant strength in Q3, marked by a breakout from a slanted double-bottom pattern. This bullish momentum successfully drove the price to an All-Time High (ATH) of $0.00899 by mid-September.
Following the ATH, a period of profit-taking began, which was severely accelerated and worsened by a massive market liquidation event from Oct. 10 to 11.
This event was triggered by the re-emergence of conflicts between the US and China over trade tariffs, which rattled not just the crypto sector but the entire financial landscape. This pressure pushed the PUMP price down sharply to the critical support area of $0.0035 to $0.0036. Investors are trying to sustain the price damages at this foundational support, as a reason why its consolidating at support, currently.
Pump.fun Price Surges – Is $0.0075 Possible?
Pump.fun has walked into October with a powerful burst, as its price jumps up by 16.55% overnight to $0.006422. With a market cap now towering at $2.26 billion and trading volume spiking 37.53% in 24 hours, Pump.fun sits squarely in the crypto spotlight. This momentum isn’t coming out of nowhere, as I’m seeing decisive moves by major holders, explosive social buzz, and promising technical signals. Let’s break down what’s fueling this trend and what could come next.
Why is PUMP’s Price Up?
Pump.fun’s recent price surge is rooted in three interconnected factors. First, whale accumulation is picking up big-time. Over 24,000 wallet addresses now hold at least 10,000 PUMP tokens, matching a massive 70% price run in September. In my view, when whales move in sync, it often sparks broader investor confidence and can preface new highs. However, with 60% of ICO-era whales still in play, there’s the risk of sudden profit-taking if these giants decide to cash out.
Second, social media is supercharging attention, but not without controversy. Solana’s Anatoly Yakovenko recently called Pump.fun a contender to rival TikTok. Thereby, citing its livestreaming tools and crypto-native monetization twist. That comment alone stoked a fresh wave of speculation and saw the token climb 90% over the past month. Still, protocol revenue has actually fallen 72% in the last two weeks, and fewer fresh tokens are launching, signaling a possible cooling off beneath all the hype.
PUMP Price Analysis
Technically speaking, Pump.fun price has reclaimed its 7-day SMA at $0.0055 and now eyes the $0.0075 resistance. The 4-hour chart shows a clear ascending channel, suggesting traders expect more upside. The RSI sits at 64.95, under the classic overbought threshold, which means there’s still some runway before euphoria peaks.
Is it safe to invest now, considering whale activity?
Whale moves can lift prices but also cause sharp drops if they exit. If Pump.fun holds above $0.0065, it could be bullish, but watch for signs of profit-taking or declining protocol engagement.
Where is resistance, and what comes next?
Immediate resistance sits around $0.0075, breaking above this could confirm a new uptrend.
#Write2Earn #BinanceSquareFamily #Binance #PUMP #SUBROOFFICIAL
Disclaimer: This article is for informational purposes only and does not constitute financial advice. Always conduct your own research before making any investment decisions. Digital asset prices are subject to high market risk and price volatility. The value of your investment may go down or up, and you may not get back the amount invested. You are solely responsible for your investment decisions and Binance is not available for any losses you may incur. Past performance is not a reliable predictor of future performance. You should only invest in products you are familiar with and where you understand the risks. You should carefully consider your investment experience, financial situation, investment objectives and risk tolerance and consult an independent financial adviser prior to making any investment.

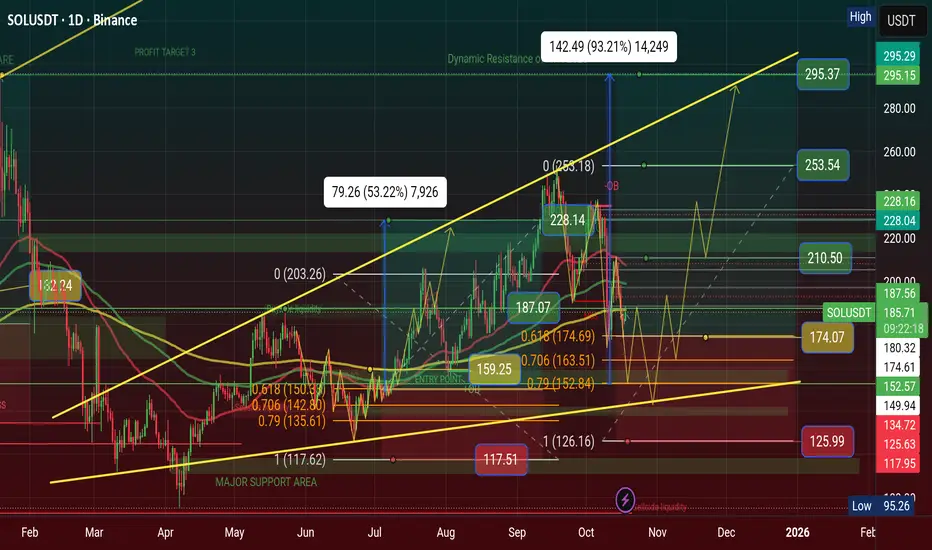
$SOL Showing Inverse Descending Triangle Pattern, $333 in 2026 CRYPTOCAP:SOL Showing Inverse Descending Triangle Pattern, $333 in 2026
💹 Inverse Descending Triangle Pattern
When This pattern will showing a chart than Price is waveing Descending Triangle Range of areas. Price will showing inverse and price moved too. we can make a trade plan to High area and low area. I'm using my Golden Fibonacci Tool, there are 3 point area of Buy position.
💲Position Setup: Open Long Position have 3 point areas, $152, $163, $174 and stoploss below area is $117. The Major Support Area is $101—$111 and Dynamic Resistance of ATH area is $293. My Long Position Target areas $210, $253, $293 and Incredible Price Target $333 areas in 2026
My Previous Long Setup will Hit $228 and complete my Trades. you can see my Previous analysis on this chart and now Waiting for confirmation of golden zone of Golden Fibonacci tool areas.
#Write2Earn #BinanceSquareFamily #Binance #SOL #SUBROOFFICIAL
Disclaimer: This article is for informational purposes only and does not constitute financial advice. Always conduct your own research before making any investment decisions. Digital asset prices are subject to high market risk and price volatility. The value of your investment may go down or up, and you may not get back the amount invested. You are solely responsible for your investment decisions and Binance is not available for any losses you may incur. Past performance is not a reliable predictor of future performance. You should only invest in products you are familiar with and where you understand the risks. You should carefully consider your investment experience, financial situation, investment objectives and risk tolerance and consult an independent financial adviser prior to making any investment.
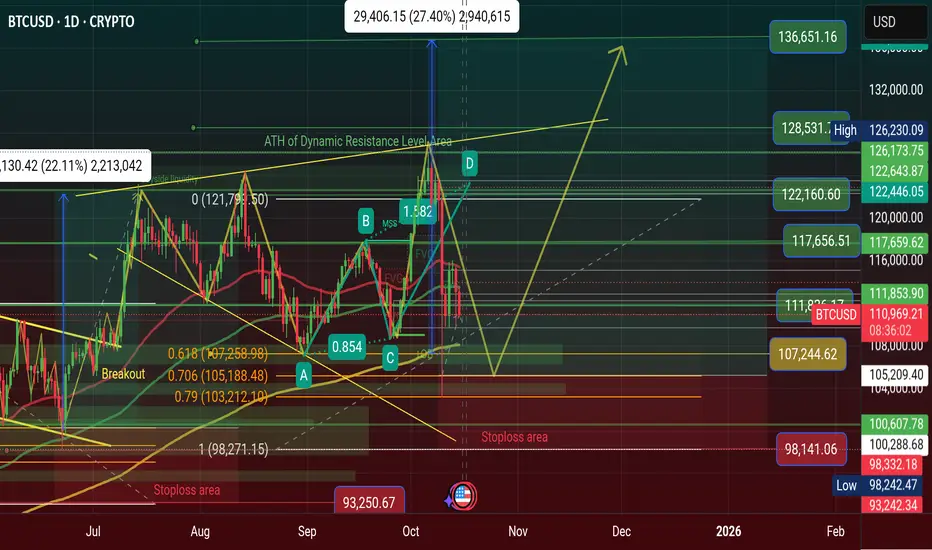
$BTC is showing a Unique Bullish Megaphone Pattern in ATH area, CRYPTOCAP:BTC is showing a Unique Bullish Megaphone Pattern in ATH area, Price will Hit $136K soon 2026
🚀 Dear, Binancians, My BTC Price Prediction will hit $136K in 2026 see on chart.
📈 Chart Analysis: Price is showing a Unique Bullish Megaphone Pattern and this is a Continuation Bull run Pattern. This Pattern is Very Rarely and it's made with on ATH areas. There is a False Breakout after the price will drop to support areas $105K - $108K and than pumping price very sharply. The price goes ATH area than falls breakout to Retested after Price will Break ATH areas. ATH area is a Dynamic Resistance area. When Fill this pattern it will be happened for $136K price areas 2026.
📊 Trading Setup: BTC Long Position setup guidelines: Major Support Areas is $98K and Dynamic Resistance area is ATH areas $126K, I'm using my Golden Fibonacci level for entry. There is 3 point of entry area is $103K, $105K, $108K and it's a Spot Position Entry point areas. Stoploss area is $98K and it's a support area. Profit the Target area is $111K $117K $122K $128K $136K.
#Write2Earn #TrumpTariffs #BTC #MarketPullback #SUBROOFFICIAL
Disclaimer: This article is for informational purposes only and does not constitute financial advice. Always conduct your own research before making any investment decisions. Digital asset prices are subject to high market risk and price volatility. The value of your investment may go down or up, and you may not get back the amount invested. You are solely responsible for your investment decisions and Binance is not available for any losses you may incur. Past performance is not a reliable predictor of future performance. You should only invest in products you are familiar with and where you understand the risks. You should carefully consider your investment experience, financial situation.
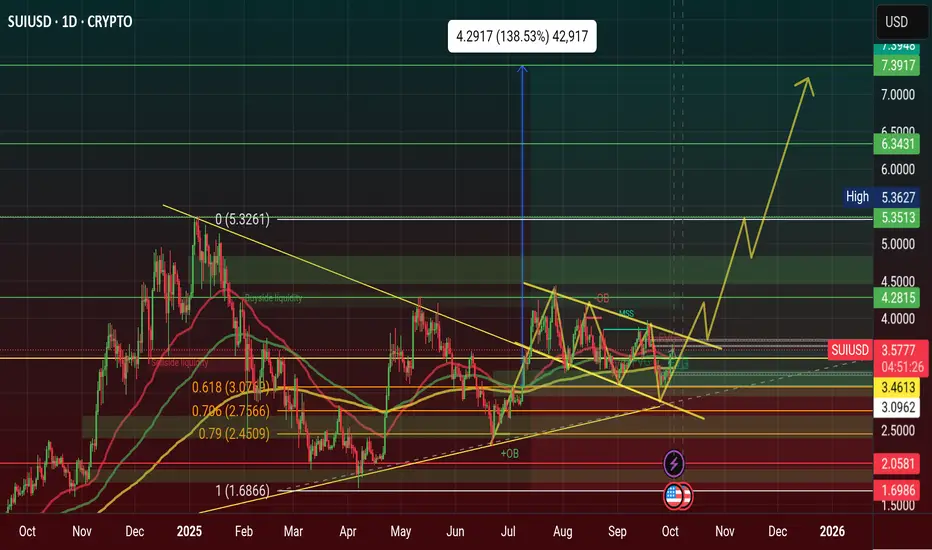
$SUI Showing a Bullish Flag Pattern Day Chart $7 Soon 2026CRYPTOCAP:SUI Showing a Bullish Flag Pattern Day Chart $7 Soon 2026
CRYPTOCAP:SUI was Showing a Reversal Pattern and now Reverse the Price. 3 Weekly showing a Bullish Flag Pattern in Day Chart. It's a Continuation Pattern. It's going to Upward Movement on Directly.
CRYPTOCAP:SUI Strong Support $2, Open position $3 and Strong Resistance $5, Never forget Target $7 and $11 in 2026
#Write2Earn #BinanceSquareFamily #Binance #SUI #SUBROOFFICIAL
Disclaimer: This article is for informational purposes only and does not constitute financial advice. Always conduct your own research before making any investment decisions. Digital asset prices are subject to high market risk and price volatility. The value of your investment may go down or up, and you may not get back the amount invested. You are solely responsible for your investment decisions and Binance is not available for any losses you may incur. Past performance is not a reliable predictor of future performance. You should only invest in products you are familiar with and where you understand the risks. You should carefully consider your investment experience, financial situation, investment objectives and risk tolerance and consult an independent financial adviser prior to making any investment.
$BTC SURPRISED $123K PROFIT DONE ($111K-$122K)CRYPTOCAP:BTC SURPRISED STEP BY STEP
$111K $115K $122K
2026 WILL MORE SURPRISED 2028 OF FUTURE
$122K $133K $144K $155K $166K $177K $188K $199K $211K
Bitcoin (BTC) to Hit Standard Chartered Predicts
At press time, it is trading within striking distance of a neW record high at $123,646.
The cryptocurrency's current record high of $124,517 was logged on Aug. 14 on Bitsamp. tandard Chartered believes that a prolonged shutdown will be bullish for Bitcoin. Kendrick has noted that Bitcoin has a positive correlation with U.S.
Treasury term premiums, which represent the extra yield that comes with holding longer-term bonds. They are currently on the rise due to significant uncertainty caused by the U.S. government shutdown.
Polymarket odds
According to Polymarket bettors, Bitcoin currently has a 7% chance of surpassing $200,000. At the same time, the odds of Bitcoin surpassing $135,000 as early as this October currently stand at 32%.
Meanwhile, there is also a 5% chance of Bitcoin dropping back below $100,000 this October.
#Write2Earn #BinanceSquareFamily #Binance #BTC☀ #SUBROOFFICIAL
Disclaimer: This article is for informational purposes only and does not constitute financial advice. Always conduct your own research before making any investment decisions. Digital asset prices are subject to high market risk and price volatility. The value of your investment may go down or up, and you may not get back the amount invested. You are solely responsible for your investment decisions and Binance is not available for any losses you may incur. Past performance is not a reliable predictor of future performance. You should only invest in products you are familiar with and where you understand the risks. You should carefully consider your investment experience, financial situation, investment objectives and risk tolerance and consult an independent financial adviser prior to making any investment.

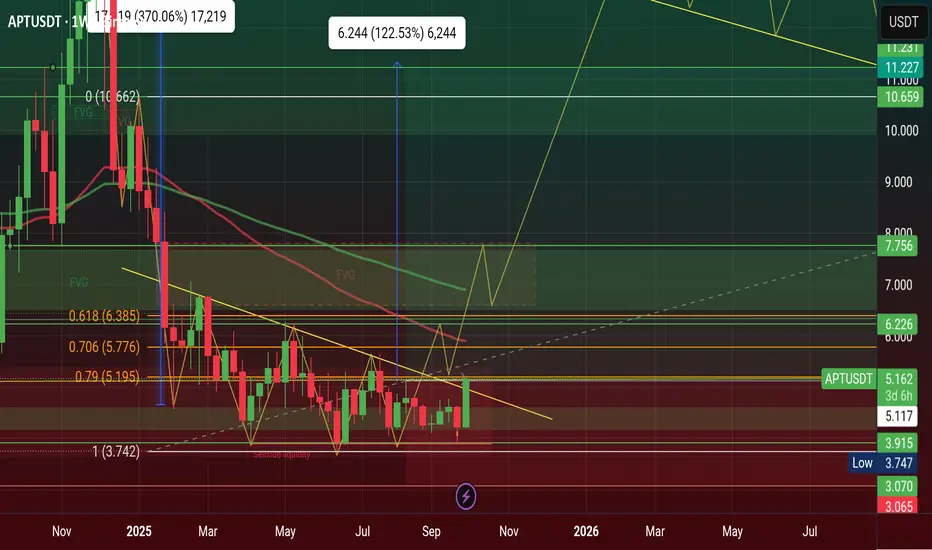
$APT Surprised $5.11 Today & Breakout Confirmed AMEX:APT Surprised $5.11 Today & Breakout Confirmed, price will Drive $11 on this 4th Quarter of 2025
Here’s Why Aptos (APT) Price Is Up Today
Aptos price is having a strong day, up more than 10% and now trading around $5.06, with trading volume climbing by 16%. The move comes after a series of bullish developments that have given traders plenty to get excited about.
One of the main reasons behind the surge is Aptos’ new partnership with World Liberty Financial (WLFI). Together, they’re bringing the USD1 stablecoin onto the Aptos blockchain, with the launch expected by October 6.
USD1 is already the fifth-largest stablecoin with a market cap of about $2.7 billion, and its arrival on Aptos is seen as a major liquidity boost. Stablecoins usually drive more DeFi activity, and APT’s price jump from $3.92 to $4.86 right after the news shows just how much optimism this created.
What the APT Chart Is Showing
Looking at the 4-hour chart, Aptos price has broken out of a downtrend that kept it under pressure for weeks. The price pushed up from the $4.20 support zone and is now testing resistance just above $5. The rally marks the strongest momentum since early July.
The RSI is approaching 70, showing strong buying strength but not yet at extreme overbought levels. The MACD is firmly green, and the widening histogram signals fresh momentum on the upside.
Open interest is holding near 8.97 million, while net shorts are dropping, a sign that sellers are closing out positions. Net longs remain steady, suggesting this move is being powered more by new inflows than leveraged bets.
If Aptos price can maintain its position above the $5 level, the next significant test will be around $5.40 to $5.60, which corresponds to the last local high. On the other hand, if the rally cools, $4.60 is the first support zone to watch.
APT Price Short-Term Outlook
Aptos looks strong going into October. The combination of fresh liquidity from the stablecoin launch and a new institutional product gives it both hype and substance.
If the bullish momentum continues, a push toward $5.60 seems realistic in the short term, with room for a run toward $6.20 later this month.
Of course, holding above $5 is key. As long as Aptos price defends that level, the trend favors the bulls. Right now, the market seems to agree that Aptos has found fresh energy at just the right time.
#Write2Earn #BinanceSquareFamily #Binance #BTC☀ #SUBROOFFICIAL
Disclaimer: This article is for informational purposes only and does not constitute financial advice. Always conduct your own research before making any investment decisions. Digital asset prices are subject to high market risk and price volatility. The value of your investment may go down or up, and you may not get back the amount invested. You are solely responsible for your investment decisions and Binance is not available for any losses you may incur. Past performance is not a reliable predictor of future performance. You should only invest in products you are familiar with and where you understand the risks. You should carefully consider your investment experience, financial situation, investment objectives and risk tolerance and consult an independent financial adviser prior to making any investment.
$BNB Chart Showing Bullish Flag Pattern and Price Will Hit +$750CRYPTOCAP:BNB Previously Chart showing Bullish Inverse Head and Shoulder Pattern and Gain Profit of Range. It's a Reversal Pattern .
Now Chart Showing a Bullish Flag Pattern and it's Continuation Pattern. Time to Bullish for BNB Coin for FOMC 10th July Thursday 2025.
The upsloping 20-day EMA and the RSI just above the midpoint indicate a slight edge to the bulls. If the $665 resistance falls, the BNBUSD pair could rise to $675 and then to $698.
Sellers are likely to pose a solid challenge at $698 because a break above it could propel the pair to $732. I'm guess BNB Price Breakout of ATH and $888 Mystery will Happen.
This optimistic view will be negated in the near term if the price turns down and breaks below the moving averages. The pair may then drop to $636.
NEWSBTC: BNB Price Gears Up for Upside Break — Will Bulls Deliver?
BNB price is gaining pace above the $650 support zone. The price is now showing positive signs and might aim for more gains in the near term.
BNB price is attempting to recover from the $620 support zone.
The price is now trading above $655 and the 100-hourly simple moving average.
There is a key contracting triangle forming with resistance at $662 on the hourly chart of the BNB/USD pair (data source from Binance).
The pair must stay above the $655 level to start another increase in the near term.
BNB Price Eyes More Gains
After forming a base above the $620 level, BNB price started a fresh increase. There was a move above the $645 and $650 resistance levels, like Ethereum and Bitcoin.
The price even surged above the $660 level. A high was formed at $666 before there was a downside correction. The price dipped below the 50% Fib retracement level of the upward move from the $650 swing low to the $666 swing high.
The price is now trading above $655 and the 100-hourly simple moving average. On the upside, the price could face resistance near the $662 level. There is also a key contracting triangle forming with resistance at $662 on the hourly chart of the BNB/USD pair.
The next resistance sits near the $665 level. A clear move above the $665 zone could send the price higher. In the stated case, BNB price could test $672. A close above the $672 resistance might set the pace for a larger move toward the $680 resistance. Any more gains might call for a test of the $700 level in the near term.
Another Decline? If BNB fails to clear the $662 resistance, it could start another decline.
Initial support on the downside is near the $655 level and the 61.8% Fib retracement level of the upward move from the $650 swing low to the $666 swing high. The next major support is near the $650 level.
The main support sits at $644. If there is a downside break below the $644 support, the price could drop toward the $632 support. Any more losses could initiate a larger decline toward the $620 level.
Technical Indicators
Hourly MACD – The MACD for BNB/USD is gaining pace in the bullish zone.
Hourly RSI (Relative Strength Index) – The RSI for BNB/USD is currently above the 50 level.
Major Support Levels – $655 and $650.
Major Resistance Levels – $662 and $665.
#Write2Earn #BinanceSquareFamily #BinanceTurns8 #BNB #SUBROOFFICIAL
Disclaimer: This article is for informational purposes only and does not constitute financial advice. Always conduct your own research before making any investment decisions. Digital asset prices are subject to high market risk and price volatility. The value of your investment may go down or up, and you may not get back the amount invested. You are solely responsible for your investment decisions and Binance is not available for any losses you may incur. Past performance is not a reliable predictor of future performance. You should only invest in products you are familiar with and where you understand the risks. You should carefully consider your investment experience, financial situation, investment objectives and risk tolerance and consult an independent financial adviser prior to making any investment.

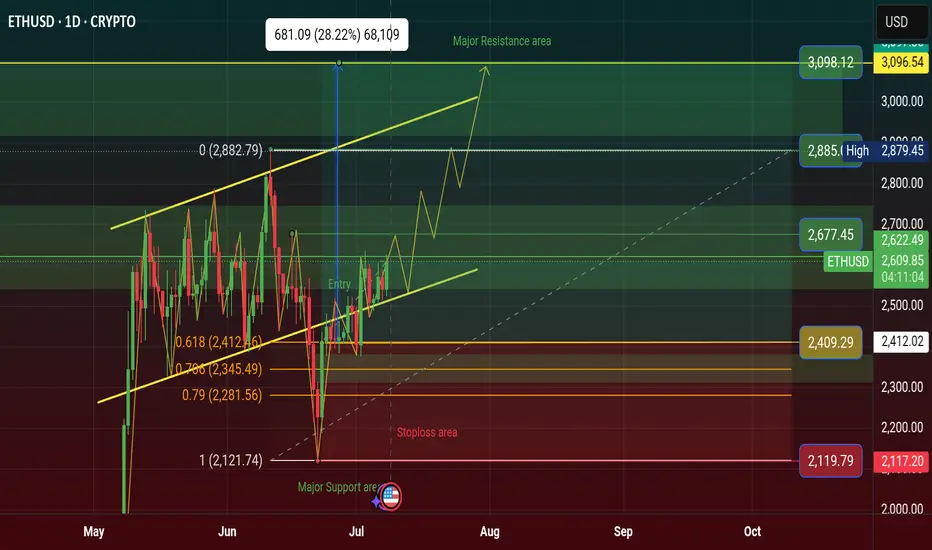
$ETH Price Will Rising $3098 in Q3, Bullish Flag Inverse AngleCRYPTOCAP:ETH price will Rising $3098 in Q3 in 2025, Price Showing a Bullish Flag Inverse Angle. it's a Reversal Pattern and Manipulation Price. See more on Chart.
Crypto News: An Ethereum address holding 900 ETH started moving coins Monday after spending nearly 10 years dormant.
The holder received these genesis coins in 2015 when ETH traded below 50 cents.
These pre-mined tokens were distributed to early Ethereum contributors before mining began.
Their current value reaches 2.2 million with ETH trading around 2,529 per coin.
This represents potential gains exceeding 5,000% from the original sub-dollar entry price.
The move follows similar whale activity, including a 27.6 million Ethereum sale in April.
Last week saw a Bitcoin whale move 8 billion after 14 years of hodling.
ETH remains 48% below its 2021 all-time high of 4,878 despite recent stability.
The holder technically isn't a whale, which requires a minimum of 10,000 ETH at current prices.
#Write2Earn #BinanceSquareFamily #ETH #SUBROOFFICIAL
Disclaimer: This article is for informational purposes only and does not constitute financial advice. Always conduct your own research before making any investment decisions. Digital asset prices are subject to high market risk and price volatility. The value of your investment may go down or up, and you may not get back the amount invested.
$SOL Price Will Hit $228 Q3, Inverse Head and Shoulder Pattern✨ CRYPTOCAP:SOL Price Will Hit $228 in Q3 of 2025 | Solana Chart Showing Inverse Head and Shoulder Pattern. It's a Bullish Reversal Pattern.
‣ Solana price is hovering below key resistance; a breakout above $159 and it's going to $228.
ETF Buzz Grows, but Price Action Still Caught in Limbo Here is why this could be the catalyst that sends price to all time highs Do THIS before that happens.
‣ Solana ETF Buzz Grows, but Price Action Still Caught in Limbo
🔸BlockNews The SEC has asked SOL ETF applicants to revise and refile submissions by end of July, fueling speculation of an ETF approval before October. Solana’s daily active addresses just hit a record 15.39 million, pointing to rising demand and user engagement on the network.
#Write2Earn #NFPWatch #BinanceSquareFamily #TrumpTariffs #SUBROOFFICIAL
Disclaimer: This article is for informational purposes only and does not constitute financial advice. Always conduct your own research before making any investment decisions. Digital asset prices are subject to high market risk and price volatility.

Nobody appreciates it !!!Following the recent significant decline, DOGE has now developed an ascending triangle pattern on the daily chart, which might indicate a bullish trend. Keep in mind that this analysis is based on the daily time frame.
............................................
The Crypto Market Game: How to Win Against Fear and Manipulation
Did you really think profiting from the current bull run (a comprehensive upward market) would be easy? Don't be naive. Do you think they’ll let you buy low, hold, and sell high without any struggle? If it were that simple, everyone would be rich. But the truth is: 90% of you will lose. Why? Because the crypto market is not designed for everyone to win.
They will shake you. They will make you doubt everything. They will create panic, causing you to sell at the worst possible moment. Do you know what happens next? The best players in this game buy when there’s fear, not sell—because your panic gives them cheap assets.
This is how the game works: strong hands feed off weak hands. They exaggerate every dip, every correction, every sell-off. They make it look like the end of the world so you abandon everything. And when the market rises again, you’re left sitting there asking, “What just happened?”
This is not an accident. It’s a system. The market rewards patience and punishes weak emotions. The big players already know your thoughts. They know exactly when and how to stir fear, forcing you to give up. When you panic, they profit. They don’t just play the market—they play you. That’s why most people never succeed: they fall into the same traps over and over again.
People don’t realize that dips, FUD (fear, uncertainty, doubt), and panic are all part of the plan. But the winners? They block out the noise. They know that fear is temporary, but smart decisions last forever.
We’ve seen this play out hundreds of times. They pump the market after you sell. They take your assets, hold them, and sell them back to you at the top—leaving you with nothing, wondering how it happened.
Don’t play their game. Play your own.
..................................................................................
Give me some energy !!
✨We spend hours finding potential opportunities and writing useful ideas, we would be happy if you support us.
Best regards CobraVanguard.💚
_ _ _ _ __ _ _ _ _ _ _ _ _ _ _ _ _ _ _ _ _ _ _ _ _ _ _ _ _ _ _ _
✅Thank you, and for more ideas, hit ❤️Like❤️ and 🌟Follow🌟!
⚠️Things can change...
The markets are always changing and even with all these signals, the market changes tend to be strong and fast!!

DOGE What will happen in the short term ?According to my calculations, the price will reach 0.32 in the short term.
Give me some energy !!
✨We spend hours finding potential opportunities and writing useful ideas, we would be happy if you support us.
Best regards CobraVanguard.💚
_ _ _ _ __ _ _ _ _ _ _ _ _ _ _ _ _ _ _ _ _ _ _ _ _ _ _ _ _ _ _ _
✅Thank you, and for more ideas, hit ❤️Like❤️ and 🌟Follow🌟!
⚠️Things can change...
The markets are always changing and even with all these signals, the market changes tend to be strong and fast!!

Technical Analysis for Matic/Polygon. I can be 100% wrong!Technical Analysis for Matic/Polygon. On the Daily TimeFrame, it has formed a Head and Shoulder Pattern, and can be a bullish signal.
But keep a check on the price margin that it should not cross below the given support (Fibonacci Level 0.23).
Things to keep in mind :
1. Check for a good "Volume" breakout FTX:MATICUSD
2. Check for Moving Averages
3. Relative Strength Index
I can be 100% wrong, this is not a financial advice , so please do your own analysis before you jump into investing!
