Gold Slips Below Key Resistance | Bears Target 4133–4105 ZoneGOLD | Overview
Gold dropped perfectly as projected and continues to show strong bearish momentum while trading below 4167.
The broader structure remains negative, and sellers maintain control unless the price can reclaim key resistance levels.
Technically, as long as the metal trades below 4167, the trend remains bearish, targeting 4133, with a potential extension toward 4105 and 4083 if a 1H or 15Min close occurs below 4133.
However, a move above 4168 would trigger a short-term correction toward 4188, while a 1H close above 4188 would confirm a bullish reversal toward 4207–4237.
Pivot Line: 4168
Resistance: 4188 · 4207 · 4237
Support: 4133 · 4105 · 4083
Outlook:
Gold remains bearish while below 4167, with downside targets at 4133–4105–4083.
A confirmed 1H close above 4188 would shift short-term sentiment to bullish, targeting 4207–4237.
Trend Lines

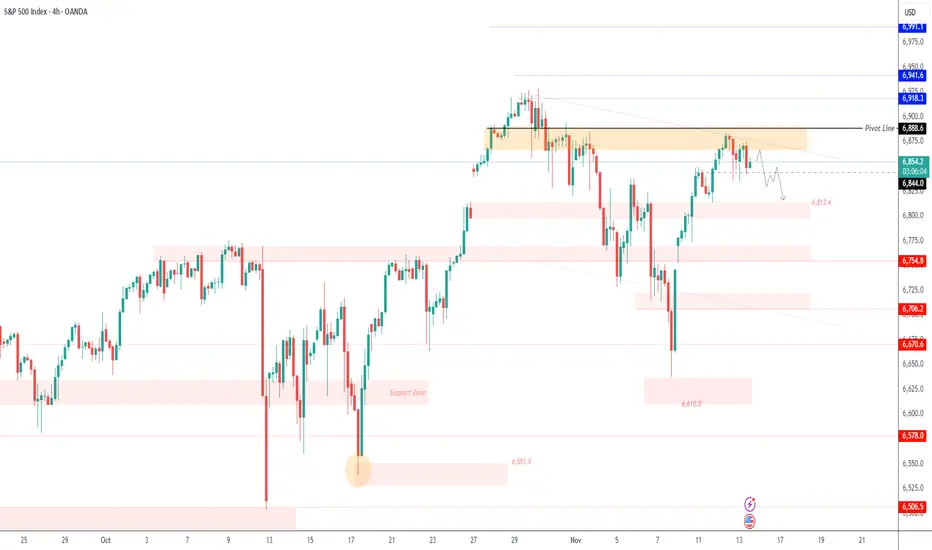
Shutdown Ends, Uncertainty Remains | SPX500 Holds Below 6866SPX500 | Overview
Trump Signs Bill to End Longest U.S. Government Shutdown
U.S. President Donald Trump signed a bill late at night in the Oval Office, officially ending the longest government shutdown in U.S. history, after a dinner with Jamie Dimon and top Wall Street executives.
While markets welcomed the resolution, the White House confirmed that some economic data gaps may be permanent, as October’s employment and CPI reports might never be released—a factor that could influence future Fed decision-making.
Technically:
The SPX500 has stabilized below the pivot zone at 6866, indicating continued bearish momentum with downside potential toward 6844 and 6813.
As long as the price trades below 6866, the bearish bias remains active.
However, a 1H close above 6888 would shift sentiment to bullish, targeting 6918 and a potential new all-time high (ATH) around 6940.
Pivot Line: 6866
Resistance: 6888 · 6918 · 6940
Support: 6844 · 6813 · 6768
Good sell opportunity to comeBe patient as price is currently respecting the pullback channel before continuing to South. As the Weekly bias is bearish, I'd keep looking for good opportunity to sell.
In this case, once price breaks pullback channel, wait for smaller retracement for better Risk-Reward-Ratio to sell stop on most recent support as shown.
Be patient and God bless!

U.S. Futures Slip as Fed Cut Bets Fade | US30 Holds Below 47460US30 | Overview
U.S. Futures Decline as Bets on a December Fed Rate Cut Recede
U.S. indices pulled back as traders scaled back expectations for a Federal Reserve rate cut in December, leading to mild risk-off sentiment across equity markets.
The Dow Jones (US30) continues to trade lower as investors await further economic data to gauge the Fed’s policy trajectory.
Technically:
The price has stabilized below the pivot line at 47460, confirming a bearish bias in the short term.
As long as the index trades below 47460, momentum favors a decline toward 47230 and 47080.
However, a 4H candle close above 47460 would invalidate this view and shift sentiment toward a bullish recovery targeting 47700 and 47850.
Pivot Line: 47460
Resistance: 47570 · 47700 · 47850
Support: 47230 · 47080 · 46920

GOLD → Correction and retest 4150 FX:XAUUSD still retains its bullish structure. The price is entering a correction phase within the trading range. The key support level that may attract the attention of MM is 4150.
The probability of a decline in December fell to 51% (from 63% the day before) after hawkish statements by Fed officials. Government bond yields are rising. These factors are putting pressure on gold.
However, a weak dollar, a flight to safe assets amid global market sell-offs, and uncertainty surrounding US data (September reports may be published, but October data is likely to be lost) are providing support for the bullish trend.
Gold retains its growth potential due to macro risks. A short-term correction is possible due to profit-taking ahead of the weekend, but the $4150 level remains key support.
Resistance levels: 4211, 4239
Support levels: 4161, 4150, 4100
Within the current trading range, the focus is on support at 4161 - 4148. A false breakdown and bulls holding prices above key levels could trigger a rebound and growth to local resistance levels...
Best regards, R. Linda!

EURUSD → Correction for consolidation before growth FX:EURUSD is in a “liquidity hunt” phase, testing an intermediate support level, and may continue to rise if the dollar's decline intensifies...
On the daily timeframe, the price is within a wide trading range, but at the same time, it is breaking through the resistance of the local downtrend, which allows us to observe bullish sentiment in the market. The trend is changing, and there are local confirmations of the presence of bulls in the market...
Without reaching the resistance level of the range, the price is consolidating and correcting, testing the key support level of 1.1618. If the bulls hold this area, the price will continue to rise to 1.1667 - 1.1728.
Support levels: 1.1618, 1.1577
Resistance levels: 1.1667, 1.1728
A false breakdown and price consolidation above 1.1618 could lead to a continuation of the bullish momentum and the achievement of the first key target of 1.1667.
Best regards, R. Linda!

Is Gold Attempting to go back to Previous ATH?Hey Traders, in today's trading session we are monitoring XAUUSD for a buying opportunity around 4,220 zone, Gold is trading in an uptrend and currently is in a correction phase in which it is approaching the trend at 4,220 support and resistance area.
Trade safe, Joe.

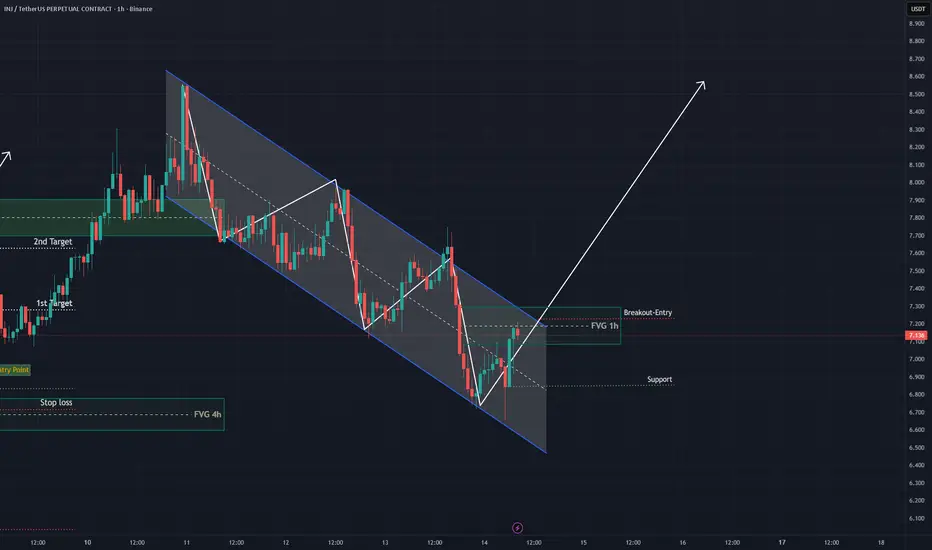
INJ 1h Counter-Trend Long Setup (Risk Warning)CRYPTOCAP:INJ 1H – No Bullish Breakout Yet
INJ is still trading inside the descending channel, which means a confirmed bullish breakout has NOT happened yet.
Any long entry taken here would be counter-trend, lower probability, and comes with a weaker R:R until price breaks and holds above the channel resistance + key Fib levels.
For a safer bullish setup:
Wait for a clean breakout above the channel
Retest + confirmation
Reclaim of 0.382 / 0.5 Fib
Until then, trend remains bearish, and longs are considered high-risk.
#INJ #YodaXCalls #CryptoAnalysis #RiskManagement #INJUSDT
ETH/USDT: Bullish Breakout to $3740?BINANCE:ETHUSDT is setting up for a potential bullish breakout on the 4-hour chart , where price has formed a higher low while testing a downward trendline, converging near the good entry zone at cumulative short liquidation levels—suggesting buyers could trigger a squeeze if support holds, aiming for higher resistances. This position carries high risk, so always prioritize strict risk and capital management to avoid significant losses in volatile crypto markets.
Entry between $3370-$3417 . Target at $3740 in the take profit zone. Set a stop loss on a close below $3320 to mitigate downside. 🌟 Look for confirmation with a bullish close above the entry and surging volume, riding Ethereum's momentum amid broader crypto trends.
📝 Trade Setup:
🎯 Entry Zone: $3,370 – $3,417
💰 Target: $3,740 (Take-Profit Zone)
❌ Stop Loss: Close below $3,320
⚖️ Risk-to-Reward: Approximately 1:3, depending on entry execution and volatility
⚠️ This remains a high-risk trade setup — strict risk and capital management are essential in volatile crypto conditions.
What's your view on this high-risk setup? Drop your thoughts below! 👇

Amzn weekly chartI think we are heading into a tough correction based on my personal view.
Look at this divergence on the RSI indicator on the weekly timeframe.
I believe I’m done with this stock.
Good luck 4all🌷

Gold price developments today, November 141. Trendline
Descending trendline (upper red): Price is repeatedly rejected here → a strong dynamic resistance.
Ascending trendline (lower red): Price has bounced multiple times → an important dynamic support, forming a confluence with the 0.618 Fibonacci level.
2. Resistance
4,215 – 4,225:
Supply zone + confluence with the descending trendline → a high-probability selling area.
If price breaks strongly above 4,225, the next expansion target is 4,244.
3. Support
4,172 – 4,155 (Fibo 0.5 – 0.618):
Nearest support, likely to see a reaction.
4,127 – 4,130:
The strongest support zone, aligned with the ascending trendline → a potential buying area.
4. Price Scenarios
Scenario 1 (primary):
Price retraces to retest 4,215–4,225, gets rejected → declines toward 4,155 or deeper to 4,127.
Scenario 2:
If the descending trendline breaks, price could rally strongly toward 4,244.
BUY GOLD : 4127 - 4130
Stoploss : 4113
Take Profit : 100-300-500pips
SELL GOLD : 4221-4224
Stoploss : 4233
Take Profit : 100-300-500pips

BTC Daily Liquidity / Monthly FVG – UpdateFollowing the analysis from previous weeks, BTC has finally moved below the VAL and is approaching the preferred zone for a swing long.
Price action remains weak, could be that institutional long orders are not being filled yet. On LTF there are signs of accumulation, but overall the market still looks fragile, daily structure still does not print a bottom pattern. I maintain my primary scenario: sweep the daily liquidity at 98K and extend lower into the 96–97K zone, where we have a strong confluence:
-Daily OB
-50% of the Monthly FVG
-Monthly/Daily trendline support
From there, I’m considering two entries:
Entry 1: 97.5K — Stop: 96K
Entry 2 (if the Monthly FVG is fully filled): 95K — Stop: 93K
If neither of these scenarios holds, then alternative scenarios come into play outside of the current plan.

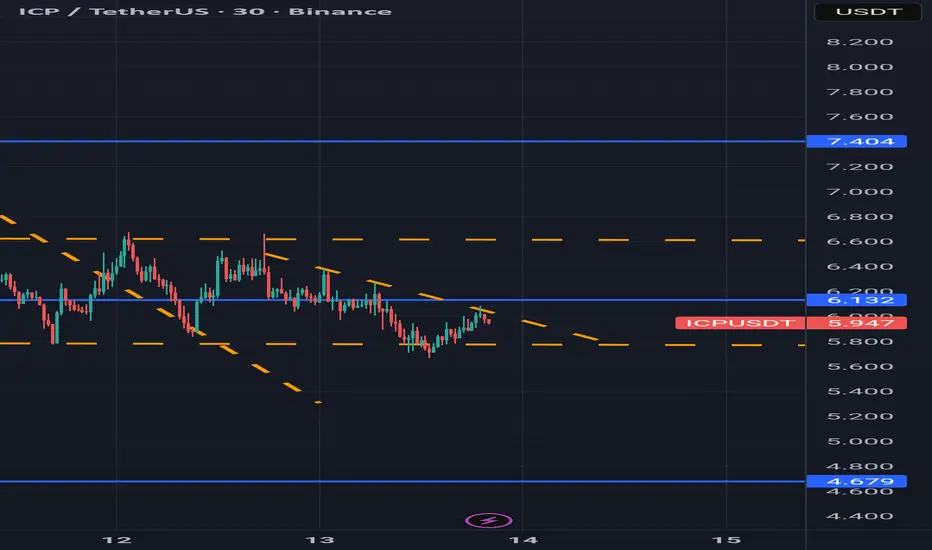
ICP range boundICP had a strong bounce off the 5.75 low and looks to be range bound between ~$5.75 and ~$6.60. It's experiencing some short term downtrend pressure at the moment, but should be moving towards high of $6.60 if the range holds.
Which way will the range break? Time Will tell.
EURUSD: Trendline Resistance! Hi teams,
Lets take a sight on EURUSD. this pair have been on descending channel of support and resistance, with lower highs and lows zones. the price just responded to the resistance zone, currently reversing below the trendline.
Key points;
More retracement confirmation below the resistance, would set off a downward movement to 1.1432 as next potential support and target.
Lets see how it plays out.
Thanks for reading.

possible bullish tradeThe USDCHF is a bouncing from a lower trendline. I am hoping it will reach 0.8153. its for educational purposes.

Euro Technical Forecast: EUR/USD Bulls Emerge at Trend SupportEuro plunged nearly 3.8% off the yearly high last week. Despite registering an intraweek low at 1.1469, price was unable to mark a close below 1.1497. The subsequent rebound has now extended more than 1.6% off the November low and the focus is now on whether the rally marks resumption of the broader uptrend or a brief pause within a larger pullback.
Initial resistance is being tested today at the 38.2% retracement of the September decline at 1.1641 with key resistance is eyed at 1.1747/75- a region defined by the 2025 high-week close (HWC), the 61.8% retracement, and the yearly high-close. A breach / weekly close above this threshold is needed to mark uptrend resumption with subsequent resistance objectives eyed at the yearly swing high, the 100% extension of the 2022 advance and the 38.2% retracement of the 2008 decline at 1.1917-1.2019. Note that the upper parallel converges on this zone into the close of the year- look for a larger reaction there IF reached.
Weekly support rests 1.1497-1.1537- a region defined by the March 2020 & 2022 highs, the 78.6% retracement of the July rally, and the objective monthly open. A break / weekly close below this threshold would suggest a more significant high is in place, and a larger trend reversal is underway. Subsequent support objectives eyed at the April high-close at 1.1394 and the 2024 HWC / 38.2% retracement of the yearly range at 1.1228/54.
Bottom line : Euro rebounded off uptrend support with the recovery now testing initial resistance- watch the weekly close with respect to 1.1641. From a trading standpoint, losses should be limited to 1.1537 IF price is heading higher on this stretch with a close above 1.1775 ultimately needed to mark resumption of the broader uptrend.
-MB

Tesla Wave Analysis – 13 November 2025
- Tesla broke support zone
- Likely to fall to support level 380.00,
Tesla recently broke the support zone between the support level 415.00 (which has been reversing the price from September) and the 38.2% Fibonacci correction of the upward impulse from September.
The breakout of this support zone strengthened the bearish pressure on Tesla accelerating the active impulse wave (iii).
Tesla can be expected to fall further to the next support level 380.00, which coincides with the daily up channel from April and the 61.8% Fibonacci correction of the upward impulse from September.

Tesla - The Bullish Path Is Clear... For Now.Hey Traders! It’s been a while since I posted about TSLA. This one isn’t an in-depth LTF breakdown — instead, we’re zooming out to identify the higher-timeframe targets and where price wants to go before any real continuation can happen.
The market runs on liquidity — and the less of it there is, the harder it is for price to move freely. Because TSLA carries so much liquidity and volatility, we don’t need the same slow, drawn-out liquidity builds that other stocks require. The swings are large and the algorithms respect because the liquidity is always there.
When we zoom out, the structure becomes clearer. The market consistently gives us signs before each major move — and on a higher-timeframe bullish Tesla, the price action is guided by white tapered selling, which acts as our roadmap for healthy continuation.
But here’s the nuance:
The higher up in timeframe we go, the more liquidity is required to sustain the next leg. That’s why we often see price digging deep into previously proven and broken algorithms before continuing higher. It’s not randomness — it’s the market refueling for expansion.
The path is pretty clear ahead for TSLA that we'll need to take advantage of HTF algorithms in order to break out of a much HTF liquidity structure.
Happy Trading:)

What's happening at Tesla!!I think Tesla should reach a price range of about $50 cheaper than the current price along the box drawn in the chart!

Same Algorithms, Different Timeframes — Structure RepeatsThis is a great visual representation of what multi-timeframe analysis really looks like — a chart within a larger chart within an even larger chart.
When you start aligning these timeframes and spotting consistencies, you unlock a new dimension of clarity in price behavior.
I use this to pinpoint where liquidity has been built and which algorithms need to be activated or proven for a healthy continuation. It’s also how I manage risk — by being able to execute on the lowest timeframe that aligns with my higher-timeframe thesis.
As you’ll see in the video, this chart’s algorithmic structure repeats beautifully — from the hourly all the way up to the weekly.
Current Story:
The HTF shows a major bullish liquidity build within white tapered selling, now in the process of disproving the stronger purple algorithm. If we can hold white support around $380–390, the market is essentially signaling a move toward the sell-side of its HTF white algorithm.
However, on the LTF, we’re still under the control of a strong red selling structure . Until we see tapering there — and ultimately a break of red — there’s no reason to rush a long. That’s step one.
Structure’s clear. Now it’s about patience and precision.
Happy Trading :)

USD Rejected at Resistance- Key Test Ahead for DXYThe US Dollar reversed sharply off pivotal resistance into the November open with DXY poised to mark a second consecutive weekly loss. The focus is now on whether the pullback marks the start of a larger correction or a brief pause within the broader uptrend.
The Dollar has now fallen more than 1.2% off the monthly high with the decline now breaking below the September uptrend. A simple channel extending off the monthly high is guiding this decline with initial support now eyed at 99.68/78- a region defined by the August high-day close, the May low and the 38.2% retracement. Look for a larger reaction there IF reached with a break / close below needed to suggest a more significant high is in place and a larger trend reversal is underway. Subsequent support rests at 98.03 and the 2018 high / 61.8% retracement at 97.71/80.
Weekly open resistance is eyed at 99.62 and is backed closely by the November open at 99.75. A break / close above this threshold would threaten resumption of the September uptrend with key resistance steady at 100.15/35- a region defined by the 2024 low, the 200-day moving average and the 2024 low close. Strength beyond this pivot zone is needed to fuel the next major leg of the US Dollar advance. The next major technical consideration is eyed at the 1.618% extension of the September advance at 101.32.
Bottom line: DXY reversed from key resistance into the monthly open with a break below then September upslope threatening a deeper setback- be on the lookout for a possible exhaustion low in the days ahead. From a trading standpoint, losses would need to be limited to 98.68 IF this is a simple correction with a break above 100.35 needed to mark uptrend resumption.
-MB

Bitcoin Bearish Reversal SetupBitcoin is showing a potential bearish setup as the price approaches the central resistance zone. A rejection from this area could lead to a downward move toward the 101,500 target level, with selling pressure expected below the trendline.

EURUSD: Three Targets, One Entry, Swing Buy! Dear Traders,
EURUSD has broken through the trendline liquidity, providing us with the confirmation we needed to buy big. We believe the price is likely to head towards three targets. The first target is nearby, and once it’s hit, we may see price retesting and confirming the trend change. At this point, it would be safe to enter with accurate risk management.
Good luck and trade safely!
Team Setupsfx_
