Gold price developments today, November 141. Trendline
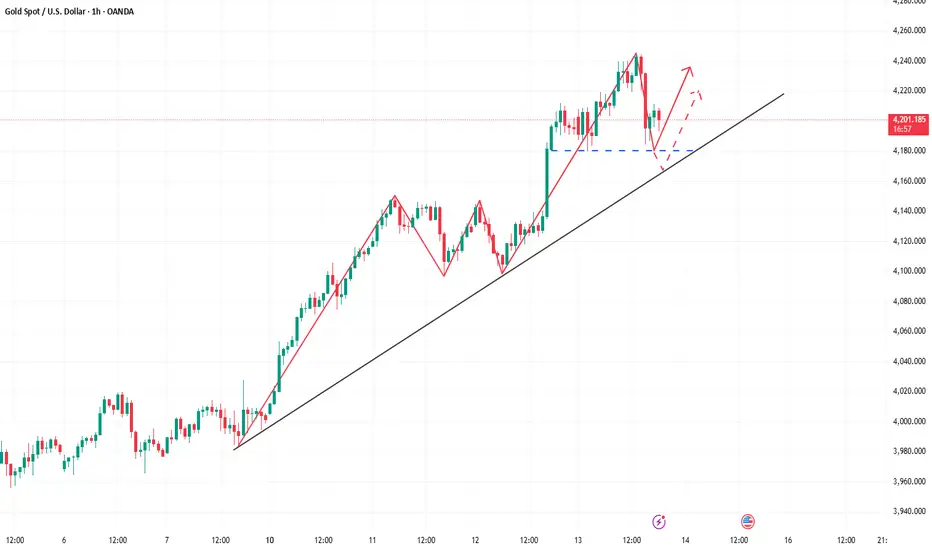
Descending trendline (upper red): Price is repeatedly rejected here → a strong dynamic resistance.
Ascending trendline (lower red): Price has bounced multiple times → an important dynamic support, forming a confluence with the 0.618 Fibonacci level.
2. Resistance
4,215 – 4,225:
Supply zone + confluence with the descending trendline → a high-probability selling area.
If price breaks strongly above 4,225, the next expansion target is 4,244.
3. Support
4,172 – 4,155 (Fibo 0.5 – 0.618):
Nearest support, likely to see a reaction.
4,127 – 4,130:
The strongest support zone, aligned with the ascending trendline → a potential buying area.
4. Price Scenarios
Scenario 1 (primary):
Price retraces to retest 4,215–4,225, gets rejected → declines toward 4,155 or deeper to 4,127.
Scenario 2:
If the descending trendline breaks, price could rally strongly toward 4,244.
BUY GOLD : 4127 - 4130
Stoploss : 4113
Take Profit : 100-300-500pips
SELL GOLD : 4221-4224
Stoploss : 4233
Take Profit : 100-300-500pips
Trend Lines

BTC Daily Liquidity / Monthly FVG – UpdateFollowing the analysis from previous weeks, BTC has finally moved below the VAL and is approaching the preferred zone for a swing long.
Price action remains weak, could be that institutional long orders are not being filled yet. On LTF there are signs of accumulation, but overall the market still looks fragile, daily structure still does not print a bottom pattern. I maintain my primary scenario: sweep the daily liquidity at 98K and extend lower into the 96–97K zone, where we have a strong confluence:
-Daily OB
-50% of the Monthly FVG
-Monthly/Daily trendline support
From there, I’m considering two entries:
Entry 1: 97.5K — Stop: 96K
Entry 2 (if the Monthly FVG is fully filled): 95K — Stop: 93K
If neither of these scenarios holds, then alternative scenarios come into play outside of the current plan.

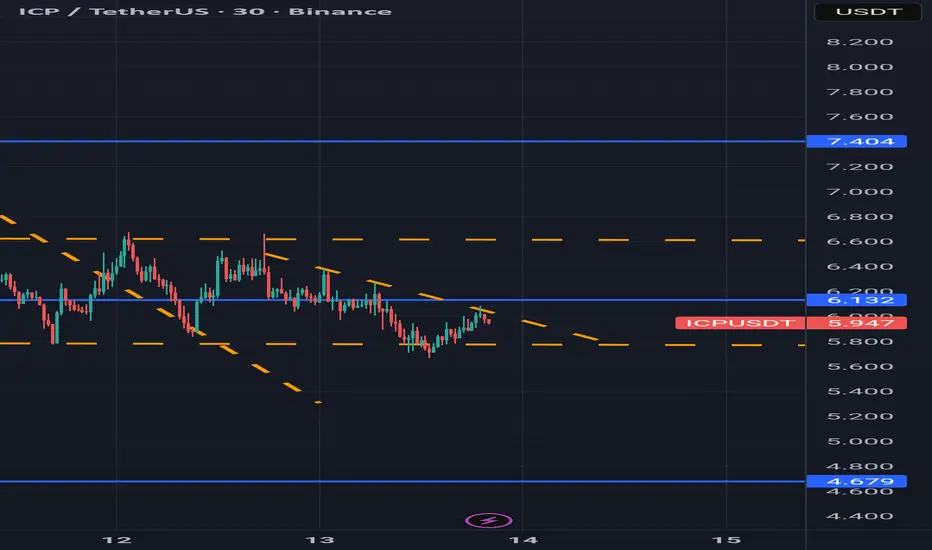
ICP range boundICP had a strong bounce off the 5.75 low and looks to be range bound between ~$5.75 and ~$6.60. It's experiencing some short term downtrend pressure at the moment, but should be moving towards high of $6.60 if the range holds.
Which way will the range break? Time Will tell.
EURUSD: Trendline Resistance! Hi teams,
Lets take a sight on EURUSD. this pair have been on descending channel of support and resistance, with lower highs and lows zones. the price just responded to the resistance zone, currently reversing below the trendline.
Key points;
More retracement confirmation below the resistance, would set off a downward movement to 1.1432 as next potential support and target.
Lets see how it plays out.
Thanks for reading.

possible bullish tradeThe USDCHF is a bouncing from a lower trendline. I am hoping it will reach 0.8153. its for educational purposes.

Euro Technical Forecast: EUR/USD Bulls Emerge at Trend SupportEuro plunged nearly 3.8% off the yearly high last week. Despite registering an intraweek low at 1.1469, price was unable to mark a close below 1.1497. The subsequent rebound has now extended more than 1.6% off the November low and the focus is now on whether the rally marks resumption of the broader uptrend or a brief pause within a larger pullback.
Initial resistance is being tested today at the 38.2% retracement of the September decline at 1.1641 with key resistance is eyed at 1.1747/75- a region defined by the 2025 high-week close (HWC), the 61.8% retracement, and the yearly high-close. A breach / weekly close above this threshold is needed to mark uptrend resumption with subsequent resistance objectives eyed at the yearly swing high, the 100% extension of the 2022 advance and the 38.2% retracement of the 2008 decline at 1.1917-1.2019. Note that the upper parallel converges on this zone into the close of the year- look for a larger reaction there IF reached.
Weekly support rests 1.1497-1.1537- a region defined by the March 2020 & 2022 highs, the 78.6% retracement of the July rally, and the objective monthly open. A break / weekly close below this threshold would suggest a more significant high is in place, and a larger trend reversal is underway. Subsequent support objectives eyed at the April high-close at 1.1394 and the 2024 HWC / 38.2% retracement of the yearly range at 1.1228/54.
Bottom line : Euro rebounded off uptrend support with the recovery now testing initial resistance- watch the weekly close with respect to 1.1641. From a trading standpoint, losses should be limited to 1.1537 IF price is heading higher on this stretch with a close above 1.1775 ultimately needed to mark resumption of the broader uptrend.
-MB

Tesla Wave Analysis – 13 November 2025
- Tesla broke support zone
- Likely to fall to support level 380.00,
Tesla recently broke the support zone between the support level 415.00 (which has been reversing the price from September) and the 38.2% Fibonacci correction of the upward impulse from September.
The breakout of this support zone strengthened the bearish pressure on Tesla accelerating the active impulse wave (iii).
Tesla can be expected to fall further to the next support level 380.00, which coincides with the daily up channel from April and the 61.8% Fibonacci correction of the upward impulse from September.

Tesla - The Bullish Path Is Clear... For Now.Hey Traders! It’s been a while since I posted about TSLA. This one isn’t an in-depth LTF breakdown — instead, we’re zooming out to identify the higher-timeframe targets and where price wants to go before any real continuation can happen.
The market runs on liquidity — and the less of it there is, the harder it is for price to move freely. Because TSLA carries so much liquidity and volatility, we don’t need the same slow, drawn-out liquidity builds that other stocks require. The swings are large and the algorithms respect because the liquidity is always there.
When we zoom out, the structure becomes clearer. The market consistently gives us signs before each major move — and on a higher-timeframe bullish Tesla, the price action is guided by white tapered selling, which acts as our roadmap for healthy continuation.
But here’s the nuance:
The higher up in timeframe we go, the more liquidity is required to sustain the next leg. That’s why we often see price digging deep into previously proven and broken algorithms before continuing higher. It’s not randomness — it’s the market refueling for expansion.
The path is pretty clear ahead for TSLA that we'll need to take advantage of HTF algorithms in order to break out of a much HTF liquidity structure.
Happy Trading:)

What's happening at Tesla!!I think Tesla should reach a price range of about $50 cheaper than the current price along the box drawn in the chart!

Same Algorithms, Different Timeframes — Structure RepeatsThis is a great visual representation of what multi-timeframe analysis really looks like — a chart within a larger chart within an even larger chart.
When you start aligning these timeframes and spotting consistencies, you unlock a new dimension of clarity in price behavior.
I use this to pinpoint where liquidity has been built and which algorithms need to be activated or proven for a healthy continuation. It’s also how I manage risk — by being able to execute on the lowest timeframe that aligns with my higher-timeframe thesis.
As you’ll see in the video, this chart’s algorithmic structure repeats beautifully — from the hourly all the way up to the weekly.
Current Story:
The HTF shows a major bullish liquidity build within white tapered selling, now in the process of disproving the stronger purple algorithm. If we can hold white support around $380–390, the market is essentially signaling a move toward the sell-side of its HTF white algorithm.
However, on the LTF, we’re still under the control of a strong red selling structure . Until we see tapering there — and ultimately a break of red — there’s no reason to rush a long. That’s step one.
Structure’s clear. Now it’s about patience and precision.
Happy Trading :)

USD Rejected at Resistance- Key Test Ahead for DXYThe US Dollar reversed sharply off pivotal resistance into the November open with DXY poised to mark a second consecutive weekly loss. The focus is now on whether the pullback marks the start of a larger correction or a brief pause within the broader uptrend.
The Dollar has now fallen more than 1.2% off the monthly high with the decline now breaking below the September uptrend. A simple channel extending off the monthly high is guiding this decline with initial support now eyed at 99.68/78- a region defined by the August high-day close, the May low and the 38.2% retracement. Look for a larger reaction there IF reached with a break / close below needed to suggest a more significant high is in place and a larger trend reversal is underway. Subsequent support rests at 98.03 and the 2018 high / 61.8% retracement at 97.71/80.
Weekly open resistance is eyed at 99.62 and is backed closely by the November open at 99.75. A break / close above this threshold would threaten resumption of the September uptrend with key resistance steady at 100.15/35- a region defined by the 2024 low, the 200-day moving average and the 2024 low close. Strength beyond this pivot zone is needed to fuel the next major leg of the US Dollar advance. The next major technical consideration is eyed at the 1.618% extension of the September advance at 101.32.
Bottom line: DXY reversed from key resistance into the monthly open with a break below then September upslope threatening a deeper setback- be on the lookout for a possible exhaustion low in the days ahead. From a trading standpoint, losses would need to be limited to 98.68 IF this is a simple correction with a break above 100.35 needed to mark uptrend resumption.
-MB

Bitcoin Bearish Reversal SetupBitcoin is showing a potential bearish setup as the price approaches the central resistance zone. A rejection from this area could lead to a downward move toward the 101,500 target level, with selling pressure expected below the trendline.

EURUSD: Three Targets, One Entry, Swing Buy! Dear Traders,
EURUSD has broken through the trendline liquidity, providing us with the confirmation we needed to buy big. We believe the price is likely to head towards three targets. The first target is nearby, and once it’s hit, we may see price retesting and confirming the trend change. At this point, it would be safe to enter with accurate risk management.
Good luck and trade safely!
Team Setupsfx_

How to seize the real turning point for gold?Due to recent complex news, the operations of major gold trading funds have become more covert and unpredictable. The market may reverse at any time, breaking the current upward trend. Even if a technical pullback occurs, its magnitude could be significant, and the potential risks cannot be ignored. Therefore, a cautious approach should be taken in trading. Avoid blindly chasing the rally and patiently wait for stabilization signals after a pullback before establishing long positions. This is currently a more prudent and cost-effective choice. Following the market rhythm and acting in accordance with the trend is the core principle of future investment. From the current structure, the support level to watch is the 4190-4170 area. The performance of this range will be an important basis for judging the market direction and formulating trading strategies. By steadily grasping the rhythm and responding to fluctuations in accordance with the trend, one can achieve greater stability and go further in the gold market.
EUR/USD Aiming for 1.1700, AgainEUR/USD has rallied near 1.1630 on Thursday, supported by firm messaging from European Central Bank officials and a moderate rebound in risk sentiment following the resolution of the U.S. government shutdown earlier this week. The pair briefly tested 1.1643, its highest level in two weeks, before easing slightly in midday trade.
Comments from ECB Executive Board member Isabel Schnabel helped underpin the Euro after she said inflation risks in the Eurozone remain “tilted a little to the upside,” suggesting policymakers are in no rush to discuss rate cuts. That hawkish tone reinforced expectations that the ECB will stay on hold through the end of the year. In the U.S., uncertainty persists following the short federal shutdown that delayed the release of key inflation and employment data.
In the above chart, EUR/USD rates have broken the downtrend from the September and October swing highs, suggesting the recent period of weakness may be ending. The pair is on pace for its first close above its 50-day exponential moving average (EMA) since October 16. From a technician’s perspective, a breach of recent swing highs near 1.1669 would confirm that the series of lower highs and lower lows has ended. Until then, resistance could appear at first blush in the area around the late-September swing lows/late-October swing highs.

Target shownI think we have a great target here before bulls step in. Wallstreet may be telegraphing what it thinks about bitcoin.
Risk is letting out air bigtime today.

Bulls are in control, and gold is poised for new highs!Gold bulls have resumed their strong upward momentum, and the overall pattern has gradually shifted towards a bull market structure. Further gains are expected, potentially pushing towards previous historical highs. Technically, the bullish trend remains dominant after the breakout. However, during this sustained upward movement, short-term caution is advised regarding the risk of high-level consolidation and potential pullbacks. The key support level to watch is the 4220-4200 area. If the price stabilizes and holds above this level, the bullish trend is likely to continue. Long positions can be initiated in batches, patiently waiting for the trend to extend. Avoid blindly chasing highs; maintain a steady pace and wait for a pullback confirmation before entering a position. This is the key to a stable and prudent approach in a strong market.

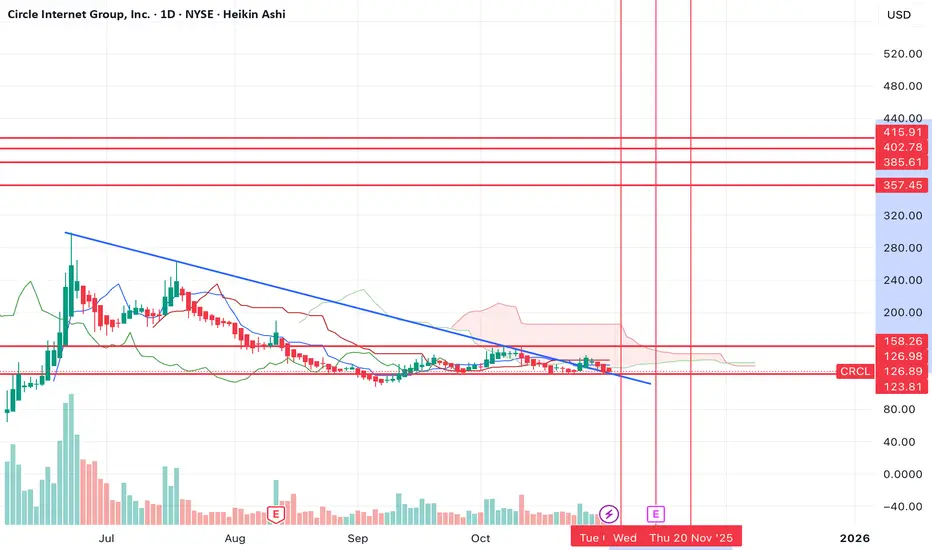
$CRCL set for a 150%+ move?Circle has broken out of a long term downtrend downtrend and has just retested the support. I think we're looking at a large move to the upside from here.
Would also coincide with similarities I'm seeing in altcoin charts.
I think the bullish move can take us to one of the upper resistances over the coming weeks.
Let's see how it plays out.
EURUSD BUY OPPORTUNITY SWING TRADERS 30min There is a clear trend break and retest on 30min timeframe. Waiting for price to retest the support level and hit off 10 20 EMA. Targeting 1.17100. 4hr timeframe EMA's are also on uptrend. Potentially big rr trade....

S&P500 (US500): Important Breakout & Bullish Continuation
US500 likely completely a correctional movement,
breaking a resistance line of a bullish flag pattern on a 4H time frame.
I think that a bullish wave is going to start soon
and the market will reach at least to 6917 level.
❤️Please, support my work with like, thank you!❤️
I am part of Trade Nation's Influencer program and receive a monthly fee for using their TradingView charts in my analysis.

Latest Direction After Gold Price Surge
News:
On Thursday (November 13) in Asian trading, spot gold remained relatively stable after yesterday's surge, currently trading around $4,200 per ounce.
On Wednesday evening local time, US President Trump signed a temporary funding bill, ending the longest government shutdown in US history. The bill will provide continued funding for the federal government, ensuring most government agencies have operating funds until January 30, 2026.
The end of the US government shutdown means that official economic data will resume being released, paving the way for a Federal Reserve interest rate cut in December.
Technical aspects:
On the daily chart, after stabilizing last week, gold has continued its rebound this week, showing short-term strength. Support levels to watch are around $4210, near Wednesday's high, and then the intraday low of $4185. Resistance levels to watch are the intraday high around $4240; a break above this level would indicate further strength, with the upside target at the psychological level of $4300, which also coincides with the upper Bollinger Band on the daily chart.
The 5-day moving average is trending upwards in a golden cross, the MACD indicator has formed a golden cross, and the KDJ and RSI indicators are also trending upwards in a golden cross, suggesting short-term technical indicators indicate a potential for further gold price rebound.
Trading strategy:
Buy:4190-4185, SL: 4175, TP: 4250-4275

PUMP OR DUMPHello friends
As you can see, the price has corrected after hitting the ceiling and buyers are gradually entering and buying in steps.
The specified supports are important for price growth. If these supports are maintained, the price can move to the specified targets. Of course, be sure to observe capital and risk management and enter in steps.
*Trade safely with us*

