GOLD → Fundamental background boosts interest FX:XAUUSD is recovering after a correction, trading in the range of 4060-4120 amid geopolitical tensions and risks of an escalating trade war.
Key supporting factors: New threats from the US against China, which is responding with additional measures. Trump imposed sanctions against Russian oil companies, accusing Moscow of lack of progress on Ukraine. US inflation data (CPI) on Friday may cause volatility, although the Fed's rate cut next week is likely already priced in.
The meeting between Trump and Xi Jinping next week remains uncertain.
Gold remains a safe haven, but near-term dynamics depend on the balance between dollar strength and geopolitical risks.
Resistance levels: 4116, 4163, 4200
Support levels: 4082, 4060, 4002
A retest of support at 4082-4060, as well as a breakout of resistance at 4116, could trigger a bullish reaction—a rise to the resistance level or imbalance zones. Against the backdrop of the escalating trade war, gold is becoming attractive again.
Best regards, R. Linda!
Trend Lines

EURUSD: Bearish Continuation Setup Within Broadening PatternHello everyone, here’s my breakdown of the current Euro setup.
Market Analysis
From a broader perspective, EUR/USD has been trading within a broadening formation, characterized by expanding highs and lows — a classic sign of increasing volatility and market indecision.
The key event that has defined the recent structure was a fake breakout above the 1.1757 resistance zone. After briefly pushing higher, the price was strongly rejected, indicating clear seller dominance and triggering a shift back into a bearish phase. Since then, price action has developed multiple range-bound consolidations followed by bearish breakouts, confirming that sellers continue to control momentum.
My Scenario & Strategy
Currently, the pair is pulling back after another breakout to the downside, trading just below the broadening resistance line. In my view, this recovery is a corrective rally rather than a reversal — it’s likely to face renewed selling pressure as it approaches the resistance area. I’m watching for a rejection confirmation around the upper boundary of the pattern. If that rejection holds, it would validate the short scenario and potentially trigger a continuation move toward the 1.1555 support zone — the lower boundary of the formation.
The broader structure remains bearish, and as long as EUR/USD stays below 1.1700, short setups are favored. A confirmed rejection could open the way for another wave of selling toward the next key support at 1.1555.
That's the setup I'm tracking. Thank you for your attention, and always manage your risk.

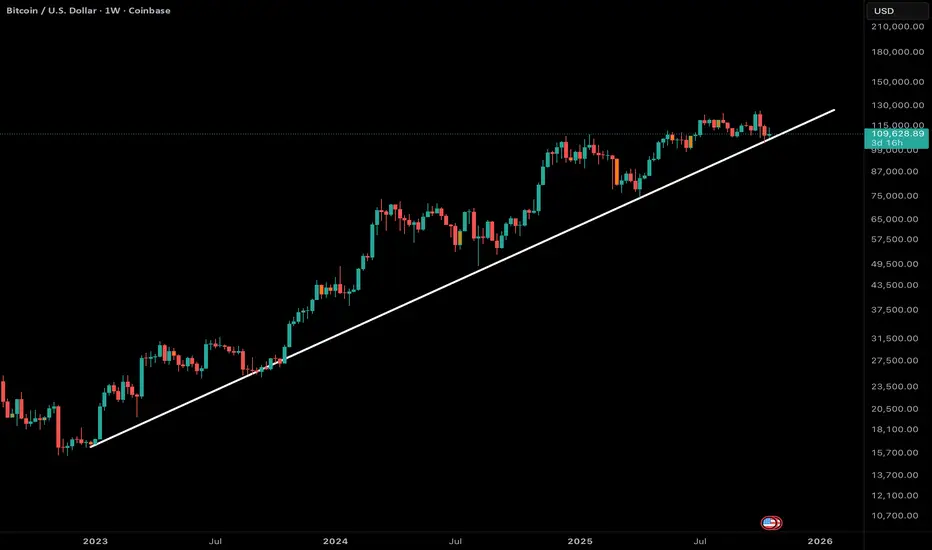
BTC Main TrendlineThis trendline has been the backbone of the entire BTC bull cycle—every major dip has bounced cleanly from it. As long as weekly candles hold above, the bull trend remains intact with each retest offering strong support. But once this line is broken with a decisive weekly close and confirmed rejection on the retest, it will mark a structural shift: momentum flips bearish, higher lows are invalidated, and the bull market phase likely ends.
GOLD → Correction after aggressive growthFX:XAUUSD is in a correction phase after a month and a half of aggressive growth. The price is forming a trading range and continues to storm support...
The record growth was overheated, and traders are closing long positions. A gradual change in the fundamental background and market sentiment is also provoking an outflow of funds. However, US-China negotiations, the ongoing US shutdown, and the tense geopolitical situation, including the cancellation of Trump's meeting with Putin, create additional risks in the economy, which may support the metal.
The correction in gold looks like a healthy pause. The $4,000 level remains key support. A recovery above $4100 indicates continued buyer interest, but further dynamics depend on news about trade negotiations.
Resistance levels: 4082, 4107, 4163
Support levels: 4059, 4000
A breakdown of the trading range support could trigger further sell-offs. Focus on 4000K, aggressive reaction possible. At the moment, the market is falling as aggressively as it rose. We need to wait for the price to slow down in order to make reasonable technical decisions.
Best regards, R. Linda!

BITCOIN → Trend reversal. Is there a chance for growth?BINANCE:BTCUSDT.P is breaking the trend and local market structure, forming a rally. Giving hope to buyers, we see a strong reaction from the Asian session. Are the bulls returning?
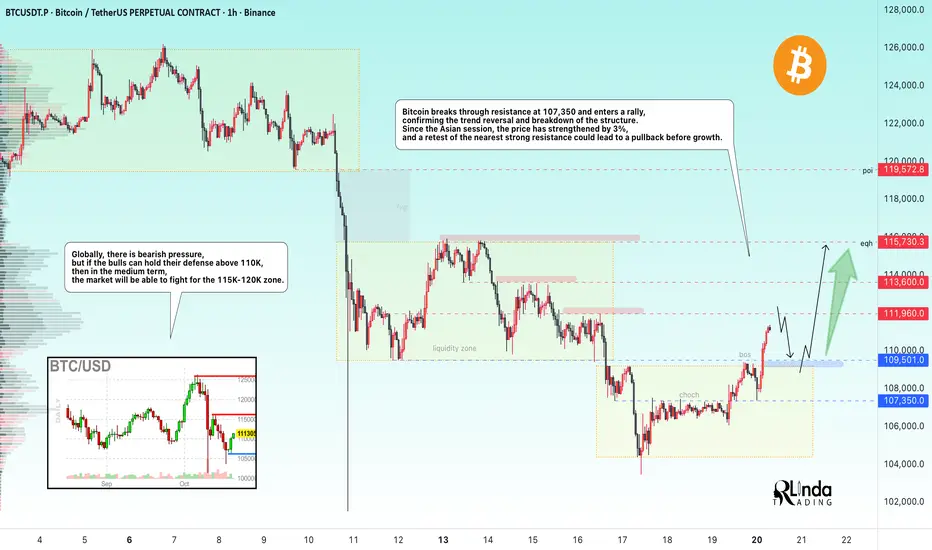
The fundamental background is unstable; if Trump continues to escalate the trade war, the cryptocurrency market may close within the range. However, technically, we have positive signs of a bull market. BTC is breaking through the resistance level of 107,350 and entering a rally, which only confirms the change in trend and the breakdown of the structure. Since the Asian session, the price has strengthened by 3%, and a retest of the nearest strong resistance at 112K-113.6K could lead to a pullback before growth.
Globally, there is bearish pressure, but if the bulls can hold their defense above 110K, then in the medium term, the market will be able to fight for the 115K-120K zone.
Resistance levels: 111960, 113600, 115730
Support levels: 109700, 109200
In the short term, I expect a false breakout of the specified resistance and a correction of 1/2 of the local impulse, i.e., a retest of the 110K - 109200 support zone, which, in turn, could lead to another bullish run to 115K - 120K.
Best regards, R. Linda!
The trend line is not broken and the medium to long term is bull
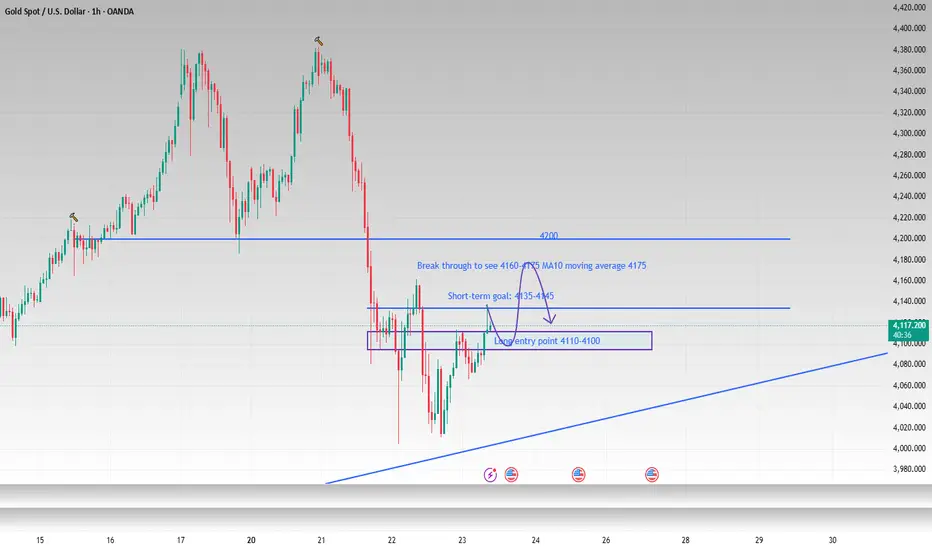
Good morning, bros. Gold has fallen from its high of 4380, dropping nearly $380. This significant drop is relatively rare in the past six months. However, judging from the 4H cycle trend, the current gold price is still above the rising trend line. The 4000 mark is a defensive point for bulls. The decline will only continue after successfully breaking through 4000. Yesterday, the lowest point only retreated to around 4015-4005 before it began to rebound. Although it did not provide us with an ideal entry opportunity, it also confirmed the determination of the buyers below to hold on to the 4000 mark. Therefore, until a clear break below the trend line is achieved, our bullish outlook remains unchanged.
The gold price rebounded to around 4135 during the day and then fell back. As I told you yesterday, this position is a relatively dense trading area. I believe the current decline is the market accumulating strength to hit yesterday's rebound high, and it also provides us with a good opportunity to enter the long market. Pay attention to 4110-4100 below. If it retreats to this range, you can try to go long on gold in batches. The first target can continue to look at 4135-4145.
OANDA:XAUUSD
Gold is correction done? 22/Oct/25XAUUSD probably will break the uptrend line (blue) since triangle breakouton August as price now just stalling at the trendline before creating panic selling /stop lost..Price could reach as low as 3940 +/- before...

XAUUSD SUPPORT, RESISTANCE & TRENDLINE ANALYSISTarget hit for upside and downside both. Check my previous post.
Go "LONG" if it breaks 4097.28 with 4126.59 as the first target. If it breaks that then might touch 4156.22 and breaking that might lead to 4201.
If it breaks above 4160 then we can plan for 4215 & 4265 as the possible targets (This is for the long term)
Go "SHORT" if it breaks 4097.28 with 4067.96 as the 1st target and breaking that might lead to 4038.47
Till it stays below 4160 then 4010 &3945 should be are downside targets (This is fir the long term)

US OIL SUPPORT, RESISTANCE & TRENDLINE ANALYSISMY all targets hit for "LONG" in previous post.
Go "LONG" if it breaks 60.67 with 60.78 as the target. If it breaks that then move up-till 61.04 and breaking that might lead till 61.14.
Go "SHORT" if it breaks 60.32 and target till 60.09 and if it breaks that then 59.97 might be the next target and breaking that might lead to 59.61.

Ethereum Uptrend Under Pressure, Setup in PlayETH/USD is clinging to uptrend support, providing a level that can be used to build setups around. The first thing that stands out is the inability for the price to bounce meaningfully, differentiating it from last week, at least so far. Secondly, prior to Wednesday’s bearish candle, there was a string of dojis, indicating that while the recent price action has been bearish, there’s still plenty of indecision out there as to whether the move will extend.
As things stand, momentum signals favour downside with RSI (14) and MACD shifting from neutral to bearish territory. However, marginal bullish divergence between RSI (14) and price provides an early warning signal that downside pressure may be in the process of bottoming. As such, while selling rallies and downside breaks is preferred, until one of those eventuates, there’s still opportunity to look for short-term countertrend trades.
If we see a definitive break of the April uptrend and push below the October 17 low beneath $3700, shorts could be established with a stop above either level to protect against reversal. $3500 and $2930 screen as two potential targets.
However, if the trendline continues to be defended successfully, longs could be established with a stop beneath either today’s or the October 17 low for protection. $4100 or the 50-day moving average loom as possible targets.
Good luck!
DS


Adobe at major support - Target $603Adobe has been ranging for years to finally let the long term trend catch up. $603 is the target for and it will likely form support above there. Finally Adobe should break out of this range.
This is not a fast trade btw.
Good luck!

Precious metals are not dead - Long at 5.13Despite what market headlines would have me believe, I am still a strong believer in precious metals here. De-dollaring by foreign countries, or at least hedging their dollars invested here is real and ongoing. Goods inflation is starting to re-enter the chat, and the rest of the market is feeling wobbly, to say the least. While I'm no buy and holder of this or any stock, those tailwinds are good ones to have. The stock is still solidly in an uptrend, and there is nearby support as well. Also, it has pulled back 25% already and rallied 5% intraday off its low to close above near term support. I like all of that.
The correction in gold, frankly, is a normal and healthy one in my opinion. Does it continue? Maybe. But I do think it's a bit of an overreaction here. Other precious metals are simply along for that ride. This stock has made me too much money too many times to ignore this opportunity at this level. In fact, I got in yesterday (and again at the close today at 5.13). I think there's a very real chance of a double digit percentage rebound from here.
If you doubt this, I get it. But I would look at those past ideas I've posted and how those turned out before you dig your heels in too hard against this one. But, markets only function when there are opposite viewpoints about the future price of a stock, so have at it if you're a bear here. If this takes a while to resolve, I am not at all opposed to tactically adding more if the opportunity is a good one, or taking profits for the same reason.
As always - this is intended as "edutainment" and my perspective on what I am or would be doing, not a recommendation for you to buy or sell. Act accordingly and invest at your own risk. DYOR and only make investments that make good financial sense for you in your current situation.

Hunt for Green October Have taken LONG position at 107,975. With a stop at 104,000, so far we have survived. Since the Weekly did close above 107K, the hope is that BTC will rise this week.
www.tradingview.com

Bitcoin outcome!BTC has been in a range and at a SUPPORT zone now. Good probibility of it climbing back up this week or next or going down and bouncing off next zone.

ETH short?Salaam
ETH broke symmetrical triangle to the downside after down impulsive move, so I expect downside continuation.
For more confirmation watch today candle close below yesterday and below the triangle.
The projective target of the triangle is somewhere about 3100 - 3200.
Remember about risk management
Good luck

NBIS : Long worth TryingNebius group stocks are technically strong.
The downtrend since November 9, 2021 has been broken and the price is trading above the 50 and 200-period moving averages.
When we draw a medium-term Fibonacci level, we can take the take profit point at 0.618 and the stop-loss point at 0.382.
This gives us a Risk/Reward Ratio of 3.00.
A small position size is ideal.
Risk/Reward Ratio : 3.00
Stop-Loss : 43.46
Take-Profit : 60.00

XPL : The rise of a star or an illusion?Hello friends
Technically, this currency has formed two important supports after its decline and a resistance level has been identified.
Note that for price growth, it is very, very important that resistance is broken, so don't go buying and then say why it didn't grow. We need volume for growth, and with volume, resistance is broken, and in that case, we can wait for the specified targets to move.
This coin is on the Swift blockchain in the DeFi space, which has attracted a lot of market attention, which could be very important, and many are investing in next-generation layer 1 networks and the powerful DeFi protocol instead of Ripple.
Of course, this project is very attractive on paper, but always observe capital management and avoid emotional decisions.
*Trade safely with us*

AVAX : Under the priceHello friends
well, technically, this currency has hit its resistance and formed a double top pattern, and here we have found good and strong support, which can be purchased in stages with capital and risk management, and moved with it to the specified target.
From this perspective, you should note that this currency is currently trading below its intrinsic value, and given that it is a good project, there is a good opportunity to buy it with this decline.
*Trade safely with us*

EURGBP — Daily vs 4H ChartEURGBP — Daily vs 4H Chart 📊
The overall trend remains bullish, but price has reached a weekly resistance zone (Blue Zone) and is currently showing a bearish local reaction.
The last Higher Low (HL) is not yet broken, and a bullish trendline is creating additional support at that same area.
On the 4H timeframe, I’ll wait for price to reach the support zone and observe its reaction to the bullish trend.
I’ll decide to buy or sell based on a clear price action confirmation.
Buy Target → 0.87139
Sell Target → 0.86402
OANDA:EURGBP

SLPUSDT will pump hard that you will regret Why you miss itFrom a technical and fundamental perspective, BINANCE:SLPUSDT presents a compelling case for significant appreciation in the current market cycle. Our analysis suggests the asset is substantially undervalued relative to its long-term potential, currently trading at a significant discount to its perceived intrinsic value.
The technical structure indicates that a robust bullish phase may be imminent. A conservative initial projection, based on classical measured move objectives and the scale of the prior consolidation, points toward a potential upside of +500%. This initial surge is anticipated to accomplish two critical technical feats:
Breach Key Resistance Levels: It would likely overpower several significant technical resistance zones that have historically contained the price.
Trend Change: Such a move would not be an isolated event but rather the likely catalyst for a sustained bullish market regime, shifting the longer-term trend structure decisively to the upside."
DISCLAIMER: ((trade based on your own decision))
<<press like👍 if you enjoy💚

SHIBUSDT this dead and sleep coin always move lateThe asset has been consolidating within a well-defined, prolonged trading range for an extended period, exhibiting low volatility and diminished trading volume. While this can test a trader's patience, such periods of compression are often the precursor to a significant directional move, as energy accumulates within the range.
Our technical analysis suggests a growing probability of an eventual resolution to the upside. The critical technical level that will confirm this bias is a decisive breakout and sustained close above the upper boundary of this multi-year range.
Upon a confirmed breakout, the initial objective would be a retest and subsequent breach of the key descending trendline (marked in red). A successful break above this dynamic resistance would serve as a powerful secondary confirmation of a major trend reversal. This sequence of events—range breakout followed by trendline breakout—would likely catalyze a strong bullish impulse, generating the momentum required to propel the asset toward our primary technical targets as outlined on the higher timeframes.
DISCLAIMER: ((trade based on your own decision))
<<press like👍 if you enjoy💚

DOGEUSDT the heavy pump soon again will start Price action has conclusively broken below the key descending trendline (marked in red). Following a standard retest of this breached level as new resistance—a classic technical phenomenon—the asset experienced a significant downward impulse. This sell-off appears to have concluded, having likely exhausted the underlying selling pressure.
We are now monitoring for a potential shift in market structure. Soon again if price mange to get back above that trendline(above 0.21$) then market is again bullish and massive pump ahead.
Should this occur, it would constitute a robust bullish signal, indicating that buyers have regained control. Such a breakout would invalidate the prior bearish breakdown and likely trigger a short squeeze, fueling a strong upward momentum. The initial measured move target from such a breakout structure projects a rally toward the $0.40 resistance zone, which represents the next significant technical objective on the higher timeframe.
DISCLAIMER: ((trade based on your own decision))
<<press like👍 if you enjoy💚
