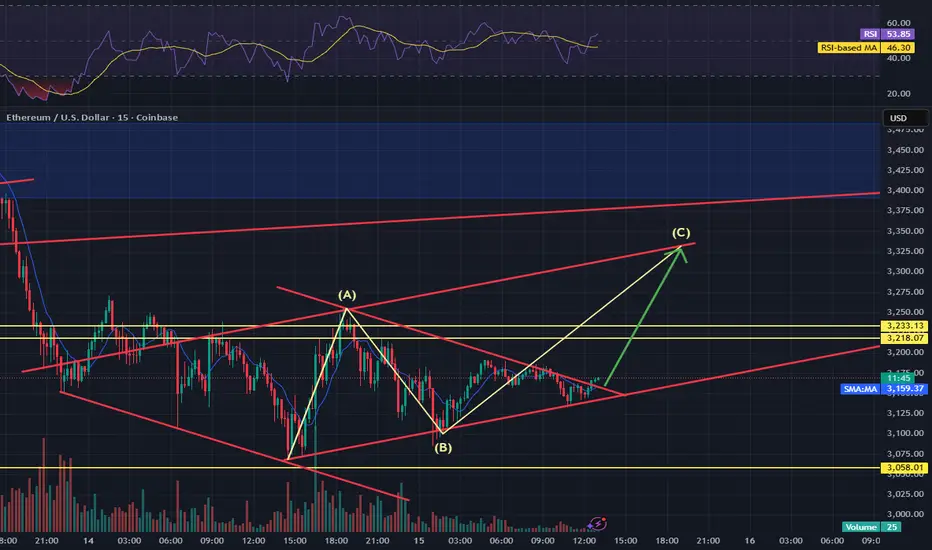
ETHUSD in ABC consolidation ETHUSD is in ABC consolidation at the moment looking for the C leg to the north side. This seems to be a confirmation for resistance move before wave 5 to the south starts.
Trend Lines
EUR/USD - Multi Timeframe Analysis🧭 WEEKLY – Big Picture Bias (HTF Boss Level)
The weekly is consolidating inside a massive range between the mid-1.14s and the mid-1.18s.
Price has been stuck in that orange consolidation box for ages — building orders, trapping both longs and shorts.
But here’s the key:
🔥 Wave count wants a (3) push up
🔥 Structure is still bullish
🔥 Lows are protected
🔥 Liquidity is stacked ABOVE
Weekly is screaming:
➡️ “When I break out of this range, I’m sending it toward 1.20+.”
This is the expansion phase loading.
📅 DAILY – The Transition Zone
Daily just broke structure (BOS) and is pulling back into a clean Daily demand block.
This is the “engine room” for the next leg.
✔️ Trendline retest
✔️ Clean demand
✔️ Deviation → reclaim
✔️ Rejection of lower channel
And above?
📌 External BSL at the top of the channel
Price LOVES that level.
Daily bias:
➡️ Pullback → continuation into 1.17 – 1.18 zone
Daily wants to go UP.
⏳ 4H – Execution Level (Where You Actually Enter)
This is where the chess game gets spicy.
4H is sitting right above strong support with:
🔹 BOS
🔹 Retest of weak resistance
🔹 Re-entry into the channel
🔹 Daily demand just below
🔹 Perfect wave (1)(2)(3)(4)(5) corrective structure already completed
4H is showing small bearish trendline pressure,
but it’s weak — not impulsive, not HTF aligned.
So the play is:
🔻 Let price tag the daily demand (grey box)
🔺 Load the buy
🚀 Send to 1.17 – 1.1850 entry zone
Once 4H breaks that weak resistance?
It becomes a clean runway.
🎯 Full Forecast Summary (Simple Version)
HTF (Weekly)
🚀 Bullish
📌 Consolidating before expansion
🎯 Target: 1.2000 area (after breakout)
Daily
🔻 Pullback into demand
🔺 Reversal expected
🎯 Target: 1.17000 – 1.18000
4H
🟦 Buy zone: Daily demand (grey box)
🔥 BOS already complete
🎯 First target: 1.17000
🎯 Second target: 1.18500
Bias :
➡️ Bullish after retest
➡️ Continuation move is building
➡️ Lows are protected, highs are exposed
⚡ The Story the Chart is Telling
“Let me correct into demand, tag the daily block, kick the weak trendline away…
then I’m flying to take every BSL above.”
This is clean SMC + Elliott alignment.
Textbook.

PEGA - New 52-Week High, Next Stop All-Time High?PEGA - CURRENT PRICE : 66.27
PEGA has shown strong bullish momentum after breaking above its 52-week high resistance at USD 61.00. The breakout was followed by a successful retest, confirming strong buying interest and trend continuation.
RSI (45) remains steady above the 50 level, indicating a healthy and sustained uptrend with no signs of overbought pressure yet. Take note also that there is a rising support line - indicating demand is getting higher. If momentum continues, the stock has potential to retest its all-time high at around USD 74.40, representing strong upside potential. The stock’s immediate support lies at USD 57.66, aligning with the gap zone (rising window) formed earlier, which is expected to serve as a strong support area.
ENTRY PRICE : 64.00 - 67.00
FIRST TARGET : 74.30 (slightly below actual all time high resistance)
SECOND TARGET : 80.00
SUPPORT : 57.66

Gold - Next move🟡 GOLD – NEXT MOVE (Forecast)
This chart is screaming HTF correction vibe, lining up for a bigger rocket-launch leg once price finishes doing its clean-up job below. Let’s break it down 👇
🧱 1. Strong Resistance Above – The Big Ceiling
Price got smacked from that external BSL zone up top. That level is no joke — heavy sell orders sitting there, and the market reacted exactly as expected.
Think of that zone like the bouncer at the club:
➡️ “Not tonight bro.”
So yeah — rejection ✔️
🔻 2. Current Move = Sweepy Pullback Energy
Price is now dripping down in a corrective way.
Nothing impulsive.
Nothing aggressive.
Just a classic “let me grab liquidity before I send it” pullback.
We've already seen internal sell-side taken…
But the real bag sits lower. 👇
🧊 3. Strong Support Below – The Bounce Zone
That external SSL + demand block + trendline confluence zone is STACKED.
This is the place where market makers love to refill the engine before a major up-leg.
Expect price to:
✔️ Sweep liquidity
✔️ Tap the demand
✔️ Tag trendline
✔️ Rebalance the inefficiency
➡️ THEN send it 🚀
Basically…
“dip for the drip.”
📈 4. What’s Likely Next? (The Forecast)
Here’s the clean sequence:
🔻 Step 1 — Price dips into strong support
Red arrow on your chart nails the idea.
Expect that slow grind down, maybe a wick flush to catch late sellers.
🔄 Step 2 — Reversal formation
Small accumulation
Fake break
Wick trap
All the usual suspects.
🚀 Step 3 — Explosive rally back toward major resistance
Once demand holds, expect a fast, impulsive, and clean leg right back into the 4,300+ resistance zone.
This is where wave traders, SMC traders, and Elliott heads all agree:
BIG MOVE LOADING.
Wave (iii) also aligns perfectly with this.
🧭 5. Summary (Trader Friendly)
🔥 HTF = bullish (correction before continuation)
🧊 STF = bearish pullback into demand
🛒 Ideal Buy Zone = strong support + SSL
🎯 Target = 4,300 – 4,350
🚀 Bias = bullish after the sweep
⚠️ Avoid buying early — let the liquidity grab play out

Bitcoin cycleIt is the probability of crypto sociaty but I believe it will fall to around 65K and maybe the next glorious time for bitcoin will be in the middle of 2027.

Major Move After Range ConsolidationThe consolidation has occurred after a substantial sell-off, which suggests this could be an accumulation/re-accumulation phase. The question is: will it break to the upside and begin a sustained recovery, or will the breakdown resume the bearish trend?
Trade Idea - Long Scenario
Entry: Confirmed breakout and retest of the resistance level.
Target: The conservative target projects a move toward the $0.080 - $0.085 area.
Stop Loss: A daily close back below the support level or below the most recent swing low within the pattern.
The R:R is looking good, but wait for a definitive breakout.
Good Luck!

The Silent Giant – Major Bullish Breakout on weeklyThe setup suggests that ICP may be breaking out of a long descending period, indicating the start of a new major uptrend leg.
Entry Zone: Shown on the chart at the support zone
Stop Loss (SL): 4H close below 2.470 doesn't support the upward momentum. That is a crucial level that should not be broken.
Take Profit (TP) Targets:
TP1: $12.68
TP2: $16.36
TP3: $20.20
Never Risk More Than 1-2% of your Total Account. Only enter this trade if you fully understand the risks involved. Trading is speculative.
Good Luck!

NAS100 8H - real correction or just another dramatic rehearsal?NAS100 held the 24850–25000 demand zone with precision, forming a classic false break followed by a sharp recovery back into the rising channel. Volume expansion on the reversal, strong lower wicks, and sustained support at the dynamic trendline all signal that the medium-term bullish structure remains intact. The path toward 26300 inside the channel stays open, and a breakout above this level unlocks the next target at 27300 - the upper boundary of the current impulse.
The NAS100 index represents the core of the US tech sector, reflecting demand for IT, cloud infrastructure, AI technologies, communication platforms, and high-growth digital companies.
Fundamentally , the backdrop on November 15 strengthens the bullish case: the market continues to price in a softer Fed stance, bond yields are easing, major tech companies are raising guidance, and demand for AI-driven solutions remains stable. With inflation trending into a manageable range and expectations for improved credit conditions rising, liquidity is rotating into high-beta assets, providing structural support and limiting corrective depth. Strong margins, solid earnings and resilient tech demand continue to anchor the broader uptrend.
As long as price holds above 24850–25000, the bullish scenario remains active. A confirmed breakout above 26300 opens the way toward 27300. Any controlled pullback into 24850–25000 remains a buy zone within the prevailing trend.
NASDAQ likes to overact, but more often than not it’s simply warming up before the next performance.

Weakening economy? How about pawn shops?@matthias brought up EZPW in a conversation we were having today and we got talking about how pawn shops are like BNPL stocks, but with interest income and physical collateral in case loans don't get paid back. In what looks to be a somewhat sputtering economy that I, personally, think will get weaker as AI gets better and better at replacing more and more people at their jobs, stocks like these offer relative security.
They are somewhat inversely correlated to the market - when things get worse in the economy, business tends to pick up for them. If inflation re-enters the chat, they have physical collateral/inventory (a lot of which is gold and silver jewelry) that rises in value. You can see how it performed back when the tariff tantrum was going on in Feb and March.
It has been in a strong and steady uptrend all year, and is currently well above its 200 EMA. A rebound in gold should, in theory, help stocks like this one, too. The method I'm using here today has resulted in 26 winning trades on the year, with 0 losses. The average gain is about 1.84% (this is a first profitable close method) and the average trade length was 4.4 trading days. This generated a .42% per day held gain, which is +106% annualized.
As a bonus, 21 of the 26 trades closed in 1 or 2 trading days, freeing up my money to go back to work elsewhere if this plays out that way too. Not many other stocks in the market right now offer a chart that looks like this, with fundamentals that get rosier as things elsewhere in the portfolio get gloomier. I got in at the close at 158 even.
If the trade drags out, I will happily add to the position tactically and take profits on those additions the same way.
As always - this is intended as "edutainment" and my perspective on what I am or would be doing, not a recommendation for you to buy or sell. Act accordingly and invest at your own risk. DYOR and only make investments that make good financial sense for you in your current situation.

FCX down to $35, then $25Looks like a clear downtrend back down to $35.
Watch what happens at $35.
- how much demand
- only only short-term or longer-term demand
Here rice will get a change to pop higher, and potentially challenge this current downtrend. But likely, price will still continue to fall lower.
No guarantee it will reach as low as $27, need to watch as price unfolds. But wouldn't be surprised to see this happen, then have some bullishness enter the market (whether for the short- or long-term period).

My target was4070Today and yesterday i just said we go 4070
It was reealy clear to induce the buy idea
And sweept $$ NYSE:NOW its going down 4000

The S&P 500 is flirting with a close below the 50-day moving aveThe S&P 500 is flirting with a close below the 50-day moving average for the first time since April.
This level has acted as reliable support twice already, and so far the index is reacting in a similar way.
However, the RSI is showing a clear bearish divergence, suggesting momentum is weakening even as price pushed to new highs in October–November.
🔎 Key levels to watch:
• 50-day MA — primary support
• RSI structure — persistent lower highs
• Recent swing lows — potential breakdown trigger if the 50-day MA fails
Price is at an inflection point: either the 50-day holds again, or we finally get a deeper pullback after months of strength.

Gold prices plummeted, but what exactly happened?Gold's technical outlook has shown clear signs of a reversal, compounded by recent comments from Federal Reserve officials that have reinforced bearish expectations. The bullish trend is struggling to hold, and prices rebounded quickly after touching the previous strong support level of 4030. We successfully captured this profit as expected, with the timing perfectly in line with our predictions. From a structural perspective, the short-term gold price movement is a technical correction after an oversold condition. This rebound is a normal technical correction and does not change the overall weak medium-term outlook. The market is likely to continue its downward trend through a period of consolidation. Strategically, the key short-term resistance level to watch is the 4090-4110 area. If the price rebounds but fails to break through this range, it will present a crucial opportunity to short. The overall strategy remains unchanged: focus on selling on rallies, and look for opportunities to short in the 4090-4110 area. Maintain a steady pace, follow the trend, and the market will naturally provide the necessary profit opportunities.

$BTCUSD has it bottomed?BITSTAMP:BTCUSD : there is an AB = CD downside target at $93.6K. Today's low was around $94.5K with high volume. Looks like a selling climax to me.
Market never points you to a clear path with 100% certainty. The $1000 short of the target can be due to front-running -- there were a lot of big money bids placed in the $94K range to catch this flush. Or, the market can still turn down to reach this target.
Since it's quite likely that even if we have another flush down to $93.5K, CRYPTOCAP:BTC can still close above the confluence of three trendline supports, my plan is to hold my positions.
I place a high probability on BTC closing above supports on the weekly chart.

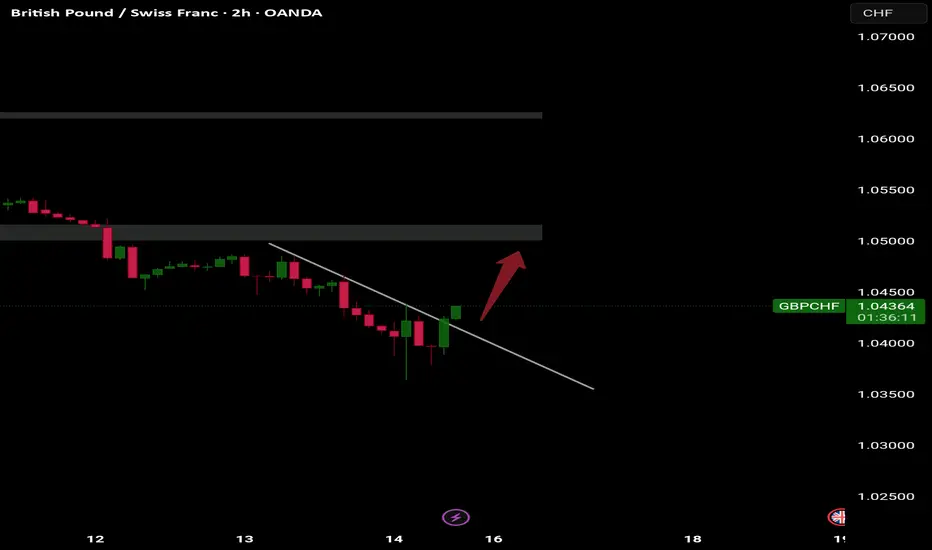
GBPCHF reversingGBPCHF has broken out of the channel and continuing to gain strength. Next week could be the rising week for this pair.
Bitcoin Whales are in again + Stop loss of 100K buyer hitTwo significant market developments warrant attention. First, on-chain data indicates substantial accumulation by large-scale investors, as spot prices have reached multi-month lows, creating what these entities often perceive as value zones. Second, Bitcoin's recent test of the key $100,000 support level triggered a substantial liquidity event, liquidating over-leveraged long positions around this psychologically important threshold.
This confluence of strong institutional buying pressure beneath a major support level, combined with the absorption of sell-side liquidity through stop-loss executions, establishes favorable conditions for a potential bullish reversal. Accordingly, we have initiated a long position with a disciplined 1:3 risk-to-reward ratio, anticipating upward momentum toward our predefined technical targets.
DISCLAIMER: ((trade based on your own decision))
<<press like👍 if you enjoy💚

ZECUSDT Breakout Confirmed: Trendline Broken and 29% Upside AheaZECUSDT is finally breaking out of a multi-week downtrend — the diagonal trendline is broken, volume is ticking up, and the structure signals a potential phase shift.
Price is holding strongly above the broken trendline, forming a base for a possible rally toward 685 → 775 USDT .
Why this moment matters:
Clear breakout of the descending trendline
Price is consolidating above — early trend reversal confirmation
W-pattern structure forming
Volume increasing at the local bottom — buyers stepping in
Entry Level:
Long on a retest of 545–555 USDT
Ideally after a higher-low confirmation.
Stop-Loss:
503 USDT
(Just below liquidity — invalidation point.)
Take-Profit Targets:
685 USDT — first reaction zone
735 USDT — liquidity cluster / previous supply
775 USDT — final major resistance
Potential upside: +24% to +29% with controlled risk.
Technical Breakdown:
Trendline breakout confirms CHoCH
Consolidation above breakout = bullish preparation
Early signs of accumulation in volume
Classic setup: support → breakout → retest → impulse
What to watch next:
Holding the 545–555 zone
Higher lows — bullish continuation
Reaction around 685 — possible short squeeze
Volume strength on breakout attempts

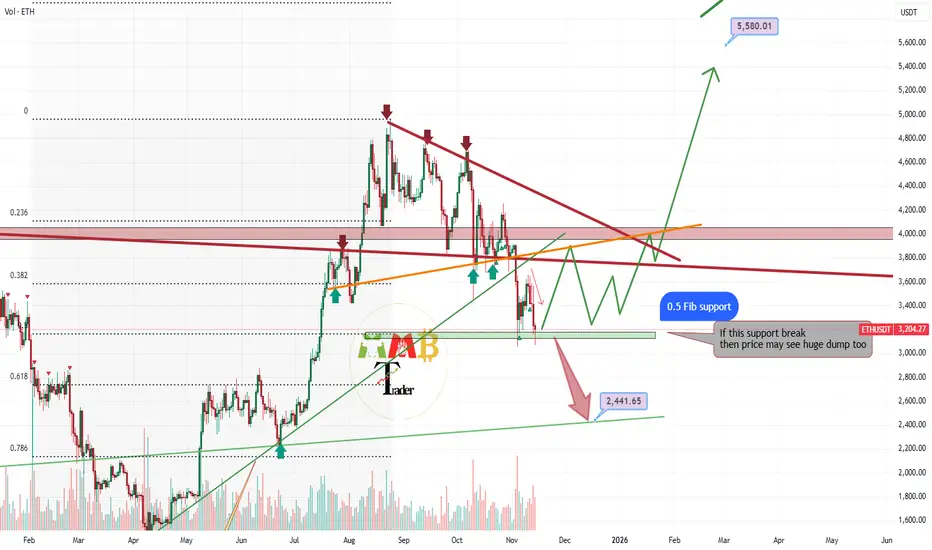
ETH 50% Fibonacci support level hold strong ---> PUMPAs observed on the chart, the descending trendline has exerted significant downward pressure on Ethereum's price. The asset is now testing the critical 0.5 Fibonacci retracement level, which is demonstrating notable support characteristics. Should this technical foundation hold, we anticipate potential strength accumulation sufficient to challenge and potentially break above the key trendline resistance. A confirmed breakout would signal renewed bullish momentum, establishing conditions favorable for a potential ascent toward higher price levels, possibly testing previous significant highs.
DISCLAIMER: ((trade based on your own decision))
<<press like👍 if you enjoy💚
GOLD soon below 3700$Gold has experienced a decisive breakdown below its key trendline support, followed by a technical retest of the same level—now acting as resistance—in a classic role-reversal pattern. The subsequent rejection from this level suggests the bearish momentum is likely to extend further. The current correction appears to be gathering pace, with a breakdown below $4,000 now looking increasingly probable. Should this occur, the next primary technical target would be the $3,700 support zone.
DISCLAIMER: ((trade based on your own decision))
<<press like👍 if you enjoy💚

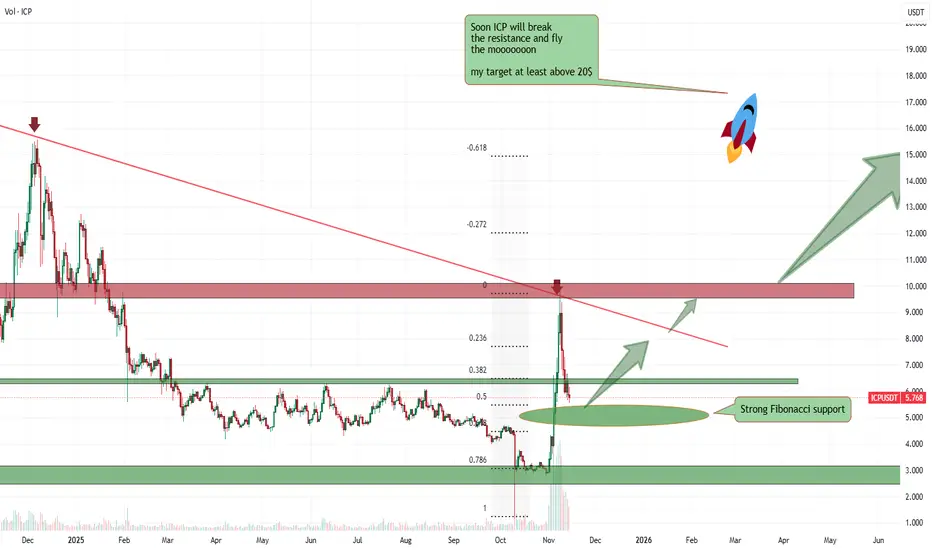
ICP testing major Fib support level and soon pump As observed on the ICPUSDT chart, the price is currently testing significant Fibonacci retracement levels—specifically the 0.5 (50%) and 0.618 (61.8%) levels—which align with a historically strong support zone. The consolidation near these technical confluence levels suggests potential accumulation, and a decisive rebound from this area could initiate the next bullish phase toward our primary technical targets, beginning with the $20.00 level.
DISCLAIMER: ((trade based on your own decision))
<<press like👍 if you enjoy💚
GOLD (XAUUSD): Important Demand Zone Ahead
Gold dropped strongly today, starting a correctional movement
that I predicted earlier this week on a live stream.
I see a test of a major demand cluster based on a rising trend line
and a horizontal support.
With a high probability, the price will rise from that.
Look for a confirmation on lower time frames for safer entries.
❤️Please, support my work with like, thank you!❤️
I am part of Trade Nation's Influencer program and receive a monthly fee for using their TradingView charts in my analysis.

The bullish structure remains intact, we remain bullish.#XAUUSD TVC:GOLD OANDA:XAUUSD
Looking at the hourly chart, the short-term resistance level is at 4210, which is also the high point of yesterday's NY session rebound. Although gold encountered resistance and pressure again during the day, as long as this resistance is broken, it will continue to test the 4245-4260 level.
Gold has fallen back again, but the bullish structure has not been broken in the short term. The current pullback can be regarded as a technical correction, so I am still inclined to be bullish on gold. The daily MA5 has also risen to around 4160, which is exactly the important support level I emphasized yesterday. Therefore, if the price retraces to 4160-4145 again during the European session, we can continue to go long on gold.

Is a gold price collapse signaling the end of the bull market?Today's market is likely to continue its downward trend. The strategy should be to sell on rallies. The primary focus is on the 4200 level, a key support/resistance level. If the downward trend continues, short positions can be initiated near 4200, with an initial target of 4145 and a further target of the key support at 4100. Only a decisive break below 4100 would confirm the formation of a secondary high. If the rebound holds above 4200, be wary of a large-scale market correction. Short-term resistance is around 4210; a break below this level would target yesterday's high, with the possibility of a second test to confirm the secondary high. Today's market is prone to surprises. While the technicals suggest a continuation of the downward trend, sudden fluctuations should be monitored. Initial resistance is around 4100; a short position can be initiated if it holds. Further upside targets are 4230-4240, where short positions can be initiated. Support is around 4100; a long position can be initiated if it holds.
