GBP/USD: Very Bullish PatternThe GBPUSD pair is currently trading in a long term bullish trend.
Earlier this month, the market established a new higher high, subsequently initiating a corrective movement.
A bullish flag pattern has formed, within which a minor bearish trend has been established.
Yesterday, the pair began to appreciate, with buyers successfully violating the resistance level of the flag.
This development may potentially instigate a trend-following movement.
The next objective is 1.3385.
Trend Lines

Selena | BTCUSD – Bullish Structure Holding Above TrendlineBITSTAMP:BTCUSD
Price continues to respect the ascending trend structure formed after the breakout from the descending channel.
The current pullback into 91,400–91,850 support aligns with rising trendline confluence, making this the critical continuation zone for the next bullish leg.
🔹 Bullish Setup
A confirmed rejection from support + breakout above 93,600–94,000 will open the next expansion leg.
🎯 TP1 → 94,800
🎯 TP2 → 95,600
🎯 Final Target → 96,300–96,800 liquidity zone
🔸 Invalidation
❌ Break & close below 91,300 weakens continuation potential.
Next demand is far lower — deeper retracement may unfold.
⚠️ Educational-analysis only — not financial advice.

Gold prices fell as expected, a bearish outlook.Gold Price Trend Analysis: Gold traded in a range on the previous day, closing with a bearish candlestick with upper and lower shadows. Overall, gold continues to fluctuate without a clear directional trend. The market is awaiting the Fed's interest rate decision, and it seems we need to wait for the data to determine the direction. Yesterday's rebound encountered resistance near 4220 and fell as expected. Gold is currently maintaining a slightly weaker, range-bound trend on the daily chart. Short-term moving averages are starting to turn downwards, and the price center is gradually shifting lower, suggesting further downside potential. Short-term support is expected around 4165-4150.
Gold Technical Analysis: On the 4-hour chart, the price broke below the short-term support zone, and the candlestick pattern is gradually coming under pressure from the short-term moving averages, maintaining a slightly weak and volatile trend. In the short term, attention should be paid to a second downward move after a slight rebound. The 4-hour chart shows divergence, with the price falling back after failing to break through the 4220 level yesterday. Recently, it has been maintaining a range of 4170-4220, but the highs of this week's rebounds have been gradually decreasing, indicating that the bulls' upward momentum is weak, unlike the previous surge. Currently, it is still maintaining a volatile trend. On the hourly chart, after continuous fluctuations, the technical pattern shows signs of gradual repair. Short-term moving averages are starting to turn upwards, suggesting potential for a short-term rebound. Pay attention to the short-term rebound and repair. Currently, the support level for gold remains at 4165-4150, while the short-term resistance level is around 4210-4220. If it continues to be pressured in the 4210-4220 area, shorting on rallies is still an option. If support is found at 4165-4150, a short-term rebound is possible. In summary, today's trading strategy for gold is to primarily sell on rallies and secondarily buy on dips. The key short-term resistance level to watch is around 4210-4220, and the key short-term support level is around 4165-4150. Please follow the trend closely.

XAUUSD: Bullish Push to 4380?As the previous analysis worked exactly as predicted, FX:XAUUSD is eyeing a bullish breakout on the 1-hour chart , with price rebounding from a key support near cumulative buy liquidation, converging with a potential entry zone that could ignite upside momentum if buyers hold against short-term dips. This setup suggests a continuation opportunity amid the recent uptrend, targeting higher resistance levels with excellent risk-reward .🔥
Entry between 4155–4170 for a long position (entry at current levels with proper risk management is recommended. Targets at 4300 (first) , 4380 (second) . Set a stop loss at a close below 4130 , yielding a risk-reward ratio of approximately 1:3 to first target and up to 1:5 overall . Monitor for confirmation via a bullish candle close above entry with rising volume, leveraging gold's momentum near ATH.🌟
Fundamentally , gold is on pace for a fourth consecutive monthly gain in November 2025, rallying toward the $4,400 region amid increased Fed rate cut bets and its safe-haven appeal. As of November 28, prices hover around $4,200 after surging from $4,082 earlier in the week, driven by market expectations of Fed easing and global uncertainties, with forecasts eyeing further upside if resistance at $4200 breaks. 💡
📝 Trade Setup
🎯 Entry (Long):
4155 – 4170
(Entry at current levels also possible with proper risk management.)
🎯 Targets:
• 4300 (first)
• 4380 (second)
❌ Stop Loss:
• Close below 4130
⚖️ Risk-to-Reward:
• ~1:3 to first target
• Up to 1:5 overall
👇 Share your thoughts below! 👇

Does a fluctuating gold price necessarily mean an upward trend?
news:
On Tuesday (December 9) in early Asian trading, spot gold traded in a narrow range, currently hovering around $4,192 per ounce. On Monday, spot gold prices fell slightly, closing at $4,190 per ounce, down 0.2%, while US gold futures settled down 0.6% at $4,217 per ounce. The market is taking a brief breather ahead of the Federal Reserve policy meeting, with investors holding their breath awaiting the latest statements from Fed Chairman Powell. Meanwhile, geopolitical tensions, dollar volatility, and unexpected events such as the Japanese earthquake are all subtly influencing gold's price movements.
Federal Reserve Chairman Jerome Powell stated that this rate cut is similar to the risk-management-driven rate cut in September. A December rate cut is far from certain, and a lack of economic data could provide a reason to pause rate adjustments. If information is lacking and the situation remains unchanged, there are reasons to slow the pace of rate cuts. There is significant disagreement within the committee regarding how to act in December. A growing number of officials want to postpone the rate cut, believing that at least one cycle should be waited. The government shutdown has cut off sources of economic data, but existing data suggests that the outlook has not changed significantly. Private data is being considered, but it cannot replace official data. Inflation levels remain slightly high, recent inflation expectations have risen, and long-term expectations are solid.
Technical indicators:
Looking at the 1-hour chart, the key resistance level to watch is 4240, with further short-term resistance around 4215-20. On the downside, the key support level is 4165-75. Technically, the current consolidation suggests a tendency to short on pullbacks. We should patiently wait for key entry points. Specific trading strategies will be provided in the channel; please pay close attention.
Strategy Signals:
Buy:4215-4220, stop loss : 4228, target :4190-4180.

Big Week for USD: USDJPY Approaches Major Sell Zone!Hey Traders,
In today's trading session we are monitoring USDJPY for a selling opportunity around the 155.750 zone. USDJPY is trading in a downtrend and is currently in a correction phase, approaching the trend area at 155.750, which acts as a key support-turned-resistance level.
On the fundamental side, recent U.S. data continues to support a weaker Dollar as markets increasingly price in a 25bps cut heading into the FOMC. With traders front-running the event, USD momentum remains fragile. If the market over-prices the move ahead of Wednesday, be cautious of the classic "buy the rumor, sell the fact" dynamic.
This broader Dollar softening environment supports further downside in USDJPY as long as the pair remains below the trend structure.
Trade safe,
Joe.

GOLD Buying Trade idea From the Support LevelHello Traders
In This Chart GOLD HOURLY Forex Forecast By FOREX PLANET
today Gold analysis 👆
🟢This Chart includes_ (GOLD market update)
🟢What is The Next Opportunity on GOLD Market
🟢how to Enter to the Valid Entry With Assurance Profit
This CHART is For Trader's that Want to Improve Their Technical Analysis Skills and Their Trading By Understanding How To Analyze The Market Using Multiple Timeframes and Understanding The Bigger Picture on the Charts

EURUSD Short: Supply Holds — Pullback to 1.1610 in FocusHello, traders! The price action on EURUSD is unfolding within a well-defined technical structure shaped by an ascending Trend Line, with the market transitioning from consolidation into a corrective pullback. After a prolonged bullish advance, the pair formed a Head and Shoulders pattern near the upper Supply Zone around 1.16660, signaling exhaustion of buying momentum. Following this distribution phase, price broke below the neckline and started moving lower, showing a clear shift in short-term control toward sellers.
Currently, EURUSD spent time consolidating inside the highlighted Range, where multiple false breakouts occurred before bullish continuation resumed. However, the recent rejection from supply and the breakdown from the pattern suggest that upside momentum is weakening. Currently, the price is trading below the former range support and is approaching the Demand Zone near 1.16100, which also aligns with a key horizontal support level.
My scenario for the next move is a continuation toward the 1.16100 demand area, where buyers may attempt to slow the decline. A strong bullish reaction from this zone could trigger a corrective rebound back toward the broken structure. However, if the price fails to hold this demand, the bearish pressure may intensify and open the door for a deeper pullback. As long as the market remains below the 1.16660 supply, the short-term bias stays bearish. Manage your risk!

DOGE near term TARGET $0,34Dogecoin is likely on it's way to more bullish prices.
Since around 22 June, there's been a near "up-only" trend on DOGE, where the price is continuously making higher highs and the corrections are all still higher lows.
In terms of technical indicators, we see strong bullish indication in the weekly timeframe as the price trade above all moving averages:
The daily timeframe's price is trading above the moving averages as well. A good place to watch for SHORT term corrections is the first and second band of the moving averages here:
OKX:DOGEUSDT BINANCE:DOGEUSDT

EURUSD Pullback analysis chart.EUR/USD – Structure & Trend Summary
EUR/USD is moving inside a descending channel, respecting both the upper trendline (lower highs) and the lower trendline (lower lows). Price continues to react from the channel boundaries, confirming a bearish market structure.
Recent price action shows:
Rejections from the upper trendline, forming repeated HH (lower high attempts) but failing to break the bearish channel.
Strong bearish impulses from each lower high, creating symmetrical downward legs.
Support touches on the lower trendline, followed by corrective pullbacks.
The latest swing has again rejected the upper channel line and is showing momentum toward the downside.
Bias: Bearish
Expectation: If structure continues to hold, EUR/USD may extend toward the lower trendline once again, aligning with previous –0.37% measured moves.
Key Notes:
Channel resistance remains strong.
Market respecting HH → HL swings but still failing to break bullish structure.
As long as price stays below the trendline, bearish continuation remains likely.
What you think about EURUSD, write your feedback in comment section.

XAU/USD Daily Outlook – Tuesday Strategy
The Tokyo session offered a decent buying opportunity, which I utilized by opening a position at 4175.5 and closing at 4185. This early move reinforces the view that intraday selling pressure remains limited, aligning with my mid-term bullish bias.
Market Context
Investors have largely priced in a Federal Reserve rate cut, but the real risk lies in the magnitude of the easing cycle. A milder-than-expected approach could disrupt linear bullish momentum and introduce volatility. With the Fed decision scheduled for Wednesday, the market is in a cautious stance, balancing technical setups with macro uncertainty.
Technical Outlook
Key Resistance: 4200 (psychological benchmark)
Bullish Scenario: I’ll remain on the sidelines until we see a clean break above 4200.
Once confirmed, I’ll engage long positions targeting 4219 as the next resistance zone.
Bearish Scenario: Price action below 4176 could give sellers momentum, but I’ll avoid shorts unless 4164 is invalidated.
If that happens, targets will be 4152 and 4135.

SPX500 | Markets Position Ahead of JOLTS & Fed DecisionSPX500 – Technical Overview
S&P 500 futures edged higher ahead of the JOLTS job openings report, the final major labor indicator before the Federal Reserve decides on interest rates tomorrow.
Markets are pricing an 89% probability of a 25 bps rate cut, suggesting strong expectations for policy easing.
Nvidia is also in focus as traders monitor tech-sector momentum and its influence on index direction.
Technical Analysis
SPX500 holds bearish momentum for today while trading below the 6873–6888 zone.
A deeper bearish continuation is likely below 6852, with downside targets at 6815 and 6798.
On the upside, a 1H or 4H close above 6888 would invalidate the bearish setup and shift momentum toward the ATH levels at 6918, with extended potential toward 6990.
Key Levels
Pivot Line: 6860
Support: 6837 · 6818 · 6798
Resistance: 6873 · 6888 · 6918

EURJPY: Bullish Push to 182?FX:EURJPY is eyeing a bullish continuation on the 4-hour chart , with price consolidating near major and minor resistance levels after rebounding from support, converging with a potential entry zone that could fuel upside momentum if buyers break through the resistances amid recent volatility. This setup indicates a rally opportunity post-pullback, targeting higher levels with risk-reward exceeding 1:3.
Entry between 180.800–181.000 for a long position (entry a current levels with proper risk and capital management is recommended). Target at 181.790 . Set a stop loss at a daily close below 180.730 , yielding a risk-reward ratio of more than 1:3 . Monitor for confirmation via a bullish candle close above entry with increasing volume, capitalizing on the pair's upward bias near key levels.🌟
Fundamentally , EURJPY is trading around 181.00 in early December 2025, with focus on upcoming economic data that could drive volatility. For the Euro, key releases include Retail Sales (MoM forecast 0.1%, YoY 1.1%) on December 4 at 10:00 UTC, which could support EUR if stronger-than-expected, signaling resilient consumer spending amid stable growth; followed by GDP revisions (QoQ 0.2%, YoY 1.4%) and Employment Change (QoQ 0.1%, YoY 0.5%) on December 5 at 10:00 UTC, potentially bolstering EUR if confirming economic steadiness. For the Yen, notable events are Household Spending (MoM 0.7%, YoY 1%) on December 4 at 05:30 UTC, which might weaken JPY if indicating softer consumption; and GDP Final (Annualized -1.8%, QoQ -0.4%) on December 7 at 05:50 UTC, where downward revisions could pressure JPY further due to signs of contraction, alongside other indicators like Current Account and Bank Lending. Overall, positive Euro data versus potential JPY weaknesses could favor upside in EURJPY, though markets await these catalysts for direction. 💡
📝 Trade Setup
🎯 Entry (Long):
180.800 – 181.000
(Entry at current levels is valid with proper risk & capital management.)
🎯 Target:
• 181.790
❌ Stop Loss:
• Daily close below 180.730
⚖️ Risk-to-Reward:
• >1:3 overall
💡 Your view?
Will EURJPY break through resistance and push toward 182—or stall below the ceiling?
👇 Share your thoughts below! 👇

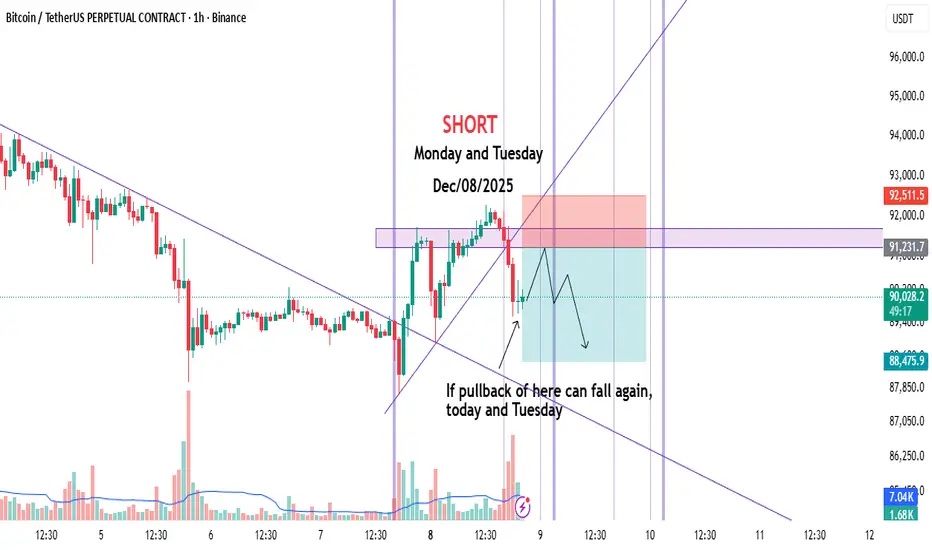
Daily Bitcoin Trade | Short | Monday | Dec/08/2025Hi Guys.
Given the trendline break and the static resistance formation, Bitcoin could be shorted today and tomorrow.
This is my personal setup.
Please be careful with your capital and don't forget the risk.
This is not an offer to buy or sell.
Good Luck :)
XAUUSD – Brian | H1 Volume ProfileXAUUSD – Brian | H1 Volume Profile: risk of deep decline as market awaits PCE data
Market snapshot
On H1, gold is declining in a rather "clean" structure, continuously creating lower highs and lower lows.
The 4.175 area is currently the nearest support – if breached, the decline could extend another 50–60 points to lower areas.
Price remains below 4.250 USD, as the market awaits PCE data (Fed's preferred inflation measure) to find a clearer direction.
Technical map – Volume Profile & price areas
Important areas today: 4.210 – 4.200 – 4.175 – 4.164 – 4.133
4.210–4.200: upper area, coinciding with the nearest POC/VAH cluster – selling pressure likely when price retraces here.
4.175: short-term support + area with sell-side liquidity; if this area is lost, price could be pulled to a deeper demand cluster.
4.164–4.133: potential Buy zone in a deep decline scenario – Volume Profile shows significant buying occurred around this area previously.
In short: on H1, the trend is down, prioritize selling according to volume; consider buying only when price falls to a lower discount area.
Trading scenario reference
(Not personalized advice – adjust volume & SL according to your account)
Scenario 1 – Sell following the downtrend structure (priority)
Sell area: 4.210–4.200 (POC/VAH + technical retracement area)
Idea: Wait for price to retrace to this area, observe H1/M15 for rejection candles (long upper tail, pin bar, engulfing…) before activating a Sell order.
Suggested take profit areas: TP1: 4.175
TP2: 4.164
TP3: 4.133 (in case of a strong 50–60 point decline)
Scenario 2 – Buy at deep discount area
Buy area: 4.164–4.133
Idea: Only consider buying when price has "dumped" deeply enough into the buy zone, with clear reversal candles on H1.
At that point, this is a technical retracement play, not trying to catch the bottom of a major trend.
Suggested take profit areas:
TP1: return to 4.175
TP2: 4.200
Macroeconomic context – Why is gold still hesitant?
Gold recorded a slight increase on Friday, but remains within the narrow trading range of the week.
Expectations of a dovish Fed continue to pressure the USD, generally supporting gold in the medium term.
However, buyers are waiting for US PCE data before taking larger positions:
If PCE cools significantly → reinforces the story of an early Fed rate cut → gold could easily rebound.
If PCE remains stubborn → market fears a "hawkish rate cut" scenario from the Fed → yields may rise, adding selling pressure on gold.
Risk management
For the Sell scenario, avoid chasing price in the middle of the area – prioritize waiting for a retracement to POC/VAH before entering, with a tight SL above the 4.210–4.215 area.
If participating in the Buy play at 4.164–4.133, consider splitting TP and moving SL to breakeven as soon as TP1 is reached to avoid constant chart monitoring.

Gold prices fell as expectedfollowing a continuous bearish trendAnalysis of the gold market trend: Gold has no fluctuations today. Gold has failed to rebound in the US market and is still under pressure at 4220. Gold fell as expected. The gold relay continued to win on Friday, and gold won 3 consecutive victories. The market is currently waiting for an interest rate cut. Before the interest rate cut, we will continue to focus on high altitudes. We have also made it clear that we are shorting near 4220, and the highest is near the 4219 line, which is basically consistent with our expectations. Let’s first look at the line near 4170-4160!
Gold Technical Analysis: Looking at the 1-hour chart, gold is still in a generally downward trend with weak rebounds. If the rebound in the US session continues to face pressure in the 4200-4220 area, shorting at higher levels is possible. With the Fed's interest rate decision approaching, gold is likely to remain range-bound. The hourly chart shows a sideways movement today, with signs of a breakout. A large bearish candlestick completely engulfed two bullish candlesticks, a bearish engulfing pattern. This is a time-for-space consolidation, and the short-term support around 4180 is unlikely to hold. Continue to watch for support around 4160-4150. In summary, today's trading strategy for gold is to primarily sell on rallies and secondarily buy on dips. The key resistance level to watch in the short term is around 4200-4220, and the key support level is around 4160-4150. Please follow the trend closely.

How to find an entry point within a trading range#XAUUSD TVC:GOLD OANDA:XAUUSD
Gold rebounded as expected after retracing to around 4170. Those who followed this strategy and executed long trades may consider taking profits and exiting the market. From the daily chart, the short-term gold price is below the MA5 and MA10, indicating a weak market. If it cannot effectively break through the short-term resistance of 4185-4195 and hold above the daily MA5 and MA10, then gold still has room for a pullback. Meanwhile, looking at both the daily and weekly charts, in the absence of major news events, there is strong support at 4150-4140, which may trigger short-term fluctuations. The first pullback to this level could present an opportunity to go long on gold.

XAUUSD H1 Structure Shift SellGOLD (XAUUSD) H1 Timeframe SELL Analysis
After a strong bullish rally, Gold showed a major reversal where the price tested the 4000 level and then gave an aggressive bullish push. During this bullish wave:
1. Break of Structure (BOS) Confirmation
Price first gave a BOS, and with bullish continuation it respected the bullish trendline twice.
2. Break of Structure
Price tested the bullish trendline again and afterward the market moved inside a Small Bullish Channel (ascending channel), where a higher-high and higher-low structure was maintained.
3. Trend Weakness After the Last BOS
After breaking above the channel, the market formed a lower high, showing that bullish momentum was weakening.
From this point, a Bearish Trendline was created, which is now rejecting the price.
4. Current Market Behaviour (Most Important)
Price retested the Bearish Trendline
Failed to break it rejection occurred
Price is currently trading around 4194
Market structure is now showing a clear bearish shift
As long as the price stays below the bearish trendline, further downside continuation is expected
SELL Trade Setup
Sell Entry
4192 – 4194 zone
Stop Loss 4213
Take Profit Levels
TP1 4170
TP2 4145
TP3 4110
Final Summary
After the bullish rally, Gold gave a reversal, BOS was confirmed, the bullish channel broke down, and now the bearish trendline is strongly rejecting price. A sell setup is active from 4190 targeting 4170, 4145, and 4110, with a stop loss at 4213.

EURUSD Is About to Surprise Everyone…1. Market Structure
- EURUSD is currently respecting a well-defined ascending channel, with price bouncing consistently from the lower trendline and rejecting the upper boundary.
This confirms a strong bullish structure.
2. Key Zones
🔹 Strong Support Zone (Bottom Green)
This is the origin of the current bullish reversal.
As long as price stays above this zone, the macro bullish bias remains valid.
🔹 Weak Support Zone (Middle Green)
Price recently tapped this area again and produced a bullish reaction exactly at the lower channel support.
This confirms buyers are actively defending the trendline.
🔹 Resistance Zone (Top Red)
This is the next major area that could cause a temporary pullback before continuation.
3. Price Reaction
Your chart marks a bullish signal at the channel’s lower boundary. this is a textbook continuation setup:
-Higher lows
-Higher highs
-Trendline support respected
- No structural break to the downside
The circle highlight shows a successful retest, signaling fresh buying pressure..
4. Expected Move
If price holds within the channel:
✔️ Pullback into support
✔️ Bounce from lower trendline
✔️ Break above resistance
✔️ Extension to the top of the channel
The green zig-zag projection on your chart perfectly illustrates this bullish wave sequence.
5. Bullish Scenario
As long as price stays above the lower trendline → EURUSD remains in a clean uptrend.
Next targets: 1.1680 – 1.1700 (Resistance Zone)
Breakout above → Move toward upper channel extension
6. Bearish Invalidation
The outlook fails only if:
❌ Price breaks below the channel
❌ Closes under the weak support zone
As of now — this has NOT happened.
Stay patient and trust the structure — clean price action inside a rising channel often leads to explosive continuation moves.

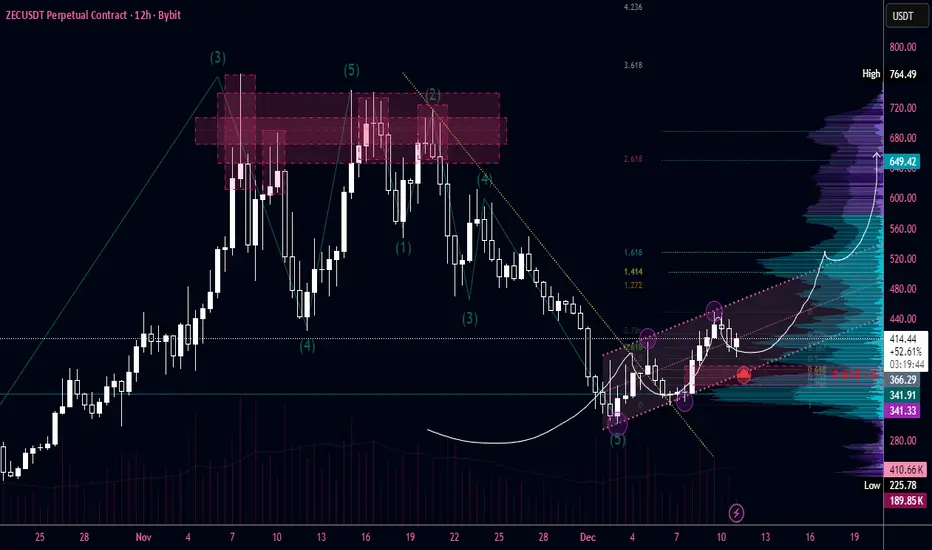
#ZEC — R:R 1:11 Target to update 765 from currentBINANCE:ZECUSDT.P
A very promising asset with a trending movement.
All assets are currently in roughly the same situation.
Here, the price has completed its wave cycle and is beginning to reverse to renew the 765 high. We cannot be sure whether it will be renewed or not.
But this is an excellent entry point to take 2 take. I am sure that the price will work out the POE level and exit the channel. The chart shows frequent touches of the channel walls.
After the resistance wall, the price is lazily moving towards its FVG, which it created through momentum. There is a break in the structure, entry from FVG 0.618 - 0.702 (exactly in the middle of FVG 12H).
Even if we don't manage to open a position, we have two targets and can open a position after the channel breaks on a retest and still have a good RR. In this trade with my POE, it is 1/11. I will be patient.
At the 1.618 - 1.272 Fibonacci level zone, there is a large HVN, followed by an equally important one at 2.618 with very strong resistance and liquidity, where the price is likely to go without difficulty.
I set small stops in such cases because I plan to go far on the price. In case of a breakout of 0.702-0.786 and the absence of a sharp impulse in the long, I would prefer not to open a position.
Fifth Spot XRP ETF Set for Launch After CBOE ApprovalThe fifth XRP ETF product is set to begin trading following new approval from the Cboe. This would place the fund in the company of other ETFs that have since recorded over $950 million inflows in less than four weeks.
Cboe Clears Path for New XRP ETF Under Ticker TOXR
The Cboe has approved the listing of 21Shares’ upcoming XRP fund, which will trade under the ticker “TOXR.” This approval was disclosed in a filing to the SEC. The fund will start trading on the exchange once it meets the final requirements.
The current approval brings the list to five different U.S. spot XRP-related funds. This approval comes after 21Shares made its fifth update to its S-1 registration earlier this week to complete the final steps before the launch.
The filing still carries a “delaying amendment.” This means the issuer may be awaiting a CERT notice or direct SEC approval.
Once launched, the XRP ETF will track the CME CF XRP-Dollar Reference Rate, New York Variant. This would expose investors to XRP price performance without having to custody the token. 21Shares publicly hinted at its upcoming launch on X.
The 21Shares TOXR fund is designed to have an annual sponsor fee of 0.3% charged daily and paid weekly in XRP. The issuer improved security and followed regulations by using a system with multiple custodians.
Ripple Markets created initial liquidity for the ETF by providing 100 million XRP. This is currently worth about $226 million. Creation and redemption will be either through in-kind via XRP transfers or via cash settlements.
This would be the latest fund to launch after Franklin Templeton’s spot XRP fund debuted late last month.
XRP Funds Close in On $1 Billion Milestone
The spot XRP ETFs in the U.S. have gathered nearly $1 billion in inflows within less than a month. Total inflows, according to the latest figures, are about $954 million.
Ripple CEO Brad Garlinghouse shared in a post on Monday that XRP has become the fastest-growing U.S. crypto ETF by AUM since Ethereum Demand for regulated products is increasing in the market.
XRP spot funds have not reported any day of net outflows. Just yesterday, despite market fluctuations, it still gained about $10 million in new inflows.
In other news, Ripple released an important update to the XRP Ledger. This update is designed to improve network stability and enhance its DeFi features.

Today’s Market Rhythm Is All About Precision Entries1. Market Volatility
Gold continues to move in a clean “adjustment rhythm,” reflecting an intraday environment where price is fluctuating inside a bearish structure but still producing technical pullbacks.
Volatility isn’t explosive but it’s precisely enough to create high-accuracy entry zones for intraday traders.
2. Trader Psychology
This is the phase where traders often get trapped by small pullbacks or emotional entries.
But those who understand the money flow can clearly see that price is simply cycling liquidity and adjusting before the next move.
Discipline beats emotion especially in timing-based trading.
3. Key Drivers / Market Reasoning
Market structure maintains:
-A slightly bearish overall trend
-Pullbacks acting as liquidity grabs, not true reversals
-Strong liquidity concentration around 4150–4160
-A clear institutional reaction zone at 4237–4240
Based on current flow, both intraday setups perfectly align with the market’s liquidity map.
4. Trading Strategy
📌 SETUP 1: Timing SELL Zone
XAUUSD SELL ZONE: 4237 – 4240
TP: 4234 – 4229
SL: 4244
➡️ This is a trend-following setup.
4237–4240 acts as a liquidity pocket where price tends to sweep before continuing downward.
The previous A–B–C wave structure supports this downward continuation.
📌 SETUP 2: Timing BUY Zone
XAUUSD BUY ZONE: 4147 – 4150
TP: 4153 – 4158
SL: 4143
➡️ This is a counter-trend setup but perfectly aligned with liquidity behavior.
4147–4150 is a key reaction zone a short-term liquidity base where buyers actively step in.
⚠️ Capital management is essential for both setups to maximize efficiency and protect your account.
5. Trend & Price Outlook
Gold is moving within an intraday correction structure, but the broader bias still leans bearish.
Today’s two timing zones highlight the highest-probability opportunities:
SELL 4237–4240: the ideal rejection area
BUY 4147–4150: short-term corrective demand zone
The previous A–B–C model remains valid, showing that price is completing its adjustment phase before seeking liquidity.
If you follow the rhythm you’ll always be a step ahead of the market.
When timing aligns with structure, intraday trading becomes effortless

BITCOIN → Downward trend pressure. 86K - 84K?BINANCE:BTCUSDT.P sold off all the gains associated with Tuesday and Wednesday's news. Technically, a false breakout of resistance is forming against the backdrop of a downtrend. There is no fundamental support.
Bitcoin failed to consolidate above 91800 - 94200, a false breakout was formed, and the price returned to the range. There is an imbalance zone on the chart, which the price may test before falling (weak technical and fundamental background).
The trend is downward in the medium term. A countertrend correction is forming, within which the market is facing pressure in the 94K - 95K zone. Zone of interest is 91850. I expect a retest, liquidity capture, and another phase of selling down to 88K - 86K.
Resistance levels: 91850, 92500
Support levels: 89550, 87980, 86260
The price is in the trading range of 84K - 94K. Resistance has been tested, and a double top reversal pattern has formed. Currently, a distribution phase is forming relative to the specified pattern and consolidation at 91850 - 94200. A retest of the nearest resistance could trigger a rebound and cause the price to fall further to the next zone of interest.
Best regards, R. Linda!
