XAU/USD: Retest of 4,150 Holds as Bulls Eye Channel ExtensionXAU/USD is reclaiming ground above the broken range, retesting the 4,150 zone while maintaining bullish momentum from the recent breakout. Price is forming higher lows along the upward trendline, beneath the descending resistance line.
A sustained move above 4,150 keeps the path open toward 4,285, as long as buyers defend the retest. Momentum remains bullish, with potential for further extension into the upper resistance zone.
❗️ Risks:
– H4 close below 4,150 weakens the setup.
– Strong USD data may trigger a pullback.
– Rejection from the descending trendline could stall momentum.
Trend Lines

XRPUSD: Ascending Triangle in Play – 2.550 is the Key!📈 XRPUSD: Ascending Triangle in Play – Bulls Eyeing 2.700, But 2.550 is Key!
Timeframe: 4-Hour Chart
Ripple (XRPUSD) on the 4-hour chart is currently trading around $2.458, demonstrating a fascinating consolidation pattern. The price is navigating a critical "Deciding Area" while being supported by a robust ascending trendline, setting the stage for a potentially significant move.
Current Price Action & Trend Analysis:
XRPUSD has been in a period of upward consolidation since finding a strong base around the 2.1 level in early November. This recovery has been characterized by higher lows, clearly illustrated by the ascending green trendline acting as dynamic support. Recently, the price has successfully bounced off this trendline, showing resilience and continued buying interest at lower levels.
However, overhead resistance around the 2.550 'Deciding Area' has proven to be a significant challenge. XRP has been rejected from this zone multiple times, preventing a clear breakout to higher targets. This interaction between the ascending support and the horizontal resistance around 2.550 suggests the formation of an ascending triangle pattern, indicative of accumulation or preparation for a breakout. The current price action sees XRP testing the lower boundary of the 2.550 area, attempting to build momentum for a breach.
Key Resistance Levels:
2.550 Deciding Area: This is the most immediate and critical resistance. A decisive break and sustained close above this zone, ideally with increased volume, would be a strong bullish signal.
2.700 Upside 1st Target: Should XRP successfully break above 2.550, the 2.700 level is identified as the 'Upside 1st Target'. This previous swing high would be the next major hurdle.
2.90 to 2.95 Flip Zone: Beyond 2.700, this zone represents a significant 'Flip Zone' where previous resistance could turn into support, or vice versa, indicating a substantial bullish push.
Key Support Levels:
Ascending Green Trendline: This dynamic trendline is providing immediate support, dictating the higher lows in the current consolidation. A break below this trendline would invalidate the current bullish structure.
2.300 Downside 1st Target: If the ascending trendline fails, the next significant support is the 2.300 'Downside 1st Target'. This level could attract buyers, but a breach here would signal increased bearish pressure.
2.1 Next Support: This strong green zone represents the 'Next Support' level, a crucial area that held strong in early November. A break below 2.300 could lead to a test of this significant psychological and technical level.
Bullish Scenario:
The most bullish outcome involves XRPUSD securing a decisive breakout above the 2.550 'Deciding Area'. A sustained move above this resistance would confirm the strength of the ascending triangle pattern and likely pave the way for a rally towards the 2.700 'Upside 1st Target', with further upside potential towards the 2.90-2.95 'Flip Zone'.
Bearish Scenario:
Conversely, a failure to break above 2.550, combined with a decisive breakdown below the ascending green trendline, would be a significant bearish development. Such a move would likely lead to a test of the 2.300 'Downside 1st Target'. If this support is also breached, XRP could see a further decline towards the strong 2.1 'Next Support' level.
Conclusion:
XRPUSD is currently in a high-stakes consolidation, with the 2.550 'Deciding Area' acting as a critical battleground. The ascending green trendline provides crucial support, but repeated rejections from the overhead resistance highlight the need for a definitive breakout. Traders should meticulously watch for a clear break in either direction from this pattern to anticipate XRP's next major move.
Disclaimer:
The information provided in this chart is for educational and informational purposes only and should not be considered as investment advice. Trading and investing involve substantial risk and are not suitable for every investor. You should carefully consider your financial situation and consult with a financial advisor before making any investment decisions. The creator of this chart does not guarantee any specific outcome or profit and is not responsible for any losses incurred as a result of using this information. Past performance is not indicative of future results. Use this information at your own risk. This chart has been created for my own improvement in Trading and Investment Analysis. Please do your own analysis before any investments.

ETHUSD: Caught in a Downtrend Triangle Below Key Targets📉 ETHUSD: Caught in a Downtrend Triangle Below Key Targets – What's Next for Ethereum?
Timeframe: 4-Hour Chart
Ethereum (ETHUSD) is currently trading around $3,440. The price is showing clear signs of bearish pressure, trapped within a developing pattern after failing to sustain higher levels.
Current Price Action & Trend Analysis:
Ethereum has been in a sustained downtrend since hitting peaks in late October, marked by a series of lower highs. The most recent attempt at a recovery was firmly rejected at the 3700 'Upside 1st Target' zone around November 10th-11th. Since this rejection, ETHUSD has been consolidating, largely operating below a prominent red descending trendline that acts as dynamic resistance.
The price is currently hovering around the 3350 'Deciding Area', which appears to be acting as immediate support. However, repeated rejections from the descending trendline (forming a potential descending triangle or wedge pattern) highlight the persistent selling pressure. While the price has found temporary bounces from this 'Deciding Area', the inability to break the overhead trendline suggests continued weakness.
Key Resistance Levels:
Descending Red Trendline: This dynamic trendline, currently just above the 3500 mark, is the most immediate obstacle for any bullish recovery. A breakout above this would be the first hint of shifting momentum.
3700 Upside 1st Target: This was the recent high point before the current leg down and represents a significant resistance level that bulls need to overcome to regain conviction.
3850 to 3950 1st Key Resistance & 4085: These higher resistance zones are currently out of immediate reach but remain significant hurdles for a broader trend reversal.
4200 to 4300 Strong Resistance: This major overhead resistance marks the area of the previous peak and would require a substantial bullish impulse to challenge.
Key Support Levels:
3350 Deciding Area: This grey zone is acting as immediate support. Sustained trading below this area would be a clear bearish signal.
3200 Downside 1st Target: Should the 'Deciding Area' fail to hold, the chart identifies 3200 as the 'Downside 1st Target'. This level could attract buyers but also represents a critical breakdown point.
3000 Key Support Level: This strong psychological and technical support level would come into play if 3200 is breached. It represents a last line of defense for the broader mid-term bullish structure.
Bullish Scenario:
For Ethereum to turn bullish in the short term, it needs to decisively break above the descending red trendline and then firmly reclaim the 3700 'Upside 1st Target' with strong volume. This would invalidate the current bearish pattern and suggest a potential move towards higher resistance levels.
Bearish Scenario:
The prevailing bearish sentiment suggests a higher probability of continued downward movement. Failure to break the descending trendline and a decisive break below the 3350 'Deciding Area' would likely open the path to test the 3200 'Downside 1st Target'. A breach of 3200 could lead to a rapid descent towards the 3000 'Key Support Level'.
Conclusion:
Ethereum is currently at a critical juncture, struggling under a bearish trendline and clinging to the 3350 'Deciding Area' support. The immediate future for ETHUSD hinges on whether it can break out of this descending formation to the upside, or if continued selling pressure will push it towards the 3200 and 3000 support levels. Traders should watch for a clear break from the current consolidation pattern to confirm the next directional move.
Disclaimer:
The information provided in this chart is for educational and informational purposes only and should not be considered as investment advice. Trading and investing involve substantial risk and are not suitable for every investor. You should carefully consider your financial situation and consult with a financial advisor before making any investment decisions. The creator of this chart does not guarantee any specific outcome or profit and is not responsible for any losses incurred as a result of using this information. Past performance is not indicative of future results. Use this information at your own risk. This chart has been created for my own improvement in Trading and Investment Analysis. Please do your own analysis before any investments.

BTCUSD: Bears Solidify Control Below Key Deciding Area – What's 🔥 BTCUSD: Bears Solidify Control Below Key Deciding Area – What's Next?
Timeframe: 4-Hour Chart
BTCUSD Currently trading around $102,600, Bitcoin is navigating crucial levels as sellers maintain firm control, pushing the price lower after a significant rejection.
Current Price Action & Trend Analysis:
Bitcoin recently failed to sustain its upward momentum, experiencing a decisive rejection from the 107K 'Upside 1st Target' zone around November 11th. This rejection marked a critical turning point, leading to a visible shift in the market structure. The price has since established a clear downtrend, characterized by a series of lower highs and lower lows.
A prominent red descending trendline now acts as dynamic resistance, effectively capping any bullish recovery attempts. Critically, BTC has broken down from the 103K to 105K 'Deciding Area', a zone that previously held importance as a potential pivot. Any attempts to reclaim this area have been met with strong selling pressure, confirming its flip from potential support to immediate resistance. The current price action sees BTC testing the lower bounds of this immediate range, struggling to find a foothold.
Key Resistance Levels:
103K to 105K Deciding Area: This is the most immediate and crucial resistance zone. A decisive reclaim and sustained hold above this level, ideally accompanied by increased buying volume, would be the first tangible sign of short-term bullish strength.
Descending Red Trendline: This dynamic resistance needs to be broken for any lasting upward momentum.
107K Upside 1st Target: Beyond the deciding area, the 107K level represents the last significant swing high before the current downtrend accelerated. A clear break above this would indicate a stronger recovery.
111K to 112K Key Resistance & 115K to 116K Major Resistance: These higher zones remain formidable barriers, but they are less relevant for the immediate short-term trend unless 107K is firmly broken.
Key Support Levels:
98K to 100K Downside 1st Target: Given the current bearish trajectory and the failure to hold above the 'Deciding Area', the immediate focus shifts to the downside. This 98K-100K range is identified as the 'Downside 1st Target' and represents a critical support zone. A breakdown here could lead to an accelerated selling pressure.
95K Next Support: Should the 98K-100K support fail to hold, the next significant level of support is identified at 95K. This level would be crucial in preventing a deeper decline and a potential cascade towards lower psychological figures.
Bullish Scenario:
For bulls to regain control, BTCUSD must first decisively reclaim and hold above the 103K to 105K 'Deciding Area', ideally breaking the descending red trendline. Following this, a strong push and sustained close above the 107K level would be necessary to signal a potential reversal and target higher resistance zones.
Bearish Scenario:
The current price action heavily favors the bearish scenario. Failure to reclaim the 103K to 105K 'Deciding Area', combined with continued rejection from the downtrend line, will likely lead to a test of the 98K to 100K 'Downside 1st Target'. A decisive breakdown below 98K would open the path towards the 95K 'Next Support' and potentially initiate a more significant correction.
Conclusion:
Bitcoin is at a pivotal point, with sellers currently dominating the short-term landscape. The immediate battle centers around the 103K-105K 'Deciding Area' acting as overhead resistance. Traders should closely monitor the 98K-100K support zone as the primary downside target. A clear break in either direction from these levels will likely dictate Bitcoin's trajectory in the coming days.
Disclaimer:
The information provided in this chart is for educational and informational purposes only and should not be considered as investment advice. Trading and investing involve substantial risk and are not suitable for every investor. You should carefully consider your financial situation and consult with a financial advisor before making any investment decisions. The creator of this chart does not guarantee any specific outcome or profit and is not responsible for any losses incurred as a result of using this information. Past performance is not indicative of future results. Use this information at your own risk. This chart has been created for my own improvement in Trading and Investment Analysis. Please do your own analysis before any investments.

Gold Hits 3-Week High on U.S. Debt Concerns & Fed Rate-Cut BetsGOLD | Overview
Gold Hits 3-Week High on U.S. Debt Concerns and Fed Rate-Cut Expectations
Gold extended gains to a three-week high as growing concerns over U.S. debt levels and renewed expectations for Federal Reserve rate cuts fueled demand for the safe-haven asset.
Volatility is likely to remain elevated as traders position ahead of key U.S. data and central bank commentary.
Technically:
Gold maintains a bullish bias, but a clear 1H candle close above 4238 is required to confirm the next bullish leg toward 4254, 4267, and 4300.
While trading below 4238, the price may stage a short-term correction toward 4222 and 4207 before resuming its upward move.
A 15-minute close below 4207 would invalidate the bullish setup temporarily and could extend losses toward 4186.
Pivot Line: 4238
Resistance: 4254 · 4267 · 4300
Support: 4222 · 4207 · 4186

USDCAD: Hold On Short Position, Target At 1.3901USDCAD is ascending on a momentum channel of support and resistance, the bigger time frame of the market shows uptrend, with the formation of higher highs and higher lows regions. contemporary the price is heading towards the next support, at 1.3901 as we spot in the structure.
Key points;
Hold on sell position until the price gets to our target.
For the meantime, you can place a quick sell, target 1.3901-1.3885.
Thanks for reading.

What will be the outlook for gold against the euro?My take on the path ahead for an ounce of gold against the euro is that we should follow the price growth to 3630 euros per ounce of gold.
Good luck
MJ.REZAEI

GOLD → Consolidation before the next rally?FX:XAUUSD is trying to consolidate above the psychological threshold of 4200-4225 amid uncertainty surrounding the publication of US data after the end of the shutdown. Despite the resumption of government work, key reports for October may be lost...
Key factors: The House of Representatives has approved funding, ending the shutdown. However, data for October (including NFP and CPI) may not be published. We need to wait for confirmation... However, the restoration of statistics (possibly next week) will clarify the Fed's trajectory.
Fed support: 80% of economists surveyed by Reuters expect a 25 bp rate cut in December.
Gold retains its growth potential. The $4200 level is a key barrier, with the price entering a new trading range of 4200-4400. A breakout of the local trigger is possible if data is weak or the Fed confirms a rate cut in December...
Support levels: 4200, 4161, 4148
Resistance levels: 4239, 4274, 4317
Focus on local consolidation and the 4239 trigger. A breakout and close above this level could trigger further growth. Otherwise, the market may test 4220-4200 before resuming its rally. Overall, the market structure and sentiment are bullish.
Best regards, R. Linda!

AUDUSD Breakout and Potential RetraceHey Traders, in today's trading session we are monitoring AUDUSD for a buying opportunity around 0.64800 zone, AUDUSD was trading in a downtrend and successfully managed to break it out. Currently is in a correction phase in which it is approaching the retrace area at 0.64800 support and resistance area.
Trade safe, Joe.

EURUSD Potential UpsidesHey Traders, in today's trading session we are monitoring EURUSD for a buying opportunity around 1.15600 zone, EURUSD is trading in an uptrend and currently is in a correction phase in which it is approaching the trend at 1.15600 support and resistance area.
Trade safe, Joe.

BITCOIN → Flagship within the trading range BINANCE:BTCUSDT.P is trading within a wide trading range of 99K - 105K, with the market attempting to form an intermediate bottom at 101K. However, the trend is downward...
Bitcoin, within the downward trend, is rebounding from support at 101K and, against the backdrop of locally positive news, is striving towards resistance at 105300. However, the downward trend and the opening of the session far from the key zone of interest are negative prerequisites for the current situation. Within the daily rally, the potential for continued growth may be exhausted. There is a hunt for liquidity within the trading range. A retest of resistance may end in a false breakout and a decline in the trend...
Resistance levels: 105300, 107300
Support levels: 103000, 101130, 98900
The price is within the trading range, and there are no clear prerequisites for the price to break out of the current flat. Accordingly, I expect trading within these limits to continue. A false breakout of resistance (lack of momentum and potential for continued growth) could trigger a reversal of the local movement and a decline in price.
Best regards, R. Linda!

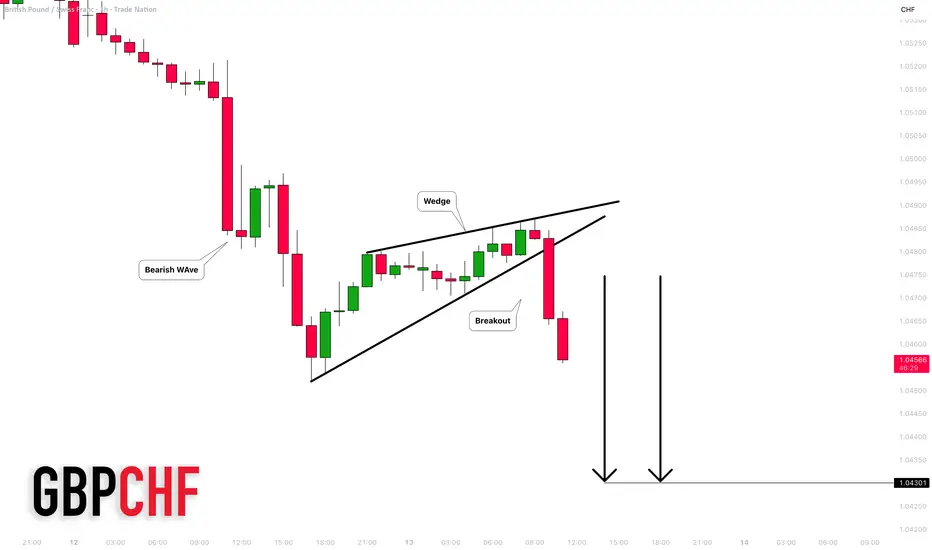
GBPCHF: Bearish Trend Continuation 🇬🇧🇨🇭
GBPCHF is trading in a strong downtrend.
A bearish breakout of a rising wedge pattern on an hourly time frame
indicates a highly probable trend continuation.
I expect a fall at least to 1.043 level.
❤️Please, support my work with like, thank you!❤️
I am part of Trade Nation's Influencer program and receive a monthly fee for using their TradingView charts in my analysis.
BITCOIN + BULLISH DIVBitcoin has weekly RSI bullish divergence which with passing 110.5k can push the price to new ATH

CDSL Weekly Chart – Symmetrical Triangle SetupPrice Action: CDSL is consolidating within a symmetrical triangle on the weekly timeframe. Lower highs and higher lows are converging toward an apex, suggesting a breakout or breakdown is near.
Key Levels (as of latest weekly data):
Breakout trigger: Above ₹1,565 (recent swing high)
Breakdown risk: Below ₹1,480 (recent swing low)
Triangle apex zone: Between ₹1,500–₹1,520 (compression zone nearing decision point)
RSI Insight: RSI is hovering near the 50 zone. Bearish divergence is visible—price made higher highs while RSI made lower highs. This suggests fading bullish momentum and calls for caution.
MACD Insight: MACD line is flat and close to the signal line. Histogram bars are alternating, showing indecisive momentum. No clear trend yet—market is waiting for a directional move.
Verdict: Neutral bias for now. Wait for a confirmed breakout with volume. Momentum indicators are not yet supportive of a strong move. A breakout above ₹1,565 could resume the uptrend; a breakdown below ₹1,480 may invite deeper correction.

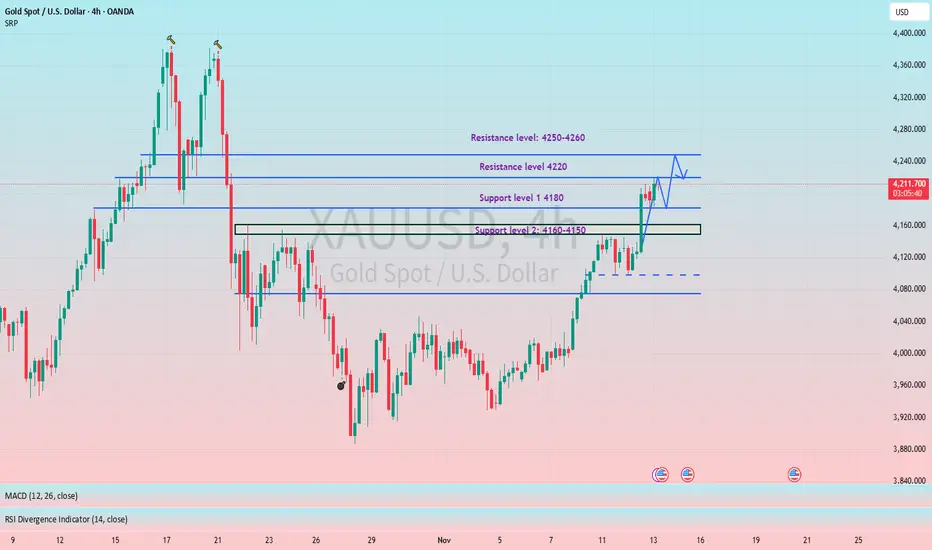
The bullish trend remains unchanged; we remain bullish on gold.#XAUUSD OANDA:XAUUSD TVC:GOLD
The daily chart is above the MA5 moving average, indicating that the bullish trend remains unchanged. However, we do not chase the price at high levels. Our core strategy is to wait for a pullback to support before going long. From the hourly chart, gold is fluctuating within the 4220-4180 range in the short term. If gold retraces to the short-term support of 4190-4180 during the European session, it is advisable to continue to go long on gold, with key support at 4160-4150. If the price rebounds to the previous high of 4250-4260, then yesterday's strategy remains valid.
Gold Hits 4150 Resistance: Healthy Correction or Reversal?1. What Happened in the Last 24 Hours
Gold delivered an impressive bullish surge of over 1000 pips, reaching the 4150 resistance zone — precisely the level mentioned in yesterday’s analysis. The move was nearly one-directional, with only a brief intraday retracement after crossing above 4100.
2. Market Context
Such a strong advance often leads to short-term exhaustion, and that’s exactly what we’re seeing now. After touching the 4150 resistance, the price has started to pull back, which appears to be a normal correction rather than a trend reversal.
3. Technical Outlook
The first key support for bulls lies near 4075, followed by the 4050 zone, which is now an important structural level. As long as these supports remain intact, the uptrend remains healthy and the probability of another bullish leg is high.
4. Trading Plan
I remain bullish on Gold and plan to buy dips toward 4075–4050 zones. A sustained hold above these levels could open the way for a retest of 4200 resistance in the next sessions.
If the price falls below 4050 with strong momentum, I’ll reassess the bias — but for now, the path of least resistance is still up.
5. Conclusion
Yesterday’s explosive rally confirmed the bullish structure, and today’s pullback looks like a healthy correction within an ongoing trend. As long as 4050–4075 holds, buying dips remains the smart play. 🚀

ESG Investing and Sustainable Finance1. Understanding ESG Investing
ESG stands for Environmental, Social, and Governance — the three key pillars used to evaluate the sustainability and ethical impact of an investment.
Environmental (E):
This pillar examines how a company manages its environmental responsibilities. Factors include carbon emissions, energy efficiency, waste management, pollution control, renewable energy use, and climate change mitigation strategies.
Example: Companies that reduce greenhouse gas emissions or invest in renewable energy are seen as environmentally responsible.
Importance: Investors assess environmental performance to gauge how well a company can manage climate-related risks and comply with emerging environmental regulations.
Social (S):
This component focuses on how a company interacts with people — employees, customers, suppliers, and communities. It includes labor practices, employee welfare, diversity and inclusion, human rights, product safety, and community engagement.
Example: Firms that promote gender equality, maintain fair wages, or engage in ethical supply chains demonstrate strong social values.
Importance: Socially responsible companies tend to attract loyal customers, maintain a motivated workforce, and avoid reputational risks.
Governance (G):
Governance deals with corporate leadership, internal controls, and shareholder rights. It assesses board diversity, executive pay, ethical business conduct, transparency, and anti-corruption policies.
Example: Companies with independent boards, fair executive compensation, and transparent reporting systems score high in governance.
Importance: Good governance reduces the likelihood of fraud, mismanagement, and unethical behavior — ensuring long-term stability.
In ESG investing, these three dimensions help investors identify organizations that are not only financially sound but also sustainable and ethical in their operations.
2. The Rise of ESG Investing
ESG investing has evolved from a niche concept to a global mainstream movement. Several factors have contributed to this shift:
Investor Awareness:
Modern investors, particularly millennials and Gen Z, are increasingly motivated by values. They prefer to invest in companies that align with their ethical and environmental beliefs.
Regulatory Push:
Governments and international bodies are promoting ESG standards. For example, the European Union introduced the Sustainable Finance Disclosure Regulation (SFDR), and India’s Business Responsibility and Sustainability Report (BRSR) mandates ESG disclosures for top-listed companies.
Corporate Accountability:
Global corporations are under growing pressure to adopt ESG frameworks, not only to attract investors but also to secure long-term sustainability and brand credibility.
Risk Management:
ESG factors are now recognized as essential to identifying long-term risks such as environmental disasters, regulatory changes, or social unrest that could affect business performance.
According to data from the Global Sustainable Investment Alliance (GSIA), ESG-related investments surpassed $35 trillion globally by 2023, representing about one-third of all professionally managed assets.
3. The Concept of Sustainable Finance
While ESG investing focuses on evaluating company performance using sustainability metrics, sustainable finance refers to the broader financial system that supports sustainable development.
Sustainable finance integrates environmental, social, and governance considerations into all aspects of financial decision-making — including banking, insurance, and capital markets. It aims to channel capital toward projects and companies that contribute positively to society and the planet.
Key components of sustainable finance include:
Green Finance:
This focuses on funding environmentally friendly projects — such as renewable energy, energy-efficient infrastructure, sustainable agriculture, or water conservation.
Example: Green bonds are debt instruments used to finance environmental projects.
Social Finance:
This supports initiatives that improve social well-being — such as affordable housing, education, healthcare, or employment generation.
Climate Finance:
A subcategory of sustainable finance, it targets investments that mitigate or adapt to climate change. This includes funding clean technologies and climate-resilient infrastructure.
Impact Investing:
This approach seeks measurable positive social and environmental outcomes alongside financial returns. Investors directly fund projects or enterprises that deliver tangible societal benefits.
4. Interconnection Between ESG Investing and Sustainable Finance
ESG investing is a subset of sustainable finance. While ESG focuses on assessing companies through sustainability metrics, sustainable finance provides the financial infrastructure — such as green bonds, sustainability-linked loans, and climate funds — to support those ESG-driven companies and initiatives.
In other words:
ESG provides the criteria for evaluation.
Sustainable finance provides the capital for transformation.
Together, they form a comprehensive ecosystem where financial decisions contribute to a greener, fairer, and more transparent global economy.
5. Benefits of ESG Investing and Sustainable Finance
Long-Term Value Creation:
ESG-aligned companies tend to perform better in the long run due to better risk management, innovation, and adaptability.
Lower Risk Exposure:
Firms adhering to ESG standards are less likely to face regulatory fines, lawsuits, or reputational damage.
Improved Access to Capital:
Sustainable companies attract more investors, as many institutional funds now mandate ESG compliance.
Enhanced Reputation and Brand Loyalty:
Consumers increasingly support ethical and eco-conscious brands, boosting market share.
Positive Societal Impact:
Capital is directed toward solving global issues like climate change, poverty, and inequality, leading to inclusive growth.
6. Challenges in ESG and Sustainable Finance
Despite its growth, ESG investing faces several obstacles:
Lack of Standardization:
Different rating agencies use varying ESG criteria, leading to inconsistent evaluations of the same company.
Greenwashing:
Some companies falsely claim to be sustainable to attract investors — a practice known as “greenwashing.”
Data Limitations:
Reliable and comparable ESG data is scarce, especially in emerging markets.
Short-Term Market Pressures:
Investors often prioritize quarterly profits over long-term sustainability goals.
High Implementation Costs:
Transitioning to sustainable practices can be expensive, particularly for small and medium enterprises (SMEs).
7. Global and Indian Perspective
Globally, regions like Europe and North America lead in ESG adoption, with institutional investors such as BlackRock and Vanguard emphasizing sustainability mandates. The United Nations Principles for Responsible Investment (UN PRI) and the Paris Agreement have further driven ESG integration into the financial system.
In India, ESG and sustainable finance are gaining momentum:
SEBI (Securities and Exchange Board of India) has made ESG reporting mandatory for the top 1,000 listed companies under the BRSR framework.
The Reserve Bank of India (RBI) has initiated policies supporting green and social financing.
Indian banks like SBI and HDFC are issuing green bonds to finance renewable energy and social projects.
This marks a clear shift in India’s investment culture — aligning financial growth with sustainability.
8. The Future of ESG and Sustainable Finance
The future of finance lies in sustainability-driven innovation. Artificial intelligence, big data, and blockchain are being used to enhance ESG data transparency and traceability. Governments are introducing carbon pricing, taxonomy regulations, and sustainability-linked incentives to encourage responsible investing.
As climate risks and social inequalities intensify, ESG and sustainable finance will continue to evolve — not as alternatives but as the new standard of global financial practice.
Conclusion
ESG investing and sustainable finance represent more than just financial trends — they are part of a paradigm shift in how societies view growth and prosperity. They align economic success with social well-being and environmental preservation. By integrating sustainability into financial systems, investors and institutions are not only securing returns but also shaping a resilient, equitable, and sustainable future for generations to come.
In essence, profit and purpose are no longer opposites — they are partners in the global mission toward sustainable development.

Jade Lizard expiring 11/28 (just prior to earnings on 12/2...)CALL CREDIT SPREAD, above price:
Buy $96 Call 11/28
Sell $95 Call 11/28
SHORT PUT, below price:
Sell $85 Put 11/28
Credit to open: $265
END RESULT SCENARIO #1: Share price between $85 and $95 @ expiration = $265 credit to open is max profit (best case scenario).
END RESULT SCENARIO #2: Share price above $96 @ expiration = Credit to open minus $100 (no risk to upside), ($165 profit), (In hindsight, I regret selling the call credit spread so far from the share price).
3) END RESULT SCENARIO #3: Share price at or below $85 on 11/28 = Assigned to purchase 100 shares. The result is now I own 100 shares at an avg cost of $82.35 per share.

OUTLOOK XAUUSD 1H Analysis (13th November 2025)This is not a financial advise, It's just a trading idea.
BUY/SELL SCENARIOS:
BUYS:
1) Body candle close above the 4211.72 level.
2) Retest the Previous Daily High at the 4211.72 level.
3) Create a 5/15m Bullish Engulfing Candle to capitalize on BUYS towards the 4272.50 level.
SELLS:
1) Sweep the Previous Daily High at the 4211.72 level.
2) Create a 5/15m Bearish CHOCH with a body candle close (with a FVG).
3) Retest the 5/15m Bearish CHOCH Level to capitalize on SELLS towards the 4149.00 level.
Trade smart, Trade according to your plan.

NAUKRI = PRICE ACTION ANALYSIS
PRICE ACTION ANALYSIS IN 1H TIME FRAME
KEY FACTORS TO REACH THE TARGET OF 1415/1420
=> Liquidity Sweep seen at support level
=> Perfect Trendline and Resistance Breakout
=> Before Breakout collected the pending orders @ FVG
=> Price crossed above 200EMA and bounced
So, we expect that it will be reached 1415/1420
Stop Loss is the recent swing low of 1325 on closing basis
== EDUCATIONAL PURPOSE ONLY ==

Opportunities are plentiful; what's lacking is patience.Gold Technical Analysis: On Wednesday, a large bullish candlestick broke through the 4150 resistance level during the US session, ending the recent sideways consolidation. The price reached a high of around 4210. As we repeatedly emphasized on Wednesday, after consolidation, further upward movement was expected, opening a new upward channel. The market has largely lived up to expectations. The key focus now is on the sustainability of this upward move. Structurally, with this strong rally, all timeframes are in a bullish alignment. The immediate resistance levels to watch are around the 4-hour upper Bollinger Band at 4215, and the 0.786 Fibonacci retracement level, around 4275. These two levels are expected to provide some temporary resistance for the bulls. As the price has risen, the support level has gradually moved higher. The primary support level to watch in the short term is 4150. This level is a previous resistance zone that has repeatedly faced downward pressure and is currently a top-to-bottom reversal point. As long as the gold price holds above this level, the bullish trend will continue. The important support level is around 4100. As long as the price stays above this level, the upward trend will not change. Therefore, for the end of the week, we will continue to be bullish with 4150 and 4100 as support levels.
Gold prices have broken through the previous resistance zone around 4150 on the 4-hour chart. Both bulls and bears have made substantial profits over the past few trading days. If the price can hold above 4150, it is highly likely to reach 4250-4270 tomorrow. At the end of the trading day, pay attention to whether there will be a pullback followed by a second upward move. Also, watch for support around 4160-4150 in the final minutes of the trading day. The upward momentum after the recent breakout should continue, although the deviation in the smaller timeframes is slightly large. We should watch for any short-term corrections. On the hourly chart, watch the low of 4097 from Tuesday's pullback. The US session saw a rapid rise above 4150, indicating a low probability of a significant drop; at most, it will only be a pullback. Short-term focus should be on buying on dips, using the 4150 level (a previous support/resistance level) as support, and also looking for opportunities to buy at the 0.5 Fibonacci retracement level. In summary, today's gold trading strategy should prioritize buying on dips, with selling on rallies as a secondary approach. Key resistance levels to watch are 4250-4275, and key support levels are 4150-4170. Please stay on track.

GOLD → Consolidation above 4100...FX:XAUUSD consolidates above $4,100 ahead of a key vote in the US House of Representatives on reopening the government. The rise is supported by weak employment data and expectations of Fed policy easing...
Key factors: Losses of more than 11,000 jobs per week until the end of October have heightened concerns about the labor market. The probability of a Fed rate cut in December has risen to 68%. Lower government bond yields and a weaker dollar have supported gold.
The resumption of data publication after the shutdown may change market sentiment (it is important to monitor actual data).
Gold retains its upside potential, but a short-term correction is possible. The outcome of the vote in Congress will determine the immediate dynamics.
Resistance levels: 4148, 4161
Support levels: 4097, 4075, 4046
If the bulls keep gold above 4100-4120, then in the short term, the market will be able to test resistance for a breakout. However, as a primary retest, I expect a rebound before the breakout and growth, provided that the fundamental background remains unchanged and continues to support the market...
Best regards, R. Linda!
