CHF/JPY: Important Breakout Confirmed📈CHFJPY has completed a correctional movement within a bullish flag pattern.
A confirmed violation of its resistance line, with a 4-hour candle closing above it, suggests a highly probable bullish continuation.
The next strong resistance is at 196.00.
This will be the next goal for buyers.
Trend Lines

GBPUSD is expected to fall below 1.300.On the daily chart, GBPUSD has been trending downwards after forming a double top pattern, with the bears in control. Currently, the price is trading below the downtrend line. Short-term support is around 1.300; a break below this level could lead to a move towards support around 1.270. Intraday, look for opportunities to short on rallies in the 1.309-1.313 range.

Forex Major Pairs Trading (EUR/USD, USD/JPY, GBP/USD)1. EUR/USD – The Euro vs. the US Dollar
The EUR/USD is the most traded currency pair globally, representing the economies of the Eurozone and the United States. Its daily trading volume is massive, providing excellent liquidity and tight spreads.
Key Characteristics
High liquidity and low transaction cost
Moderate volatility, making it suitable for beginners and professionals
Strongly influenced by monetary policy divergence between the European Central Bank (ECB) and the Federal Reserve (Fed)
Factors Influencing EUR/USD
Interest Rate Decisions
When the Federal Reserve increases interest rates, USD strengthens, causing EUR/USD to fall, and vice versa. The same logic applies to ECB policy moves.
Economic Data Releases
Important indicators include:
US Non-Farm Payrolls (NFP)
Eurozone CPI (Inflation)
US GDP, PMIs, and Retail Sales
These reports can cause sharp intraday movements.
Risk Sentiment
In risk-off scenarios (fear in markets), USD strengthens as a safe-haven asset.
In risk-on environments (market optimism), EUR may strengthen.
Geopolitical events
Political instability in Europe, US policy changes, or global crises can greatly influence the pair.
Trading Strategies for EUR/USD
Trend following using moving averages
Breakout trading during major economic announcements
Range trading during low-volatility sessions (especially Asian session)
EUR/USD typically reacts cleanly to technical levels due to its high liquidity.
2. USD/JPY – The US Dollar vs. the Japanese Yen
The USD/JPY pair is the second most traded major pair. It is known for its sensitivity to interest rates, risk sentiment, and carry trade strategies.
Key Characteristics
Yen is considered a safe-haven currency
USD/JPY reacts strongly to bond market movements, especially US Treasury yields
Volatile during risk events (war, market crash, recession fears)
Factors Influencing USD/JPY
US Treasury Yield Movements
The Japanese Yen is highly sensitive to bond yields.
Rising US yields → USD strengthens → USD/JPY rises
Falling yields → JPY strengthens → USD/JPY falls
Bank of Japan (BOJ) Policies
Historically, the BOJ has maintained ultra-loose monetary policy, causing long-term yen weakness. When BOJ hints at tightening, the pair may fall sharply.
Global Risk Sentiment
In risk-off situations, investors shift to JPY, leading to USD/JPY decline.
In risk-on environments, JPY weakens, and the pair rises.
Government Intervention
Japan sometimes intervenes directly in forex markets when the yen becomes extremely weak or volatile. Such interventions cause sudden, sharp movements.
Trading Strategies for USD/JPY
Yield-driven trading: following bond yield trends
Safe-haven trading: buying JPY during risk-off events
Breakout strategies during Tokyo and London overlap
Carry trade strategy (borrowing yen at low rates to invest in higher-yield currencies)
USD/JPY often moves in clear directional waves, making trend trading effective.
3. GBP/USD – The British Pound vs. the US Dollar (‘Cable’)
Known as Cable, the GBP/USD pair is one of the most volatile major pairs. It represents the economies of the United Kingdom and the United States.
Key Characteristics
Higher volatility compared to EUR/USD
Influenced heavily by UK political events, BOE policy, and economic data
Provides good opportunities for short-term traders due to fast movements
Factors Influencing GBP/USD
Bank of England (BOE) Monetary Policy
Changes in interest rates, forward guidance, and inflation control measures significantly affect GBP.
UK Economic Data
High-impact indicators include:
CPI inflation
Wage growth
GDP data
Manufacturing & Services PMIs
Political Events
GBP/USD is sensitive to political developments such as:
Brexit negotiations
UK general elections
Government budget announcements
Risk Sentiment and Global Flows
During global uncertainty, USD strengthens, causing GBP/USD to fall.
Trading Strategies for GBP/USD
Volatility-based strategies (like Bollinger Bands)
News trading, especially during UK economic releases
Breakout strategies due to frequent sharp movements
Swing trading because the pair forms strong medium-term trends
GBP/USD is ideal for traders who can handle higher volatility and sharp reversals.
General Tips for Trading Major Currency Pairs
Follow Central Banks Closely
Policies from Fed, ECB, BOE, and BOJ shape the market direction.
Use Proper Risk Management
Volatility varies by pair; set stop-loss levels accordingly.
Watch Global Risk Sentiment
Safe-haven currencies like JPY behave differently from risk-on currencies like GBP.
Monitor Economic Calendars
High-impact events such as NFP, CPI, interest rate decisions, and geopolitical news greatly influence major pairs.
Combine Technical and Fundamental Analysis
Major pairs respond strongly to both analysis methods.
Conclusion
Trading major currency pairs like EUR/USD, USD/JPY, and GBP/USD provides opportunities for traders of all levels due to their high liquidity, consistent volatility, and predictable responses to economic data and central bank policies. Each pair has unique characteristics: EUR/USD is stable and technically clean, USD/JPY reacts strongly to yields and risk sentiment, and GBP/USD offers high volatility with rich trading opportunities for experienced traders. Understanding the factors driving these pairs and applying disciplined risk management is essential for long-term success in the forex market.

Don't miss this excellent opportunity to buy gold at low prices.In the current gold market, the price action is becoming clearer, with key support and resistance levels emerging. The 4050-4030 support zone deserves particular attention, as it offers strong support. If the price retraces to this level and successfully stabilizes, it would be an excellent entry point for long positions, potentially allowing bulls to launch an upward attack. Resistance is seen around 4110-4120. When the price first touches this area, it may face pullback pressure due to technical factors. However, if the price can consolidate and effectively hold above 4120, the possibility of further upward movement towards the 4150 target this week will significantly increase. Based on the current overall performance of gold, the market can be considered to be trading within the 4030-4120 range. The trading strategy should focus on buying on dips, taking advantage of rebounds from support levels to generate profits. At the same time, strict position control is crucial, as market conditions are constantly changing. Furthermore, it is essential to closely monitor real-time data and market dynamics to flexibly adjust trading strategies.
Gold trading recommendation: Buy gold in batches around the 4050-4030 range, with a target of 4080-4100.

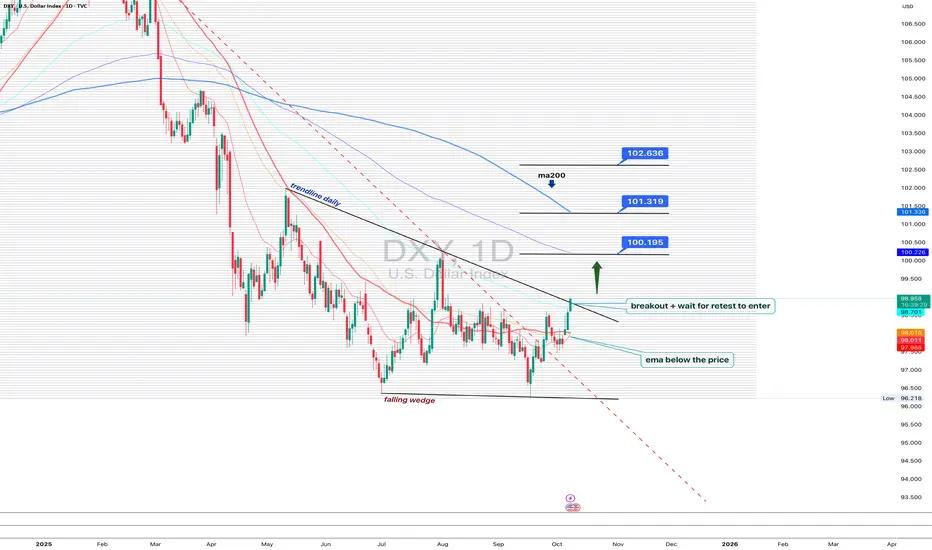
DXY 1D - dollar waking up, but patience is keyOn the daily chart, the US Dollar Index is showing the first signs of recovery: a falling wedge breakout and trendline breach hint that bulls are slowly reclaiming control. Price has moved above the EMA, a short-term bullish signal.
Still, MA200 remains above, reminding us that the broader trend is not yet flipped. The ideal play here - wait for a retest of the breakout trendline to confirm buyers’ strength before jumping in.
If price holds above 99.70, the next upside targets sit around 100.19, 101.31, and 102.63.
But keep in mind - DXY loves to test patience. False breakouts are its favorite sport.
Right now, the dollar looks ready to wake up, but maybe hit the snooze button one last time before the real move begins.
BHEL possible 17 years breakout candidateBharat Heavy Electricals Ltd. (BHEL) (currently trading near ₹260.40) – Overview BHEL, headquartered in New Delhi, is India’s largest engineering and manufacturing enterprise in the energy and infrastructure sector. Established in 1964, it designs, manufactures, and services a wide range of products including power generation equipment, transmission systems, renewable energy solutions, defense equipment, and industrial systems. BHEL operates across India with 16 manufacturing units, 2 repair units, and 4 regional offices, serving both domestic and international markets.
FY22–FY25 Snapshot • Sales – ₹21,210 Cr → ₹23,450 Cr → ₹25,800 Cr → ₹28,200 Cr Growth driven by power sector revival, renewable energy projects, and defense contracts
• Net Profit – ₹410 Cr → ₹520 Cr → ₹640 Cr → ₹780 Cr Earnings supported by cost optimization, higher execution, and diversification into defense and renewables
• Operating Performance – Moderate → Strong → Strong → Very Strong EBITDA margins improving with better order execution and higher share of non-power business
• Dividend Yield (%) – 1.20% → 1.30% → 1.40% → 1.50% Consistent payouts alongside reinvestment into modernization and R&D
• Equity Capital – ₹348 Cr (constant) Government of India remains the majority shareholder
• Total Debt – ₹1,200 Cr → ₹1,100 Cr → ₹1,000 Cr → ₹950 Cr Gradual deleveraging supported by strong operating cash flows
• Fixed Assets – ₹12,500 Cr → ₹12,700 Cr → ₹12,900 Cr → ₹13,100 Cr Capex focused on renewable energy, defense manufacturing, and modernization of plants

GBPUSD Fractals ( Cable )Great Britain Pound Major Movments
inside And Small Fractals
For Fractal Academy
By Sina Sadeghi

Gold bulls launch a strong counterattack!After a prolonged period of narrow-range fluctuations, gold reached a high of around 4120 before pulling back. Currently, the overall structure remains bullish. Market conditions are constantly changing, and stubbornness is the worst thing in trading. Neither die-hard bulls nor die-hard bears can last in the face of the market. We should follow the trend; this is the fundamental logic of professional trading. Don't fight the market; just follow the trend. Currently, the bulls still hold the initiative in gold. Short-term pullbacks are more about consolidation than a trend reversal. As long as the upward momentum continues, pullbacks are opportunities, not risks. The key focus going forward is the pullback performance in the 4090-4070 area. As long as it holds, this area remains a good place to buy on dips. The market always punishes those who defy it. Hitting a wall is a lesson; understanding the direction is growth. Following the trend is the easiest and most stable way to trade. Continue to follow the rhythm; opportunities are for those who choose the right direction.

OUTLOOK XAUUSD 1H Analysis (20th November 2025)Hey Guys, This is just a trade idea, not a financial advise
BUY/SELL SCENARIOS:
BUYS:
1) Retest the 1h Bullish FVG at the 4100.52 level.
2) Create a 3/5m Bullish CHOCh with a body candle close (with a FVG).
3) Retest the 3/5m Bullish CHOCH level to capitalise on BUYS towards the 4133.00 level.
SELLS:
1) Body candle close below the 4084.81 level.
2) Retest the failed 1h Bullish FVG at the 4084.81 level.
3) Create a 3/5m Bearish Engulfing Candle to capitalize on SELLS towards the 4040.50 level.
Trade smart, Trade according to the trading plan. Cheers

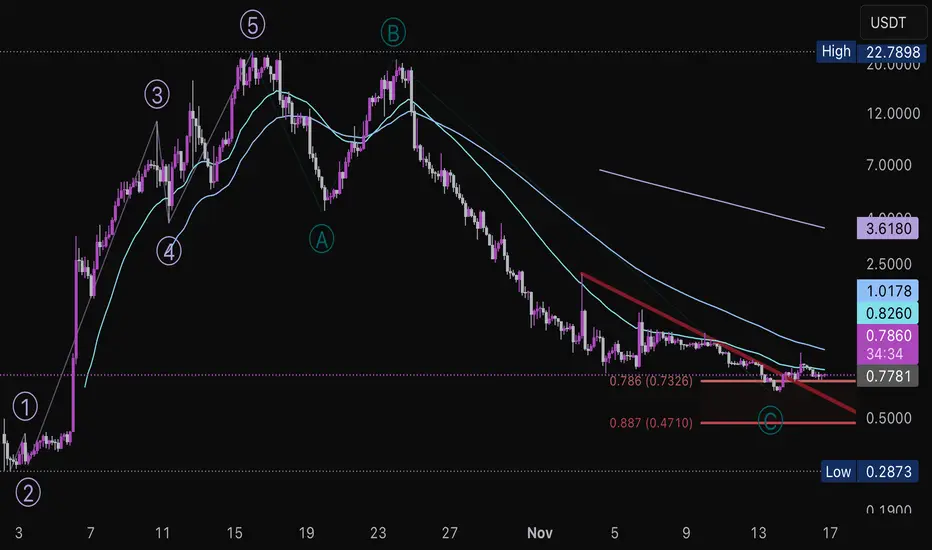
COAI Possible Elliot Wave CountCOAI recently broke above the descending trend line after hitting the 78.6 fibonacci retracement of the sharp move up in early October. The chart can be interpreted as 5 waves up and 3 down, potentially creating a long opportunity up to recent high and perhaps even larger if this is the start of a larger cycle.
Alternatively, this retracement could also be a B wave, in which case a rally is still expected.
A sustained break above $0.99 will be needed as a first signal of trend reversal.
ZCash – Breakout Setup📊 CRYPTO:ZECUSD continues to build momentum, with upside potential toward the $861–$936 target area as long as short‑term pullbacks hold above $550.
The key hurdle remains the $720 resistance zone, once cleared, it opens the door for a stronger extension higher.

SMCI - Caution! My target entry might surprise you!Most of retail is long (and bullish) on SMCI, seeing it as an "undervalued" golden ticket to NVDA-like riches.
I, however, am skeptical. Intentional liquidity does not lie - nor does supply and demand. So I'm not saying SMCI is doomed - rather, in order to continue a substantial and sustainable reversal, there are some attractive buyers in the $25-$27 range that could help create a much needed support base for SMCI going forward.
Targeting $25 in the near term with an entry on a clear red or purple rejection and LTF bearish liquidity building.
Please do your own research as any news can completely blow this thing up at any moment. I am approaching this potential trade with very limited risk and minimal time frame if it presents itself properly.
Happy Trading :)

You can't ignore a double top, a double bottom and falling wedgeThose are the three important things you just can not ignore!
People start going long from the last bottom hit (see lower chart) - I think they know what's coming for us. 130$ shows strength!

$META: at the 100 WMANASDAQ:META : I believe April 2025 low started a new 5-wave sequence for $META. Wave 1-2 completed. Wave 1 of 3 completed and it's in Wave 2 of 3 correction.
Wave 2 can retrace very deep. It has already retraced 61.8% of Wave 1. There is also a trendline support formed by connecting 2022 low with April 2025 low.
It's also right at the 100 Week MA.
My count is invalidated if NASDAQ:META drops below the beginning of Wave 1 at $480.
My position
I'm a long term investor of $META. I'm holding my shares. It's already a large position so I do not plan to add. I'm comfortable with just holding my position long term.

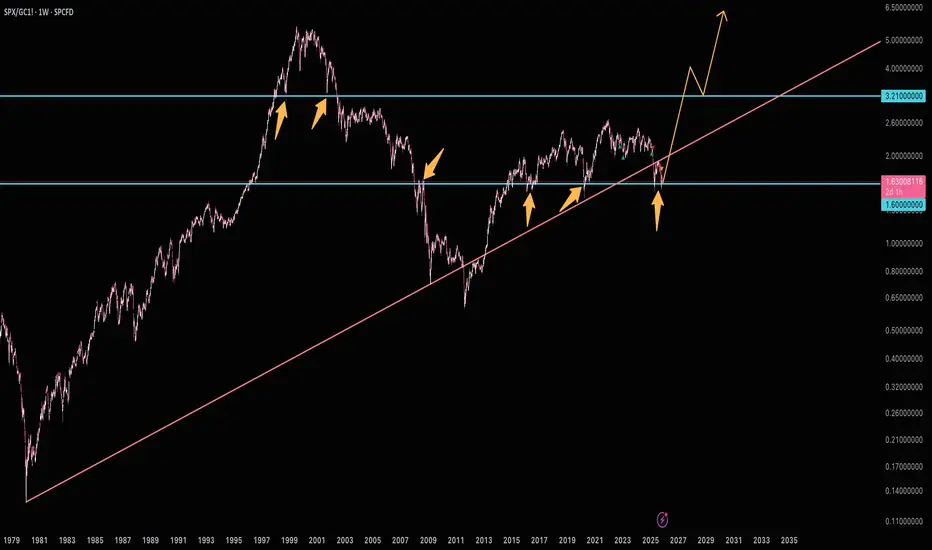
Stocks set to significantly outperformStocks are back on major support and are set to significantly outperform. It's a good idea to be out of gold or USD and pile into stocks for a real increase in value. Shorting gold isn't a bad idea either.
Ignore the bubble talk. When there's a real bubble you'll go out to eat and hear the table next to you talking about stocks.
Once again, perfectly capturing gold trading opportunitiesIn yesterday's gold strategy, we emphasized the rebound correction at the 4000 level and the short position at 4080, and the market action has fully materialized! Congratulations to those who followed our advice.Gold is currently dominated by bears, and the overall structure remains weak. Short-term support levels to watch are the 4040-4030 area and strong support around 4000. Resistance remains concentrated in the 4080-4100 area. If the price rebounds to this area and fails to break through, short positions can still be considered. In short, the core logic for today remains unchanged: a weak, downward-trending market. Trading should focus on the aforementioned support and resistance levels, patiently waiting and positioning. The slower pace of the market movement means a longer trading cycle, thus requiring more patience in executing each trade. Until the trend changes, our overall strategy remains to primarily short at higher levels during rebounds, supplemented by buying on dips, proceeding steadily and following the trend.

AUD/USD Threatens Breakout as Bears Test Support Ahead of NFPThe Australian Dollar is testing confluent support today at the lower bounds of a four-month consolidation pattern, with AUD/USD threatening a breakout as traders brace for the highly-anticipated Non-Farm Payroll report. While the near-term risk remains tilted to the downside, the immediate focus is on a reaction off this zone this week, and the employment data tomorrow could prove pivotal for both the Dollar and broader risk sentiment.
The recent decline has erased the entire monthly rally with Aussie now testing confluent support at the monthly low. We are looking for possible inflection off this zone as AUD/USD tests the lower bounds of a multi-month consolidation structure. Support rests at 6459- a region defined by the November opening-range low, the 200-day moving average and the August trendline. Losses below this threshold would constitute a break of the objective monthly range with a close below the October low at 6440 needed to validate a breakout of a four-month consolidation pattern. Subsequent support objectives are eyed at the 38.2% retracement of the yearly range and the August low at 6404/15, and the June low at 6373. The next major technical consideration rests with the 2024 August low and the 100% extension of the September decline at 6348/51.
Initial resistance is now eyed at the September low-day close at 6520 and is backed by weekly / monthly open at 6535/46. Ultimately, a breach / close above the Fed-day reversal close at 6575 would be needed to validate a breakout of this consolidation and would suggest a more significant low is in place / a larger trend reversal is underway.
Bottom line: AUD/USD is testing confluent support here with major event risk on tap tomorrow. A good zone to reduce portions of short-exposure / lower protective stops- rallies should be limited to 6520 IF price is heading for a break lower on this stretch with a close below 6440 ultimately needed to fuel the next major leg of this decline.
-MB

Gold bulls rallied to reverse the trend; what's next?We perfectly timed both our long and short positions in gold, exiting all positions with profits. Now that gold is rebounding again, we should avoid shorting again and patiently observe the resistance levels above, especially the 4100-4110 area. Whether gold can break through this resistance remains to be seen. If your current trading is not going well, and we hope to help you avoid common pitfalls, feel free to contact us for discussion!
Based on the current gold price trend, we should first focus on the short-term support area around 4050-4030, and the resistance area around 4100-4110. The overall strategy should be to sell on rallies within this range. In the middle range, it's best to observe more and trade less, avoiding chasing the market. Wait patiently for key entry points. Specific trading strategies will be provided at the bottom; please pay close attention.

EUR/USD: Bearish Drop to 1.1483?As the previous analysis worked exactly as predicted, FX:EURUSD is flashing bearish signals on the 4-hour chart , with price forming successive lower highs under a downward trendline, indicating sustained selling pressure and potential for a downside continuation if resistance holds firm. The setup aligns near the resistance zone for a high-probability short, especially as the pair tests key levels amid recent volatility.
Entry zone between 1.1638-1.1656 for a short position. Target at 1.1483 near the support zone, delivering a risk-reward ratio close to 1:4 . Set a stop loss on a close above 1.16775 to protect against upside breaks. 🌟 Look for confirmation on a break below the entry with increasing volume, amid ongoing USD strength versus the EUR.
Fundamentally , the pair has fallen to around 1.1594 as markets await key US data today, including manufacturing and construction releases, which could reinforce USD if positive—potentially pressuring EUR further amid low volatility and a lingering upward bias from last week's channel breakout. 💡
📝 Trade Setup
🎯 Entry Zone: 1.1638 – 1.1656 (short position)
🎯 Target:
1.1483 (major support zone)
❌ Stop Loss: Close above 1.16775
⚖️ Risk-to-Reward: Approximately 1:4
What's your outlook on this setup? Drop your thoughts below! 👇

End of crypto cycle or healthy correction?Has the crypto cycle ended? If so that means no alt-season for sure.
Consider:
Bitcoin's 4 year cycle
The 4 year CRYPTOCAP:BTC cycle is well documented by now, and something X pundits are hanging their hats on, claiming the top is in.
Institutions are investing
The likes of Harvard, with an endowment now boasts Bitcoin as its largest holding (at $116k/coin no less).
The Fed is cutting rates and pausing QT
It might be a slow easing cycle due to entrenched inflation, but easing is better than tightening for risk assets.
Is it possible we've topped for this cycle and prices are heading much lower from here? Absolutely. However I think it's a good place to hedge on there still being upside left. Nibble at ostensible value with cautious optimism.

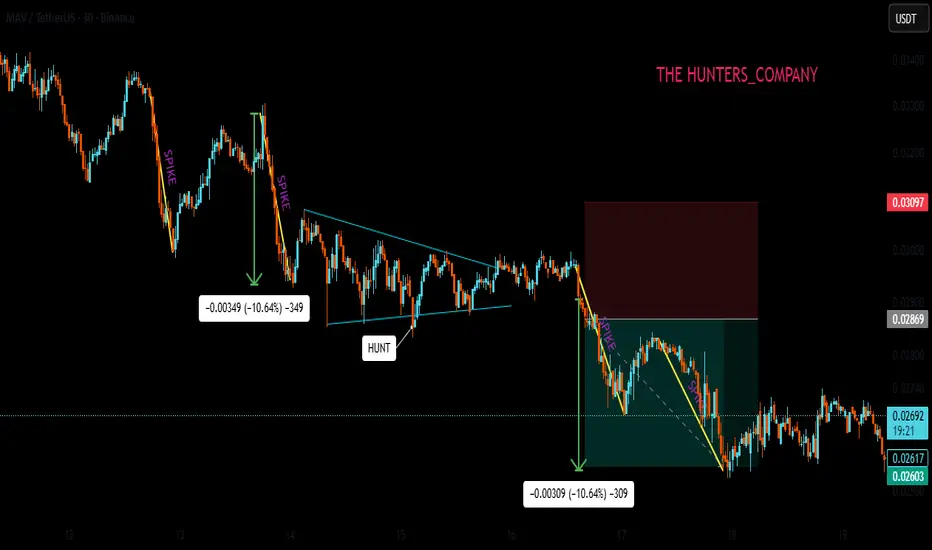
Continuing Triangle PatternHello friends
we are here with a simple strategy tutorial that is a model, but it also requires practice.
Well, whenever we have a structure, whether it is bullish or bearish, it doesn't matter. Now in this example, our structure is bearish and you can see how sharp the spikes that the sellers make are and at one point the price compresses and forms a triangle. Here, considering the bearish structure we have and the strength of the sellers that you see, we expect a decline if the triangle breaks.
Which is the continuation of our downward trend or structure, which we call a continuation triangle, meaning the price continues its previous structure.
The way to trade it is also simple. Just wait for a strong break of the triangle, and when the break is valid and the bottom of the triangle closes, we can enter with a stop loss above the ceiling and a target equal to the previous drop of the triangle, which is the trend move.
Be sure to follow risk and capital management.
*Trade safely with us*
What are these "algorithms" I'm always talking about?I talk a lot about “ algorithms ” - but for newer followers, it can feel abstract or confusing.
This video breaks down the core logic behind how I analyze any chart and tell a story to set up for the best possible trade.
Here I discuss:
- What is liquidity
- How the market builds liquidity
- Why certain movements/patterns repeat with accuracy
- How tapering, liquidity, and the basics of supply and demand form algorithmic behavior
If you want to understand the power behind the charts I show every day, this is for you.
(It's difficult to do this in a 10 minute video - which is why I have students who I work with one-on-one to dive deeper into learning this process. I don't sell myself or a course - I simply want you all to learn something that is truly helpful and beautiful. I post everything I know on here as often as I can!)
Happy Trading :)

Bitcoin last chance before the market bull season endThe market is at a critical technical juncture. A decisive breakdown and sustained close below the $90,000 support zone would signal a confirmed shift into a sustained bearish cycle. In such a scenario, the next significant structural support is projected near the $60,000 level, representing a potential depreciation of over 30% from current levels.
Conversely, this level also presents a pivotal opportunity for the bulls to defend the market structure. A strong rejection and consolidation above $90,000, forming a robust base, would be the first step towards stabilization. Following this, a recovery and sustained break above $110,000 would be required to invalidate the bearish outlook and signal the probable start of a new bull phase.
DISCLAIMER: ((trade based on your own decision))
<<press like👍 if you enjoy💚
