EURCAD Wave Analysis – 5 November 2025
- EURCAD reversed from support area
- Likely to rise to resistance level 1.6385
EURCAD currency pair recently reversed from the support area between the key support level 1.6160 ( which has been reversing the price from the middle of September), lower daily Bollinger Band and the support trendline of the daily up channel from May.
The upward reversal from the support area stopped the impulse c-wave of the earlier ABC correction (ii) from the middle of October.
Given the clear daily uptrend the oversold daily Stochastic indicator, EURCAD cryptocurrency can be expected to rise to the next resistance level 1.6385 (which stopped earlier waves iii and v).
Trend Lines

EUR/USD Snaps 1.15- Recovery Risk RisesEuro is attempting to recover after a brief break below the 1.15 handle, with EUR/USD carving the weekly opening range just below the November open. The move highlights potential downside exhaustion within the broader downtrend, with the focus now on whether a near-term recovery can develop from this zone. A breakout of the weekly opening range may offer clarity on direction in the days ahead.
EUR/USD continues to trade within the confines of the descending pitchfork extending off the yearly high. A two-day rally is now testing confluent resistance near the 75% parallel at 1.1537/42- a region defined by the objective monthly / weekly open and the mid-October swing lows. A rally surpassing this pivot zone would expose a stretch towards the Fed reversal close at 1.1601. Note that this level converges on the upper parallel tomorrow (near-term bearish invalidation). Ultimately, a breach / close above the 38.2% retracement of the September decline and the September 25 swing low at 1.1641/46 would be needed to suggest a more significant low is in place / a larger reversal is underway. Subsequent resistance eyed at the October high-day close (HDC) / 61.8% retracement at 1.1731/47.
Initial support rests at the 1.15-handle and is backed closely by the weekly range low at 1.1469. A break / close below the median-line is needed to mark resumption of the September downtrend with subsequent support objectives seen at the May HDC / August low at 1.1387/92 and 200-day moving average / 100% extension of the September decline at 1.1340/52. Both regions represent areas of interest for possible downside exhaustion / price exhaustion IF reached.
Bottom line : EUR/USD is threatening downside exhaustion here and the risk remains for a larger recovery within the multi-month downtrend. From a trading standpoint, the immediate focus is on a breakout of the weekly opening-range for guidance. Rallies should be limited to 1.16 IF price is heading lower on this stretch with a close below the weekly low needed to fuel the next leg of this decline.
-MB

USD/JPY Coils as Breakout Setup BuildsThe Japanese Yen is getting a brief reprieve from recent selling pressure, with USD/JPY consolidating near the upper bounds of a multi-month uptrend. The immediate focus is on a breakout of this range at nine-month highs for guidance into November trade. A topside breach would mark resumption of the broader advance, while a break below the October slope could trigger a deeper correction in the days ahead.
USD/JPY continues to trade within the confines of an ascending pitchfork extending off the October lows. The lower parallel now converges on support at the October high-close / swing high at 153.08/27. A break / close below this threshold would threaten a larger correction towards key support (bullish invalidation) at 151.63/95- a region defined by the 61.8% retracement of the yearly range and the 2022 / 2023 swing highs. Look for a larger reaction there IF reached. Subsequent support seen at the July high-close at 150.74 and the September high-close at 149.81.
Initial resistance is eyed at the 78.6% retracement of at 154.82- note that the 75% parallel converges on this threshold next week and a breach / daily close above would be needed to mark resumption of the broader uptrend. Subsequent resistance objectives are eyed at the November high-close and the 100% extension of the April advance at 153.27/44 and the 2025 yearly open at 157.19.
Bottom line: USD/JPY is trading just below confluent resistance with the weekly and monthly opening-ranges now taking shape- look for the breakout in the days ahead. From a trading standpoint, losses should be limited to 151.63 IF price is heading higher on this stretch with a close above 154.82 needed to fuel the next major leg of the advance.
-MB

The bears' rhythm is clear, and their direction remains firm!Gold's early morning dip yesterday did not continue, and it even broke through the important resistance level of 3990 during the European session. Today, it broke through the 4000 mark, reaching a high of around 4020, which is the resistance level we predicted earlier. The price has accurately reached the 4020-4030 rebound range, and then quickly fell back to around 3978 and fluctuated. I believe that those who followed the plan have made a steady profit. Judging from the current trend structure, gold is likely to continue its oscillating rebound, but the short-term rebound space is limited. The key resistance area to watch is still 4020-4030. If the rebound fails to break through the resistance, it will still be a good opportunity for short sellers to position themselves. In terms of strategy, we will continue to focus on shorting on rallies, entering positions in batches with small positions, controlling risks, and moving forward steadily. If you've been struggling with your recent trading and want to avoid pitfalls in complex market conditions, feel free to contact me. I'll do my best to help you clarify your thinking and master your own trading rhythm.

XAU/USD:Capped Below 4,100 as Sellers Eye Breakdown Toward 3,900XAU/USD rebounded from the channel base but remains below the downward trendline and the 4,080–4,100 supply zone. Price is forming lower highs inside a falling channel, with choppy consolidation mid-range.
A sustained move below 4,080 could trigger downside toward 3,900, with 3,827 as an extended target if momentum accelerates. To shift bias, bulls must reclaim and hold 4,100–4,135, which would reopen upside toward 4,200+.
❗️ Risks:
– Break above 4,100–4,135 could squeeze shorts and flip bias bullish.
– Soft U.S. data or risk-off flows may trigger gold strength.
– Event-driven volatility could disrupt intraday structure and positioning.

Bitcoin Bleeding: Major Supports Shattered, 100K in Sight!
🚨 Bitcoin Bleeding: Major Supports Shattered, 100K in Sight! 📉
BTC/USD (4H Timeframe) Analysis
Bitcoin is currently under heavy selling pressure, having broken through several key support levels following a significant rejection from overhead resistance. The price action suggests a continuation of the downtrend, with bulls struggling to establish a base.
1. The Bearish Structure and Key Resistances
The chart clearly shows that the bears are in control after a failure to sustain a rally and a confirmed reversal pattern.
🛑 115K to 116K Major Resistance: This area proved to be the major turning point. The price formed a classic Double Top (or a variation of it) at this zone (circled), confirming strong supply and initiating the sharp sell-off.
🔴 111K to 112K Key Resistance: This green-turned-red zone was the last significant high the market made before breaking down. It now represents a critical hurdle. Any bounce is likely to meet heavy selling here.
⚠️ 119.5K to 121K Breakdown Area: This upper red zone shows the initial area where the massive drop originated. It would take an exceptional rally to reach and reclaim this level.
2. The Current Breakdown and Support Levels
The most notable recent activity is the decisive break of previous consolidation levels, indicating strong bearish momentum.
💥 107K Support Broken: This was a significant intermediate support that has now been lost, contributing to the downward slide.
💥 103K to 105K Support Broken: The failure to hold this crucial demand zone confirms the strength of the current downtrend. This area will now likely act as immediate resistance on any bounce.
🛡️ 98K to 100K Next Support: The market is now rapidly approaching the major psychological and technical
zone of 100,000. The green box highlights the next significant demand area from 98K to 100K.
3. Trade Plan Scenarios
Bears (Short):
Entry Trigger: A rejection and confirmation of resistance at the recently broken 103K to 105K zone.
Target: A test of the 98K to 100K Next Support level.
Bulls (Long):
Entry Trigger: A confirmed reversal pattern (like a double bottom or strong engulfing candle) within the 98K to 100K support zone.
Target: A retest of the 103K to 105K broken support, which is now expected to act as resistance.
In summary, Bitcoin is in a decisive downtrend, targeting the psychologically important 100K level. Bears are clearly in control until a major support level provides a strong, convincing bounce.
Disclaimer:
The information provided in this chart is for educational and informational purposes only and should not be considered as investment advice. Trading and investing involve substantial risk and are not suitable for every investor. You should carefully consider your financial situation and consult with a financial advisor before making any investment decisions. The creator of this chart does not guarantee any specific outcome or profit and is not responsible for any losses incurred as a result of using this information. Past performance is not indicative of future results. Use this information at your own risk. This chart has been created for my own improvement in Trading and Investment Analysis. Please do your own analysis before any investments.

Gold's Critical Crossroads: Double Top Threatens Reversal!👑 Gold's Critical Crossroads: Double Top Threatens Reversal! 📉
XAU/USD (4H Timeframe) Analysis
Gold has experienced a significant uptrend followed by a sharp reversal pattern, leaving traders to navigate a crucial period of consolidation and retesting. The chart highlights key supply and demand zones that will dictate the metal's next major move.
1. The Bearish Setup: Double Top and Key Zone Loss
The chart clearly shows that the bullish momentum stalled after hitting a high around 4400.
⚠️ The Double Top at 4400: This major bearish reversal pattern formed, indicating strong selling pressure at the top. The price couldn't sustain the breakout, leading to a swift decline.
📉 Breakdown of the 4000 Key Zone: After the double top, Gold lost the critical 4000 Key Zone, which previously acted as strong support (teal box). The price is now retesting this zone from below, confirming its transition into a resistance area.
🛑 4150 to 4250 (1st Resistance): This large red zone represents the first major overhead supply area. For bulls to regain confidence, they would need to conquer this zone, but it looks heavily defended for now.
2. Current Price Action and Support Levels
The price is currently consolidating below the 4000 resistance, forming a classic "descending triangle" or consolidation pattern.
🛡️ 3900 Immediate Support: The price is being held up by the 3900 immediate support level (green box). Holding this level is essential to prevent a further slide. A break below 3900 would likely signal more downside.
🎯 3800 to 3850 Next Support: This deeper green zone is the last line of defense for the current structure. This area aligns with the base of the previous major rally, making it a critical demand zone.
3. Trade Plan Scenarios
Bulls (Long):
Entry Trigger: A sustained breakout and candle close above the 4000 Key Zone.
Target: A retest of the 4150 to 4250 resistance area.
Bears (Short):
Entry Trigger: A confirmed breakdown and candle close below the 3900 Immediate Support.
Target: The next major demand zone at 3800 to 3850.
In summary, Gold is at a pivotal point. Traders should monitor the battle at the 3900 support and 4000 resistance for the next directional cue!
What do you think will happen next: will Gold hold 3900 or finally break above 4000?
Disclaimer:
The information provided in this chart is for educational and informational purposes only and should not be considered as investment advice. Trading and investing involve substantial risk and are not suitable for every investor. You should carefully consider your financial situation and consult with a financial advisor before making any investment decisions. The creator of this chart does not guarantee any specific outcome or profit and is not responsible for any losses incurred as a result of using this information. Past performance is not indicative of future results. Use this information at your own risk. This chart has been created for my own improvement in Trading and Investment Analysis. Please do your own analysis before any investments.

EURAUD SHORT TERM MOVE If you're trading EURAUD going long is risky, price contacted DAILY SUPPLY ZONE🟤. THIS is the zone that is created by institutions not retail Traders

SMCI is crawling toward its 39-41$ supportstrong support around 39-41 usd. this is the range to place buy orders

Gold short term rallyGold is responding from institutional demand zone 🔴 but this move is for short term

POTENIAL SELL ON AUDNZD INTO A BUY ZONENow it is time to react to a short term sell off on AUDnzd. Maybe, we can sell lower prices and them come into more buys in coming week. Nevertheless, react to market than being a predictor. Cheers

BTC Monthly: Awaiting Bullish Confirmation from Golden Zone
BTC Monthly: Awaiting Bullish Confirmation from Fibonacci Golden Zone
Hello, traders. This is a high-level, monthly-timeframe analysis of Bitcoin's macro trend.
This idea is based on a clear, repeating pattern that has defined the bull market since September 2023. By understanding this larger structure, we can better frame the current volatility and identify what to look for as confirmation of the next major leg up.
🔍 The Core Analysis
On the monthly chart, BTC's bullish trend has followed a consistent blueprint:
A strong impulse move up.
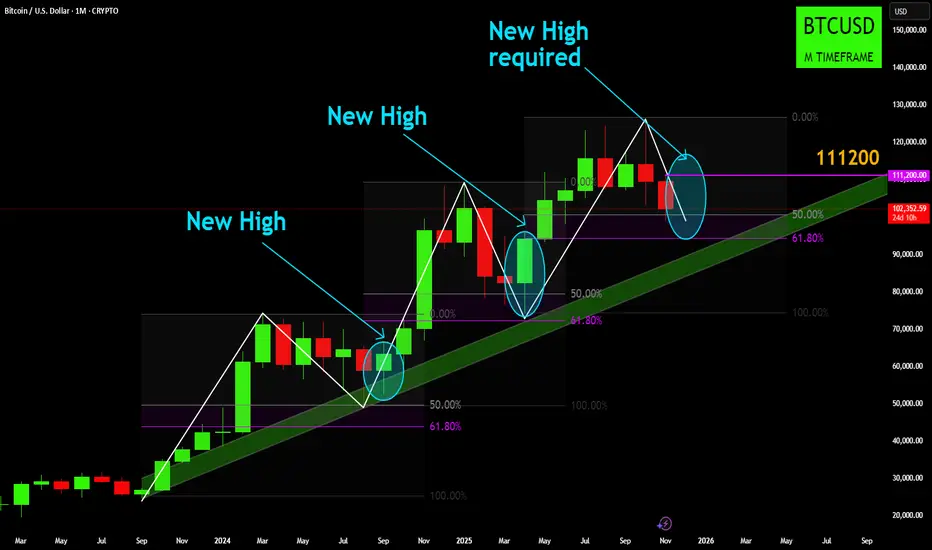
A corrective pullback into the Fibonacci "Golden Zone" (the area between the 50% and 61.8% retracement levels).
A period of consolidation in this zone, where support is found.
A breakout from this zone, leading to a New High and continuation of the trend.
As you can see from the chart, this "pullback-and-breakout" pattern has happened twice already during this uptrend.
📍 Where We Are Now
Currently, we are at a critical juncture. After posting a significant new high (around $128,000), the price has once again entered a corrective phase.
Price is currently testing the 50% Fibonacci level at approximately $102,404.
This places us squarely back inside the "Golden Zone," the same area that has acted as a support and springboard for price in the past.
🐂 The Bullish Thesis (Confirmation)
For the long-term bullish trend to be confirmed, the pattern must repeat:
Support must hold within this 50% - 61.8% Fib zone.
The price must eventually break out of this corrective structure and create a New High above the previous peak.
This new high is the required confirmation that the pullback is complete and the macro uptrend is continuing.
🐻 The Corrective/Volatile Phase (The "Wait")
Until that new high is formed, we must respect the current market phase.
Price is technically in a "pullback mode."
This means we should expect continued volatility. Price can easily fluctuate for weeks, or even months, within this corrective zone before a clear direction is established.
A break below the 61.8% Fib level on a monthly closing basis would be a significant warning sign and would challenge the validity of this entire bullish structure.
⚠️ Important: A Macro View
This is a Monthly Chart. Each candle represents 30 days of price action.
This analysis is ideal for a long-term perspective (investors, position traders) to understand the bigger picture.
It is NOT suitable for short-term trading. The moves within this "golden zone" can still be tens of thousands of dollars.
This same concept (impulse, Fib pullback, new high) can be applied to shorter time frames (like the Daily or 4-Hour) to find short-term trade setups, but this specific chart is strictly a macro view.
Disclaimer:
The information provided in this chart is for educational and informational purposes only and should not be considered as investment advice. Trading and investing involve substantial risk and are not suitable for every investor. You should carefully consider your financial situation and consult with a financial advisor before making any investment decisions. The creator of this chart does not guarantee any specific outcome or profit and is not responsible for any losses incurred as a result of using this information. Past performance is not indicative of future results. Use this information at your own risk. This chart has been created for my own improvement in Trading and Investment Analysis. Please do your own analysis before any investments.
Gold breaks through $4,000, has the bulls returned?You might be surprised if I said gold could continue to decline? But the truth is, I'm not surprised. I see this round of trend very clearly: the break below the 4000 mark was just a brief "acceleration" rather than a true reversal of direction. After the price broke through, it quickly rose to around 4017. This performance is more like an emotional release than a trend reversal. After all, the 4000 level has been breached or recovered many times before. There have been too many short-term fluctuations, and the real significance has already been digested by the market's inertia. I maintain a bearish outlook because the chart structure has reached the testing area of the channel's low point, a key position I have repeatedly emphasized. There are only two possibilities for the trend: either the market will soar upwards and return to the upward channel, or it will begin a new round of decline. What I want to seize is the volatility opportunity in the latter. Looking at the key levels: the highs this week are 4050, 4040, and 4030. If the rebound stops in the 4020-4030 area, then a short-term top has likely appeared. At this point, entering a short position would be extremely cost-effective. As long as the market cannot regain a foothold above 4030, I remain firmly bearish, with targets to watch for a break below 4000 and further down to the 3980-3960 area. I don't strive for perfect predictions, but every move I make must be logical, structured, and valuable. When opportunities arise, do not hesitate or waver; execution is key. Seek victory through stability and do not blindly follow the noise of the market.

IQ is looking bullish with a strong momentumGood momentum and bouncing right off the supporting trnd line. Golden cross recently occured in its most bullish form - 50/200 smas.

SANA is looking for a little cooling during a bullish runafter making higher highs and higher lows SANA will probably start to turn upward in a few days, around 3.65$ if it wont bounce off of the 50 SMA. looking quite good. also recently cross the 1B dollar mktcap.

XAUUSD XAU/USD – Gold Analysis
Gold is approaching the upper boundary of the descending channel after a strong bounce from the midline support earlier today.
As it nears this zone, price faces a confluence of resistance factors: the descending trendline, the 0.5 Fibonacci retracement, and the upper Bollinger Band.
From this area, I’ll be looking for a short setup, targeting a move back toward the midline of the channel to capture the liquidity left by today’s upward move.
Fundamental Outlook:
The U.S. dollar remains firm as investors continue to favor USD as a safe-haven amid ongoing geopolitical tensions and uncertainty around global growth.
The Federal Reserve’s cautious stance and limited expectations for rate cuts are supporting higher Treasury yields, which typically weigh on gold prices.
However, gold’s safe-haven demand could re-emerge if geopolitical risks intensify or U.S. economic data begins to soften.
For now, the short-term bias remains bearish, with gold under pressure from strong USD fundamentals and technical resistance zones above.
Summary:
📈 Testing major resistance (trendline + 0.5 Fibo + Bollinger top).
📉 Looking for short setups near 4024.
🎯 Target: Mid-channel around 3962.
⚙️ Fundamentals: Strong USD and yields keep gold capped short-term.
💡 Bias: Bearish near resistance, bullish only if price breaks above the channel.

US30 – Correction Toward 47100 | Next Leg Up Toward 47920US30 – MARKET OUTLOOK | Bullish Bias Above 47100
US30 is showing a mild bearish correction after facing resistance near 47460, but the broader structure remains bullish while price holds above 47100.
🔼 Above 47460: Bullish continuation toward 47750 → 47920 → 48200.
🔽 Below 47100: Bearish correction possible toward 46920 → 46600.
Pivot: 47430
Support: 47100 · 46920 · 46600
Resistance: 47750 · 47920 · 48200
US30 stays bullish while above 47100, but a confirmed close below this level could trigger a short-term bearish correction toward 46920.

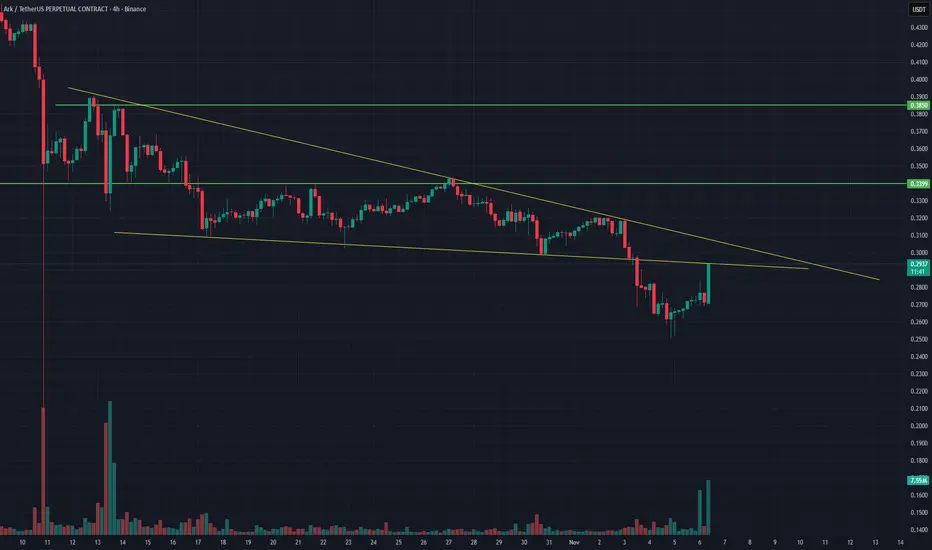
ARKUSDT 4H ChartPrice is approaching the downtrend resistance after forming a potential falling wedge pattern.
A breakout above the yellow trendline could confirm bullish momentum with targets at 0.3399 and 0.385.
Volume is increasing, which might support a breakout scenario.
📈 Watching closely for confirmation on the 4H close.
USNAS100 | Buyers Hold Control Above 25440USNAS100 | Overview
The price reached the resistance zone after stabilizing above 25440.
Currently, it appears to be retesting 25440 before attempting another push higher toward 25700 – 25820.
A 1H close above 25820 would confirm further bullish momentum toward the all-time high (ATH) at 26170.
However, a move below 25440 would indicate renewed bearish pressure toward 25220, with a confirmed break below 25220 activating a broader downward trend.
Pivot Line: 25700
Resistance: 25820 · 25960 · 26170
Support: 25440 · 25230 · 25010
Outlook:
Bullish while above 25440, targeting 25700–25820.
Bearish scenario activates only below 25220.

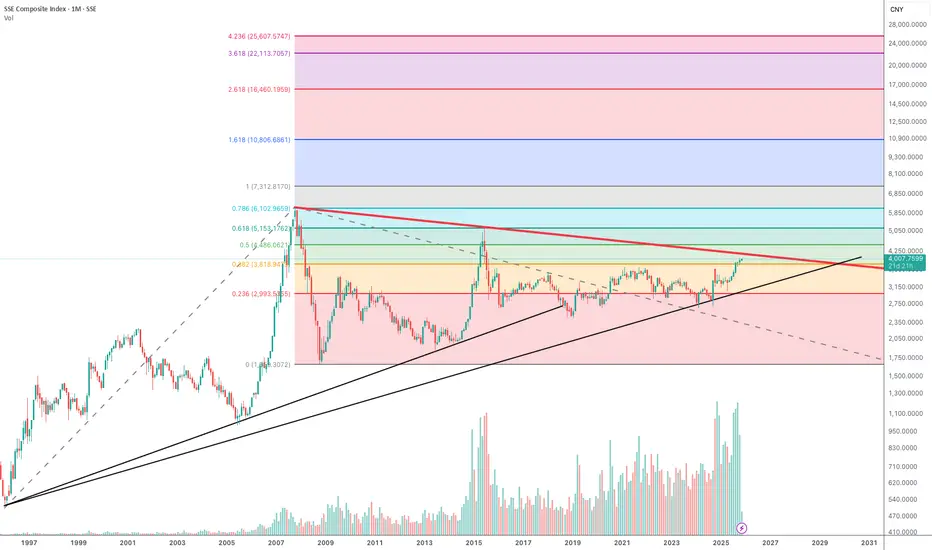
China exHKOnce the SSE Comp. is breaking its 18 year-downtrend, the index could quickly approach completely different levels...
NZDUSD - Triple Confluence Zone in Play!NZDUSD has been in a steady bearish trend, but the pair is now reaching a major confluence area that could act as a strong turning point.
🔎The blue circle marks the intersection of two descending trendlines and a key demand zone, making it a massive area to look for long opportunities.
⚔️This triple intersection increases the probability of a bullish rebound, especially as the pair is also showing signs of being oversold. A potential rejection from this zone could trigger a short-term correction toward the upper orange trendline, aligning with the next resistance area.
🏹As long as this demand zone holds , the bulls have a chance to step in and shift short-term momentum upward.
⚠️ Disclaimer: This is not financial advice. Always do your own research and manage risk properly.
📊All Strategies Are Good; If Managed Properly!
~Richard Nasr

GBPUSD is Tanking Under The Pressure of a Strong Dollar!!Hey Traders, in today’s trading session we’re monitoring GBPUSD for a selling opportunity around the 1.31000 zone. The pair has broken below a key support level and is now showing signs of a potential retracement, possibly setting up a continuation to the downside.
From a fundamental standpoint, the Federal Reserve’s firm tone and the reduced likelihood of a rate cut in December continue to support dollar strength, keeping pressure on the pound.
Watching closely for rejection signals near 1.31000 that could confirm bearish momentum resuming.
Trade safe,
Joe
